


Spectra, Lifetime and Quantum Yield of Upconversion Nanoparticles
Key points
- Upconversion nanoparticles are nanoscale particles composed of rare-earth elements that facilitate upconversion.
- Photon upconversion is the absorption of low-energy photons followed by the emission of higher-energy photons.
- Applications of upconversion nanoparticles include solar energy, biomedical imaging and drug delivery.
- The upconversion spectrum, lifetime and quantum yield of upconversion nanoparticles were characterised using the FS5 Spectrofluorometer.
Introduction
Photon upconversion (UC) is the conversion of two or more lower-energy photons into a higher-energy photon. An important type of upconversion material are upconversion nanoparticles (UCNPs), which are nanoparticles composed of rare-earth elements such as erbium and ytterbium embedded in a host matrix. UCNPs can be used to convert near-infrared light to higher energy light in the visible or ultraviolet region of the spectrum.
UCNPs have a vast range of potential applications. In solar energy harvesting, they can enhance the performance of photovoltaic devices and solar cell efficiency by converting unused solar spectrum segments into higher-energy photons. While in biomedicine UCNPs can be deployed for non-invasive imaging and diagnostics. As imaging contrast agents, they enable high-resolution imaging by converting infrared light into visible light, enabling deeper tissue penetration and reduced background signal. In drug delivery, their unique optical properties can be harnessed for the controlled release of therapeutic agents.1
Understanding the upconversion luminescence properties of UCNPs is crucial for tailoring their properties to specific applications and optimising performance. In this Application Note, an Edinburgh Instruments FS5 Spectrofluorometer was used for a complete upconversion luminescence characterisation of UCNPs comprising spectral, time-resolved, and quantum yield measurements.
Materials & Methods
The sample studied was NaYF4:Yb,Er UCNPs with a polyethylenimine (PEI) polymer coating dispersed in deionised water at a concentration of 10 mg/mL. The UCNP dispersion was held in a 10 mm × 10 mm quartz cuvette and characterised using an FS5 Spectrofluorometer. For excitation, the FS5 was equipped with a 2W 980 nm laser diode with a pulse modulation box (PM-2), enabling both CW and pulsed operation. For detection, the FS5 was equipped with two photodetectors: a PMT-900 and PMT-1010 (FS5-NIR upgrade) and multichannel scaling (MCS) lifetime electronics. The PMT 900, with a spectral range of 200-900 nm, was used for spectral and lifetime measurements, while the PMT-1010, with its extended spectral range out to 1010 nm, was used for quantum yield determination. The sample cuvette was held in the SC-05 Standard Cuvette Module for spectral and lifetime measurements, and the SC-30 Integrating Sphere Module was used for quantum yield measurements.
Figure 1: Edinburgh Instruments FS5 Spectrofluorometer.
Upconversion Spectrum
First, the emission spectrum of the nanoparticles was acquired (Figure 2) using the 980 nm laser diode in CW mode for excitation and the PMT-900 for detection. The emission spectrum can be used to identify the emissive energy transitions in the material. The emission arises from absorption of several low energy 980 nm photons by multiple Yb3+ ions (sensitisers), which transfer their energy to a single emissive Er3+ ion (emitter). The energy transfer takes place via a non-radiative multi-ion upconversion process. The emission peak centred around 660 nm is the 4F9/2 –> 4I15/2 transition of Er3+, while the additional emission peaks at 521 nm and 545 nm originate from the 4H11/2 –> 4I15/2 and 4S3/2 –> 4I15/2 transitions respectively (Figure 3).1,2
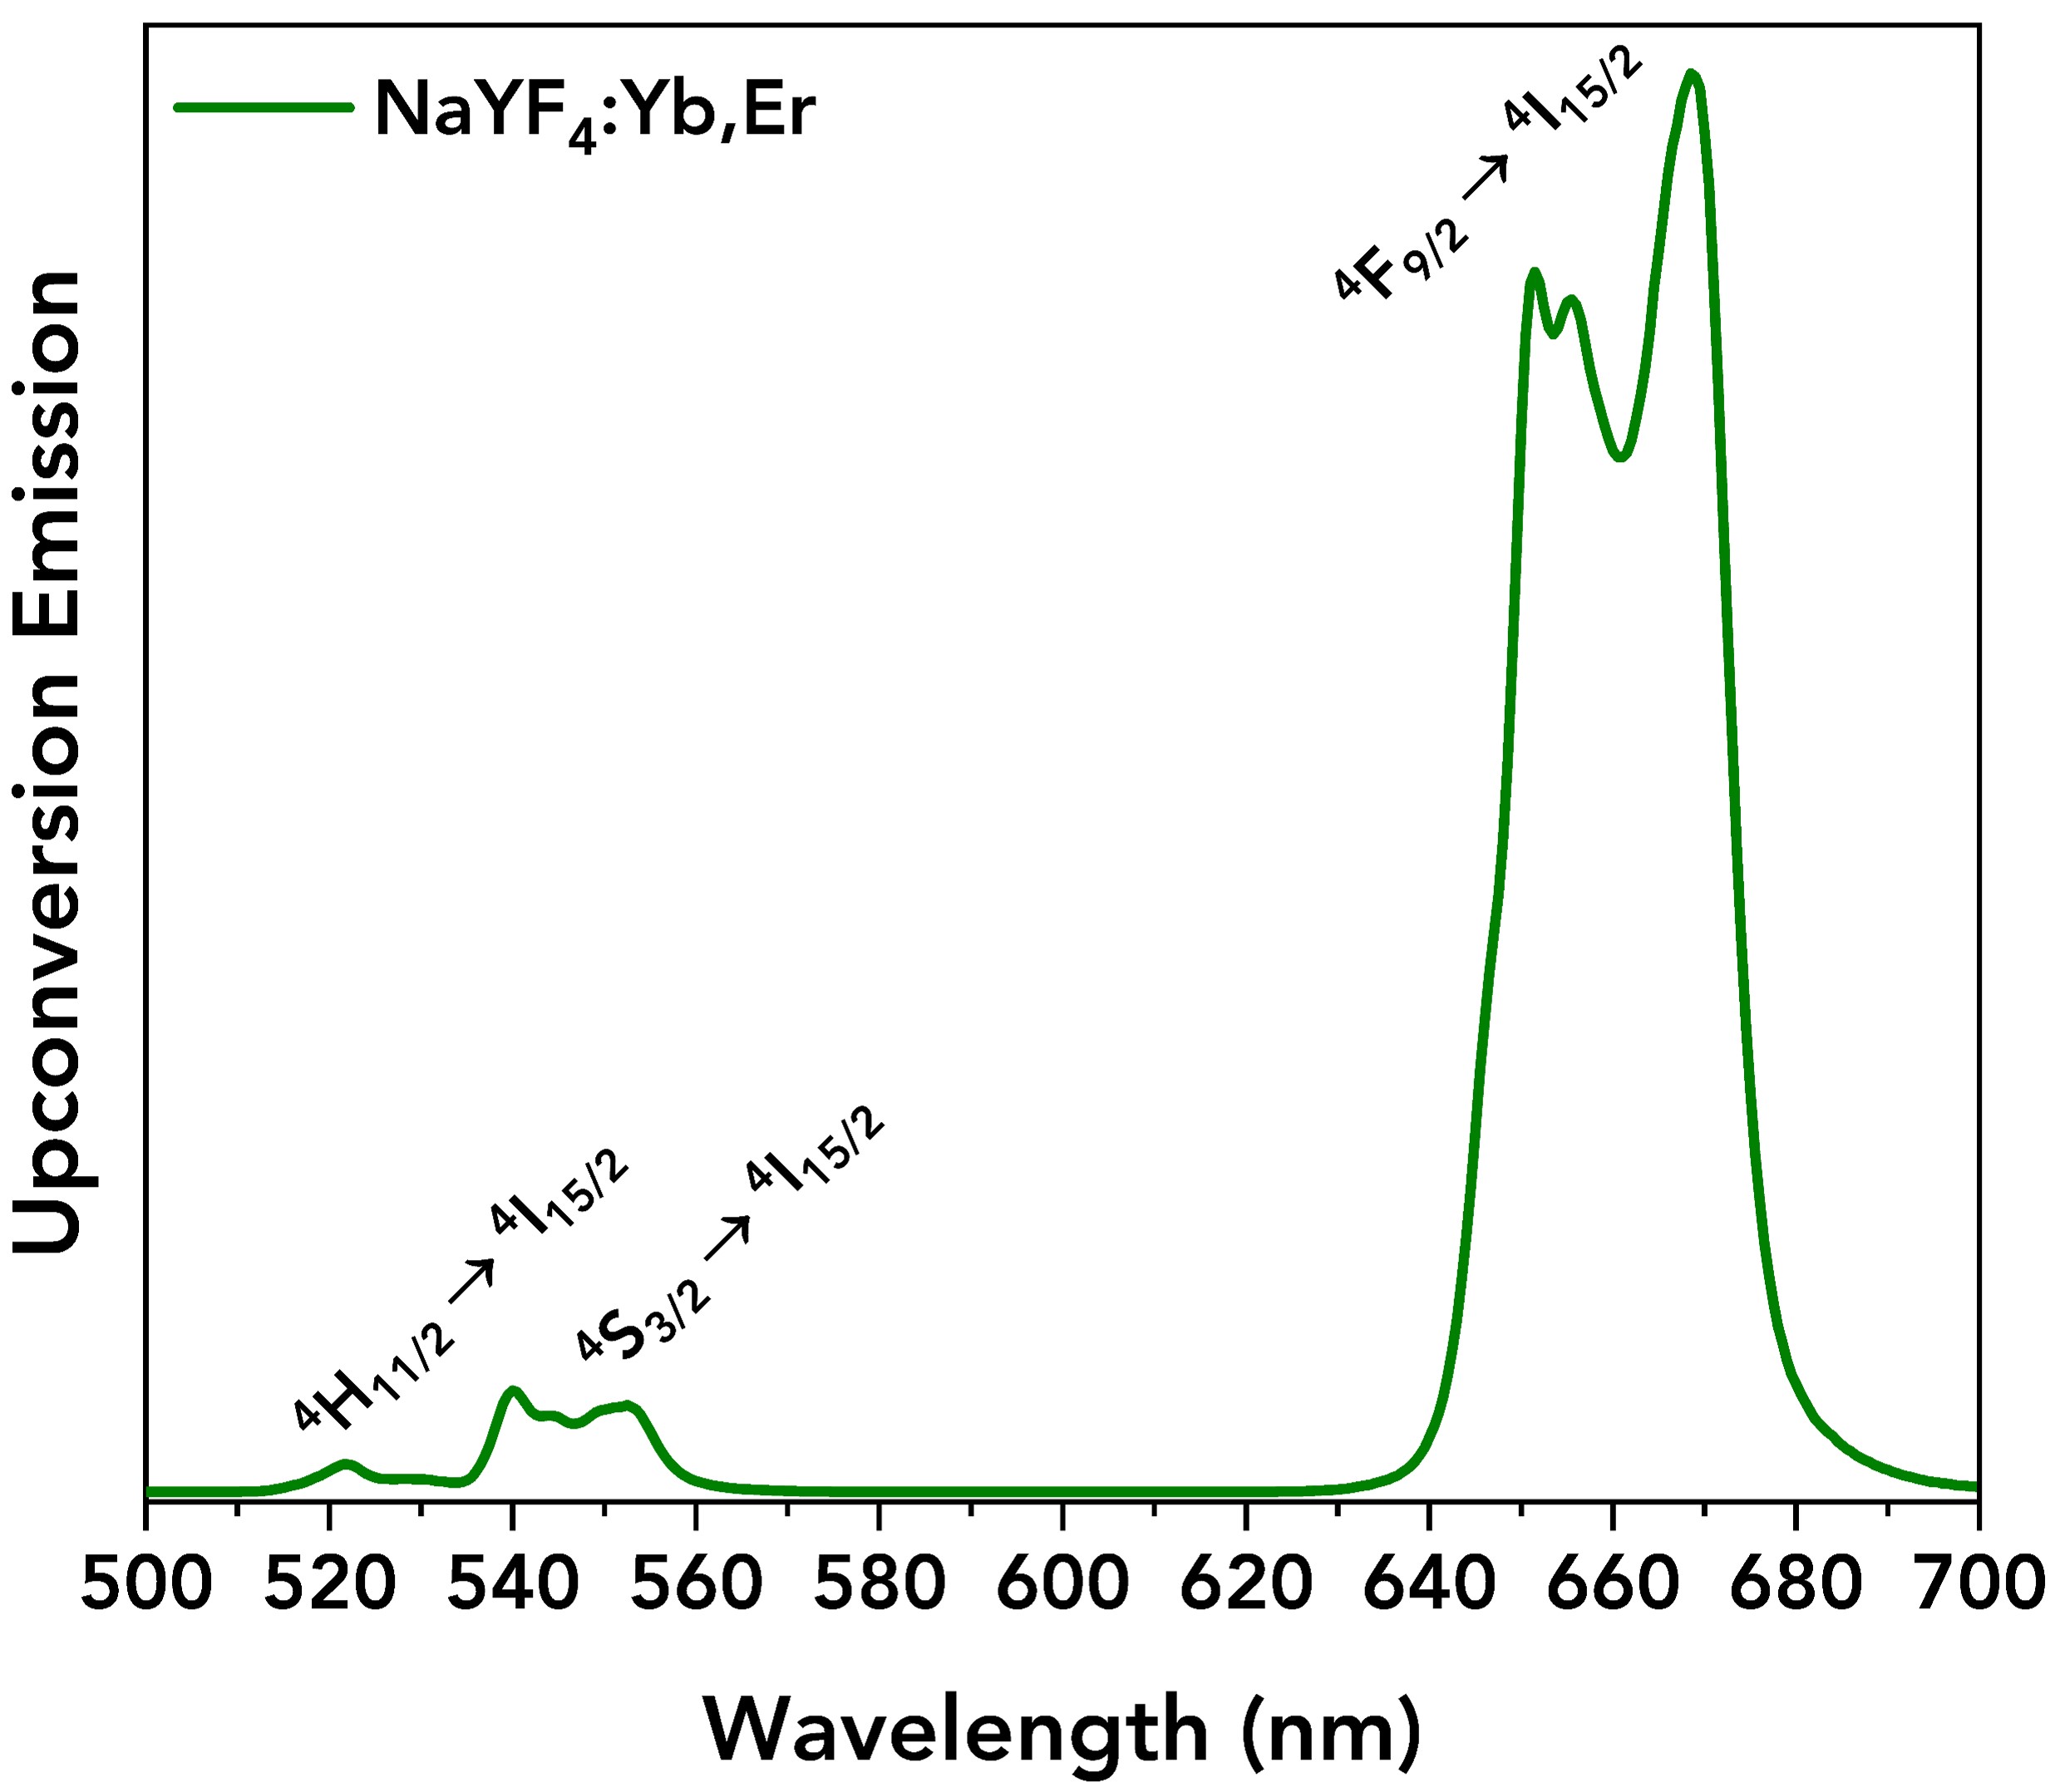
Figure 2: Upconversion emission spectrum of the UCNPs acquired using a 2 W 980 nm laser diode in CW mode and the PMT-900.
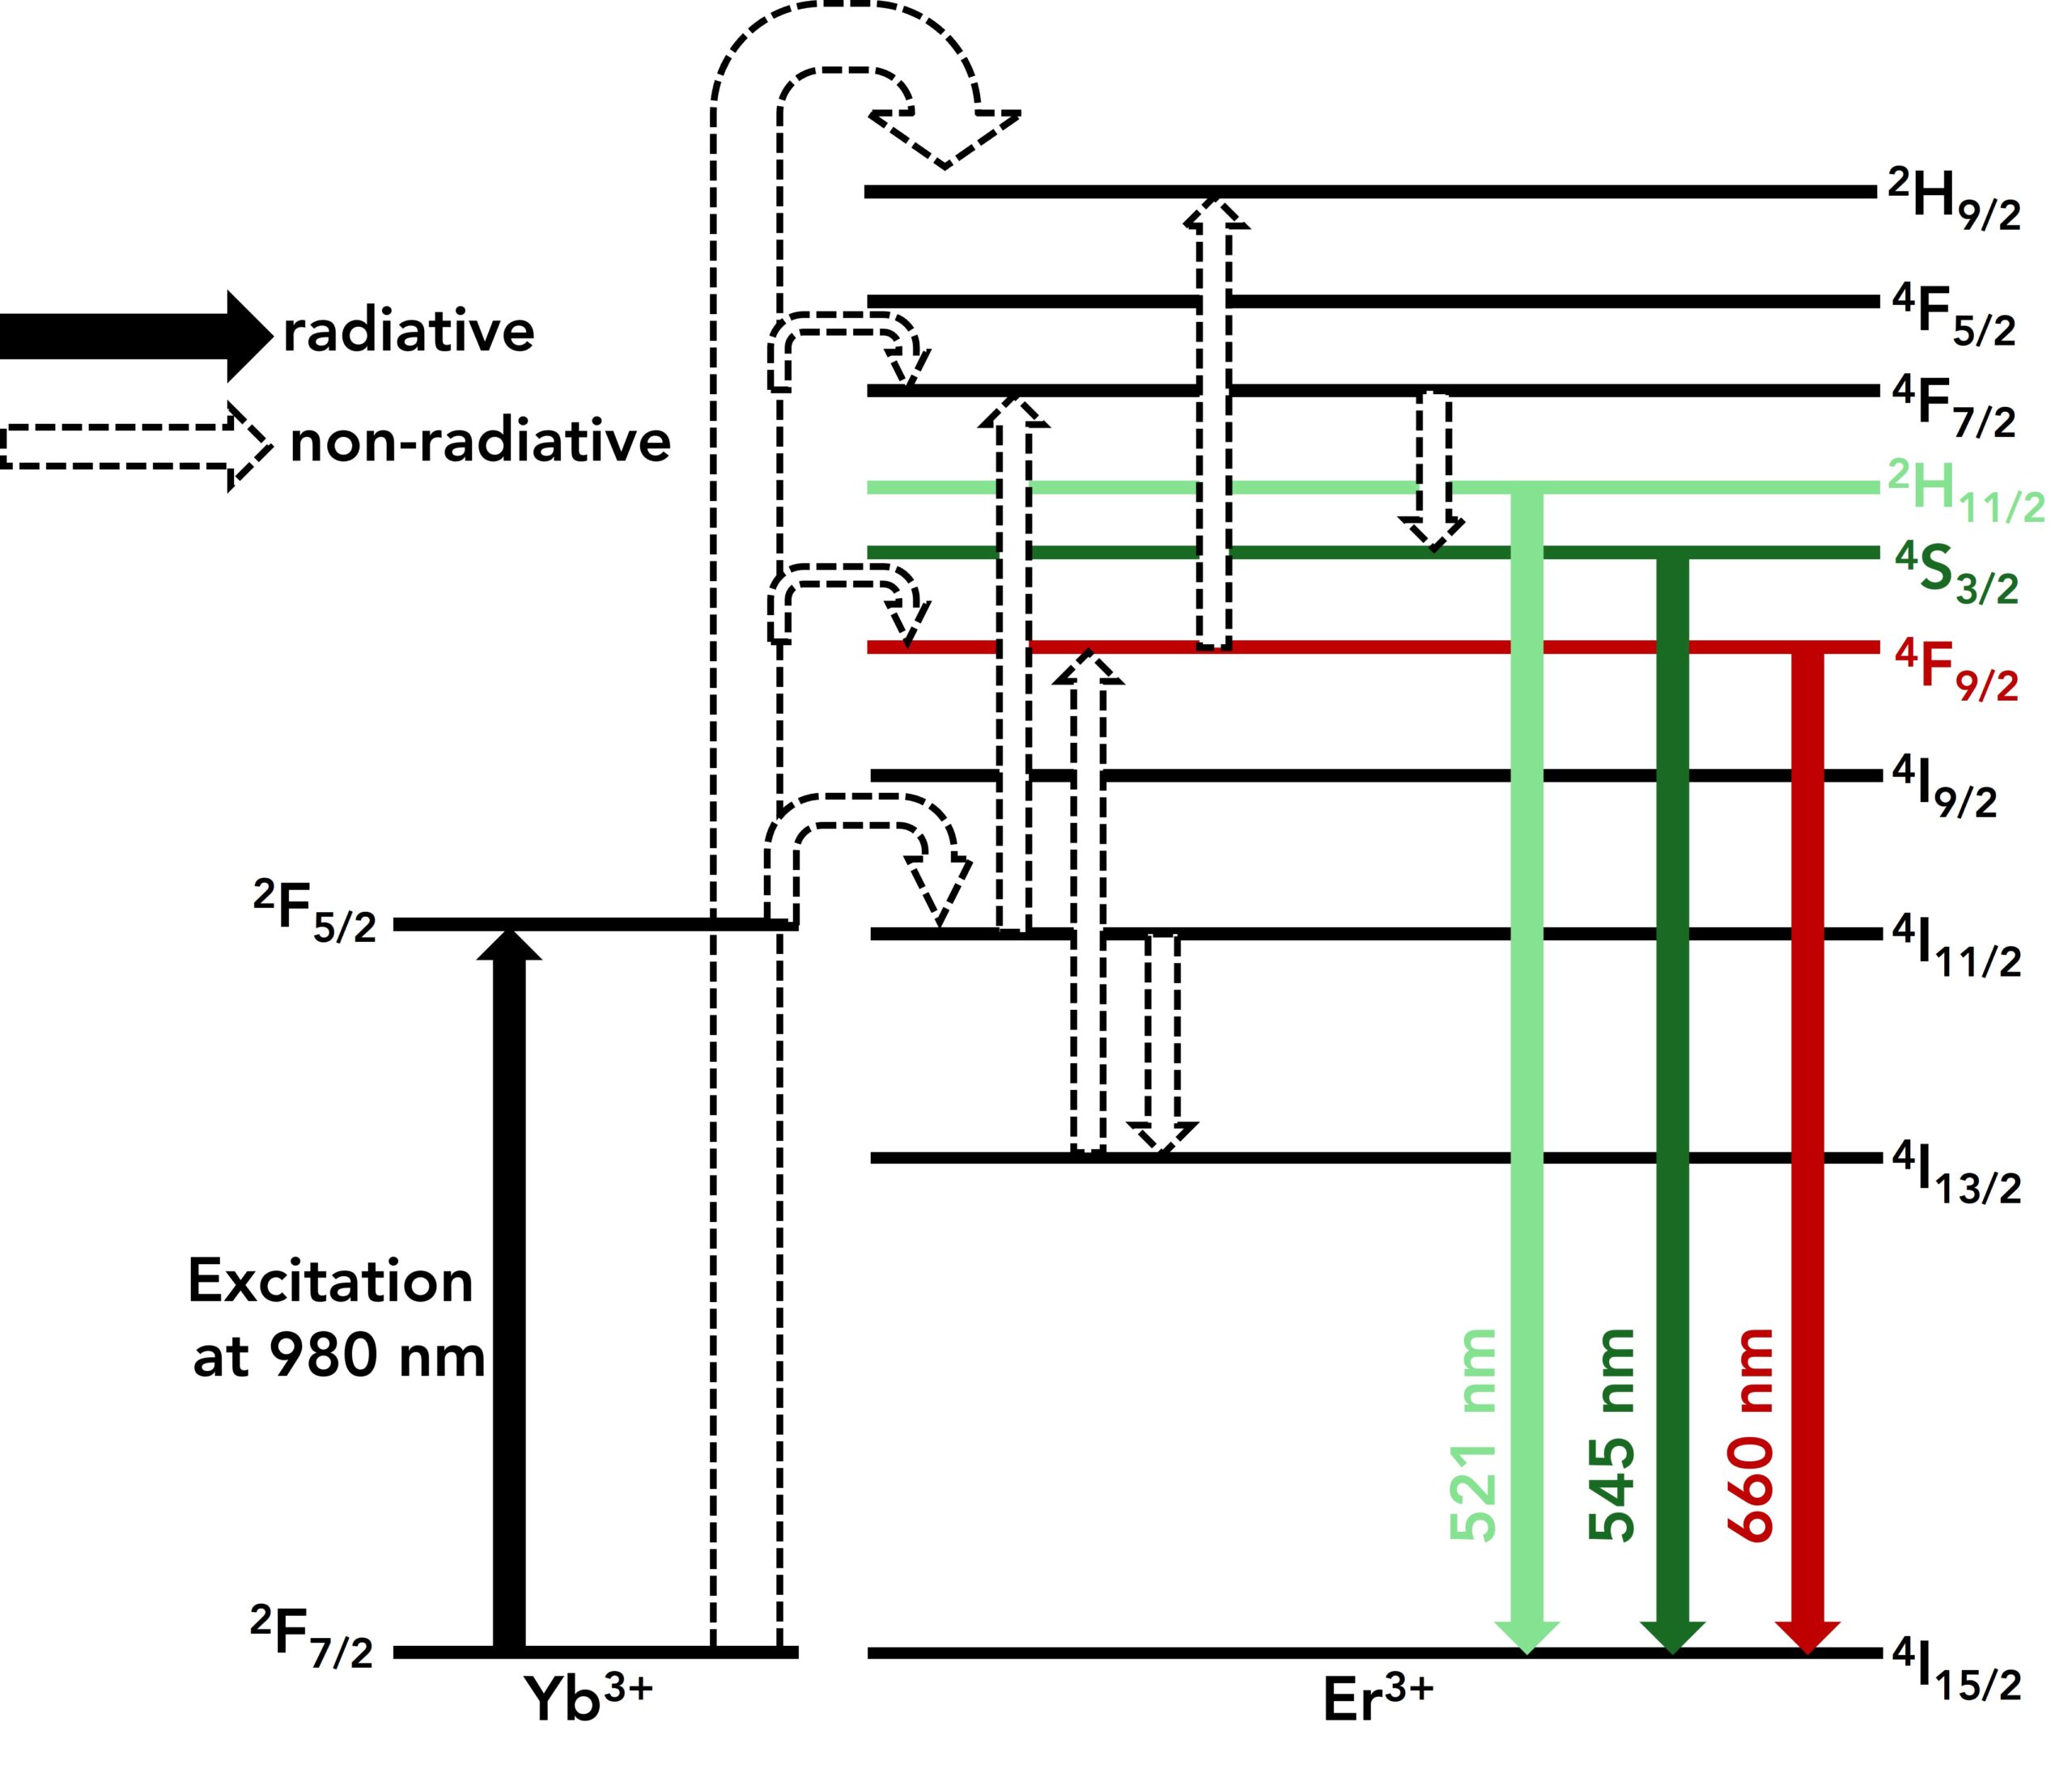
Figure 3: Energy level diagram showing the upconversion process within the NaYF4:Yb,Er nanoparticles.
Upconversion Lifetime
The upconversion decay of the 4F9/2 → 4I15/2 transition at 653 nm was then measured, Figure 4. The 980 nm laser diode was set to pulsed mode with a repetition rate of 500 Hz and a pulse width of 10 µs, and the upconversion decay was acquired using MCS single photon counting. The decay was then fitted in Fluoracle® using a two-exponential model, yielding an intensity average lifetime of 125 µs.
The lifetime is shorter than previous reports of similar materials, which showed lifetimes above 440 µs.3 A potential explanation for the difference in the lifetime values is the deionised water used for dilution, the presence of which could introduce strong quenching effects, resulting in a reduction of the lifetime.
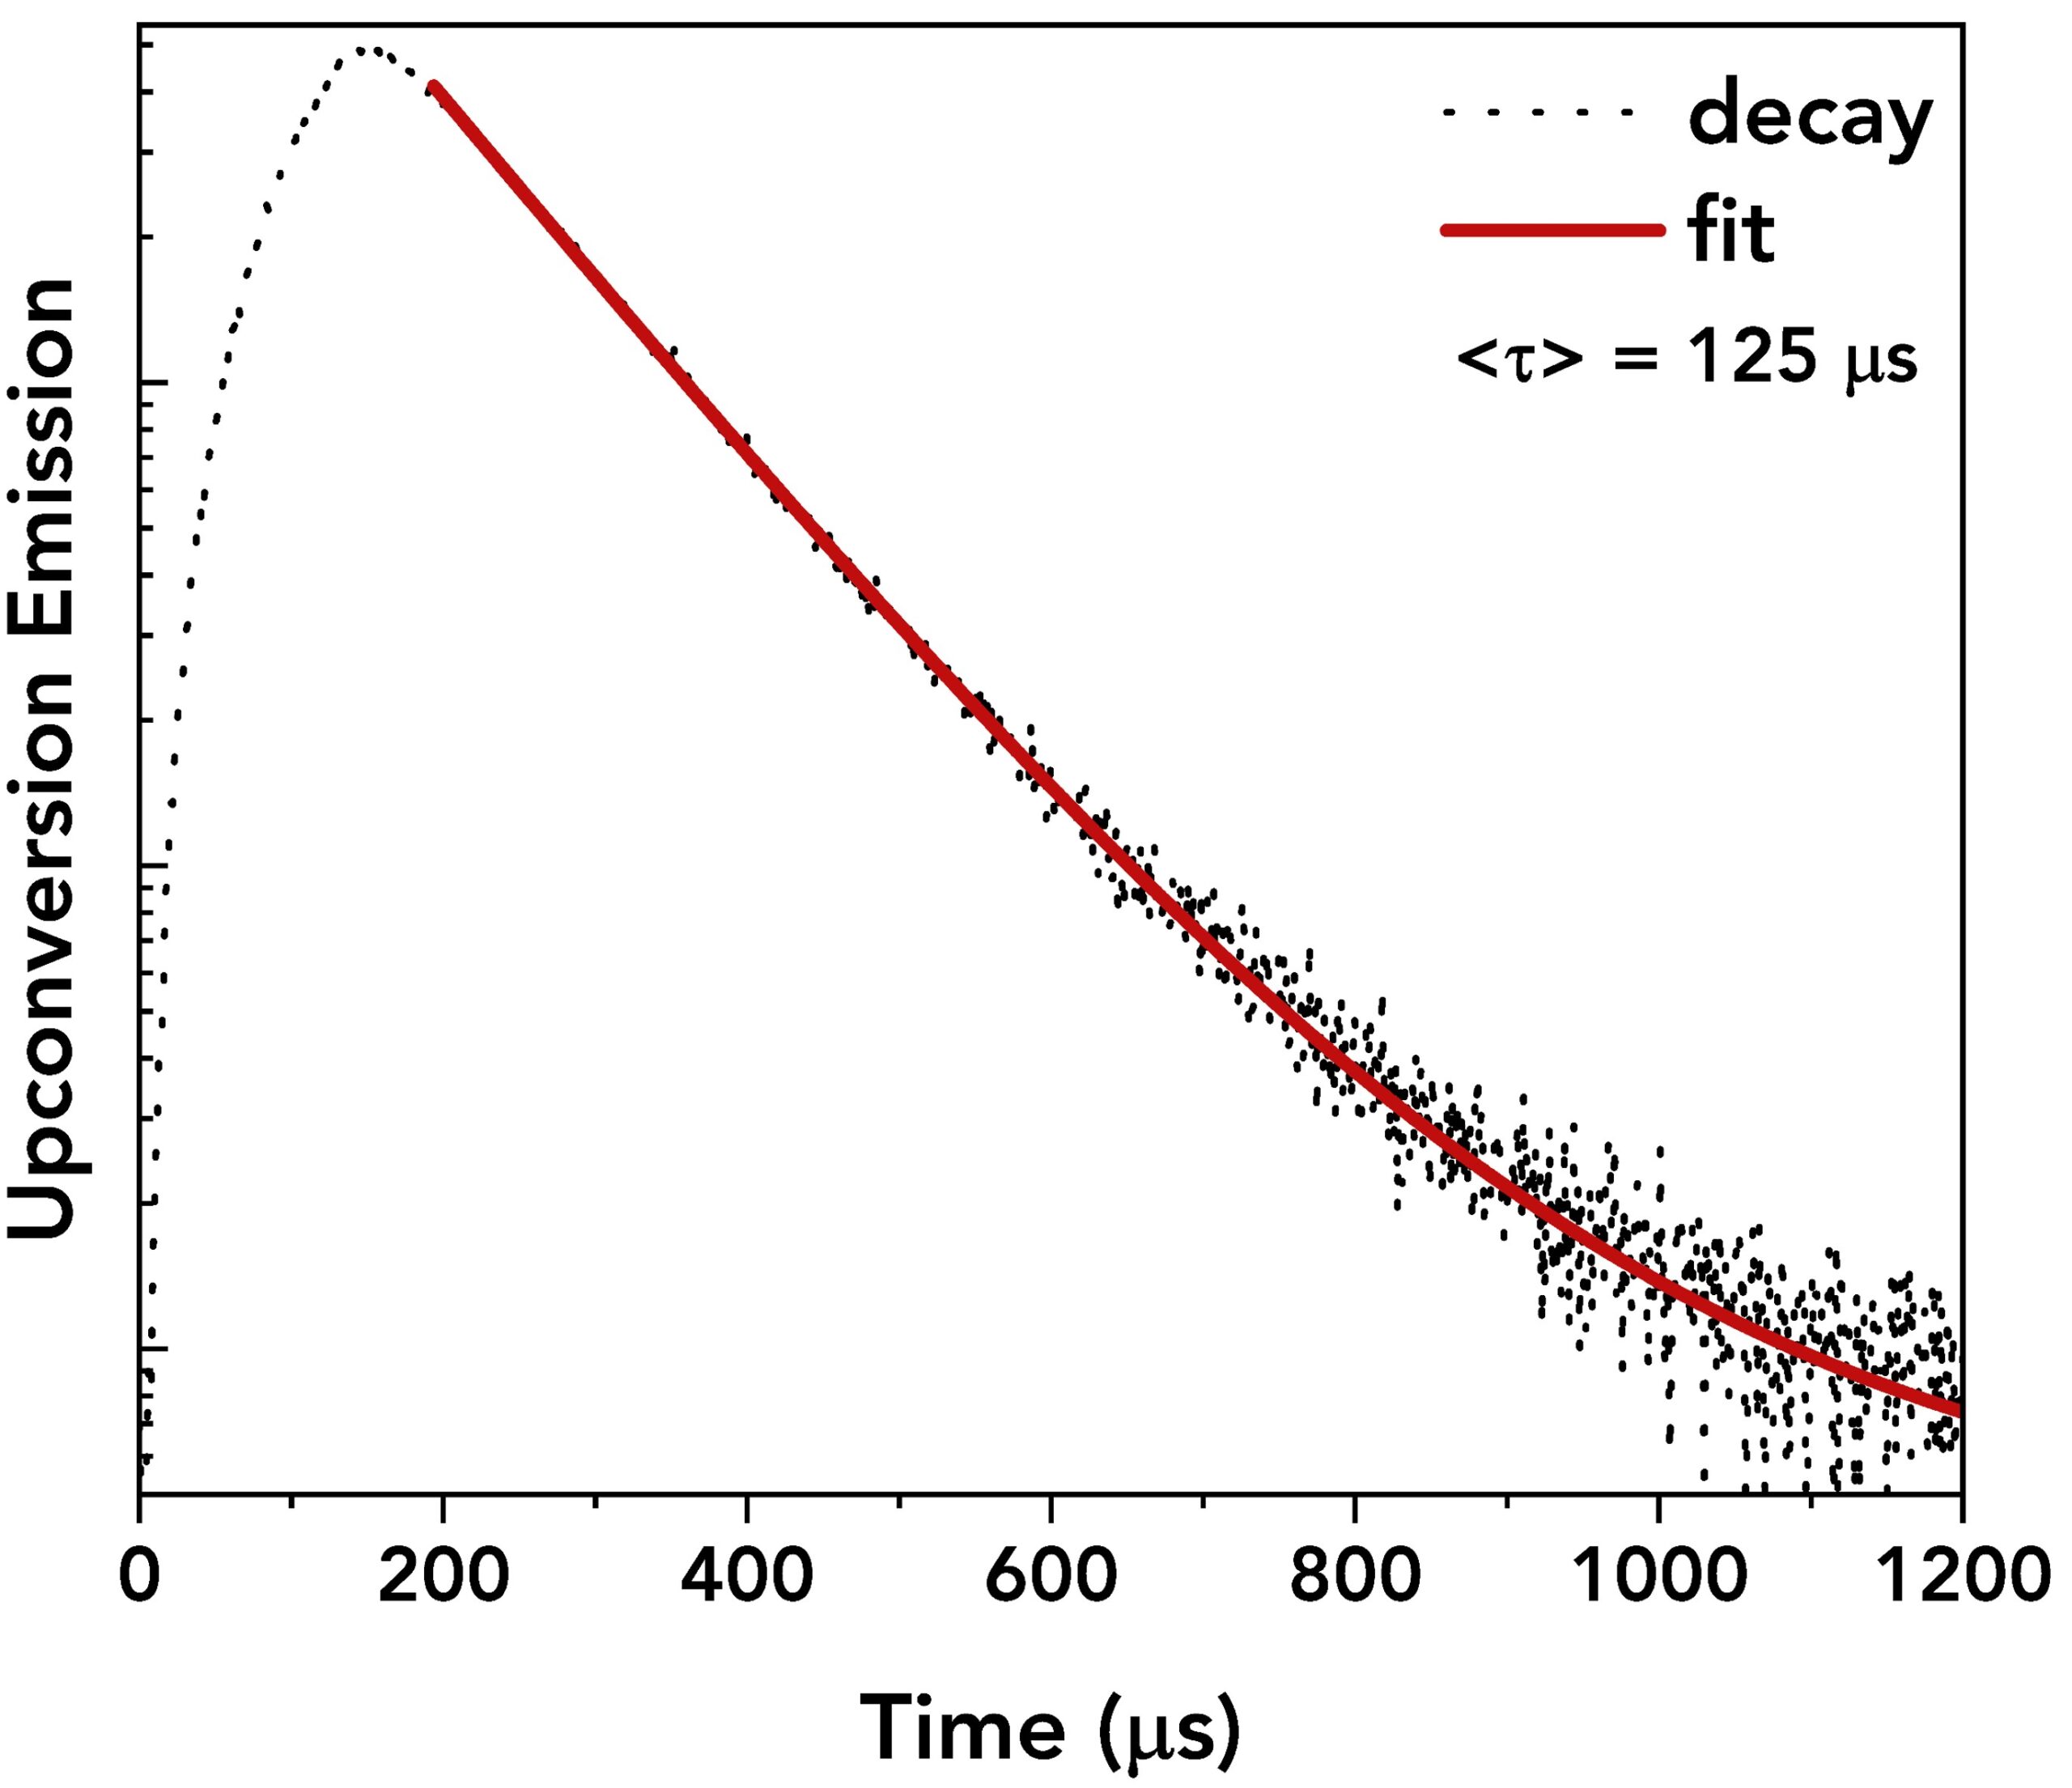
Figure 4: Decay of the UCNPs at 653 nm acquired using a 2 W 980 nm laser diode in pulsed mode at 500 Hz and the PMT‑900.
Quantum Yield
Measuring the quantum yield is critical for assessing the efficiency that UCNPs can generate upconverted light. UCNPs generally have lower quantum yields than their bulk counterparts. This is attributed to various factors such as the forbidden 4f – 4f transition and inherent issues like poor crystallinity and surface defects.4 The development of UCNPS with higher quantum yields is an ongoing research challenge.
To determine the upconversion quantum yield, the FS5 SC-30 Integrating Sphere Module was used. The SC‑30 fits directly in inserts into the FS5 with no alignment or optical fibres required. For light detection, the secondary PMT-1010 detector of the FS5 was used. The extended spectral range PMT-1010 to 1010 nm enables an accurate measurement of the 980 nm excitation light and is required for 980 nm excitation upconversion quantum yield measurements.
To determine the quantum yield, the emission and excitation scatter from the UCNP sample cuvette and from a reference cuvette containing deionised water only were measured in the SC‑30. Figure 5 shows the emission and scattering peaks of the UCNPs and deionised water reference. The quantum yield was then calculated using the quantum yield wizard of the Fluoracle software which is based on the formula:

E is the integrated emission intensity, and S is the integrated scattering intensity. The quantum yield was calculated to be 0.014%. Such quantum yield values are typical for upconversion materials and are consistent with prior research.4
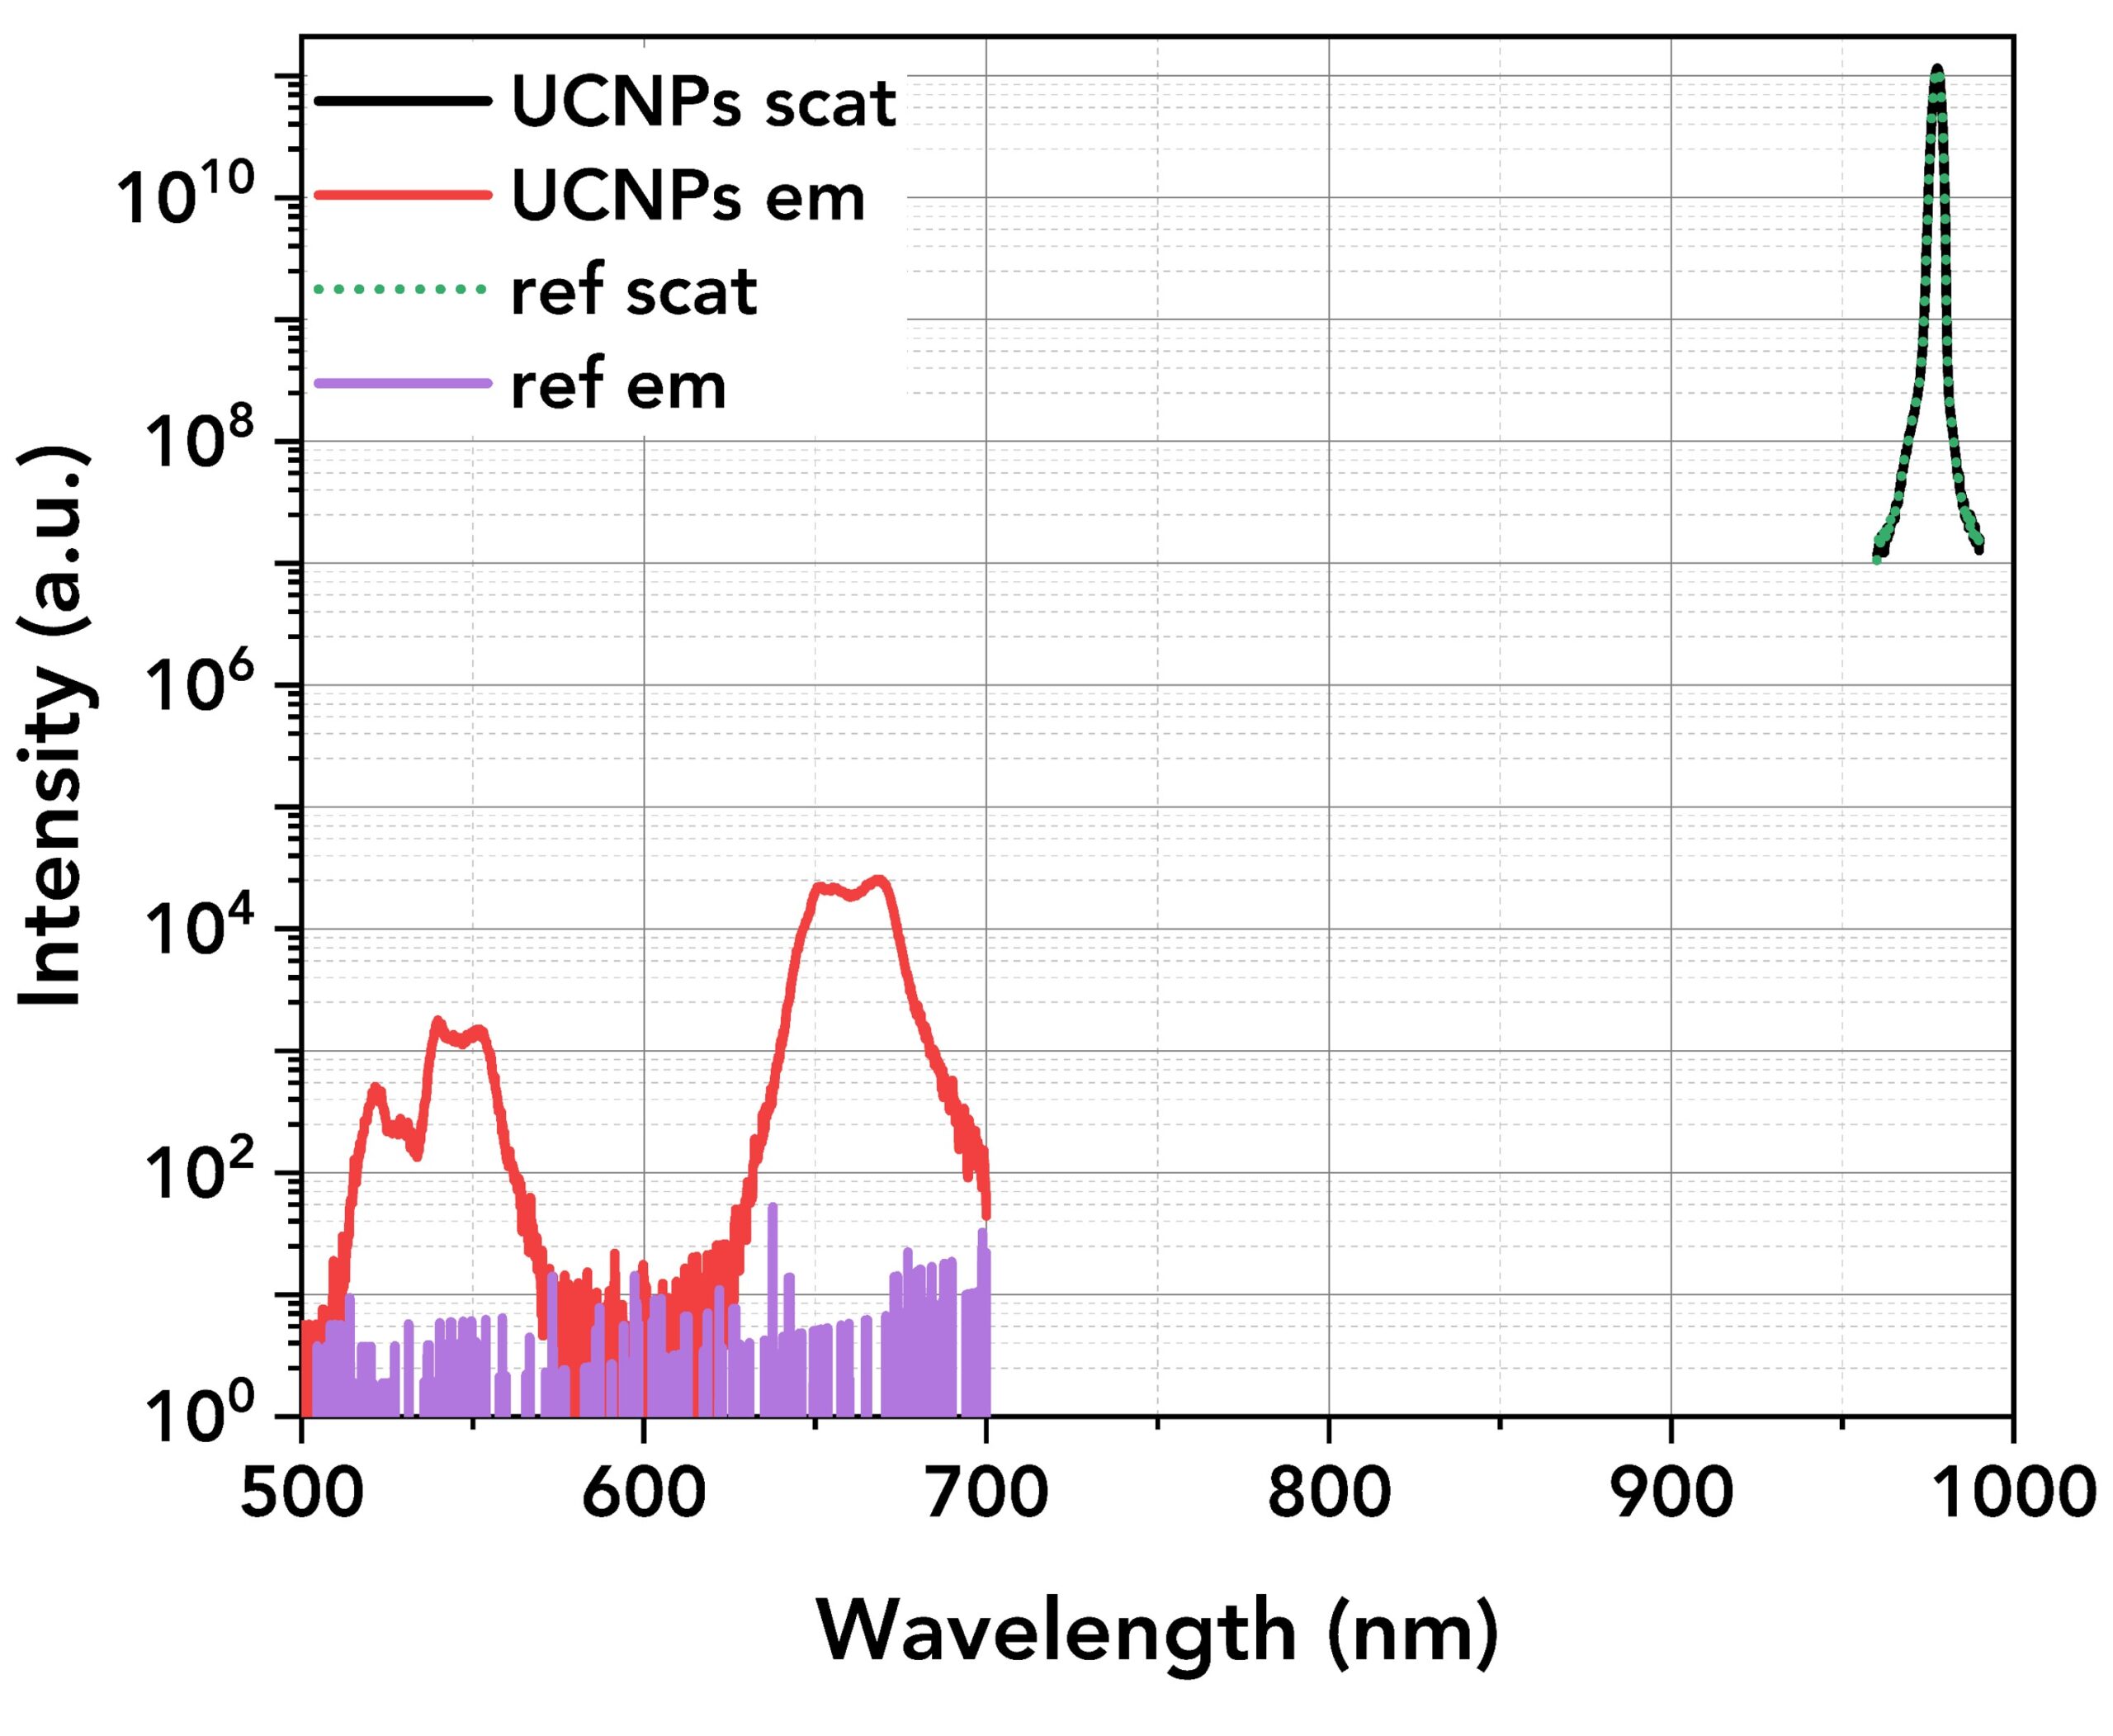
Figure 5: Scattering and emission spectra of the UCNPs sample and deionised water reference acquired using a 2 W 980 nm laser diode in CW mode and a PMT-1010.
Conclusion
This Application Note demonstrates a complete upconversion luminescence characterisation of upconversion nanoparticles using the Edinburgh Instruments FS5 Spectrofluorometer. The flexible source, detector and sample module upgrade options of the FS5 enables upconversion spectral, lifetime and quantum yield measurements to performed in a single compact instrument.
Acknowledgements
We are grateful to Dr Lewis MacKenzie and his group from the University of Strathclyde for synthesising the UCNPs used in this application note.
References
- E. MacKenzie, D. Alvarez-Ruiz, & R. Pal, Low-temperature open-air synthesis of PVP-coated NaYF 4.
- Birch, et al. Influence of polyvinylpyrrolidone (PVP) in the synthesis of luminescent NaYF 4.
- Qin, et al. Tuning the upconversion photoluminescence lifetimes of NaYF4:Yb3+, Er3+ through lanthanide Gd3+ doping. Sci. Rep. 8, 12683 (2018).
- M. S. Jones, A. Gakamsky, & J. Marques-Hueso, The upconversion quantum yield (UCQY): a review to standardize the measurement methodology, improve comparability, and define efficiency standards. Sci. Technol. Adv. Mater. 22, 810–848 (2021).
