
Multiple Lifetime Measurements
Multiple Lifetime Measurements – Detect fluorescence and phosphorescence lifetimes from <15 ps to seconds


Fluoracle® is the operating software for the FS5 Spectrofluorometer. It controls all FS5 steady state and time-resolved spectrometer features with a straightforward design concept: focus on all modern photoluminescence spectroscopy applications and provide a user-friendly interface with ‘ready to publish’ outputs.
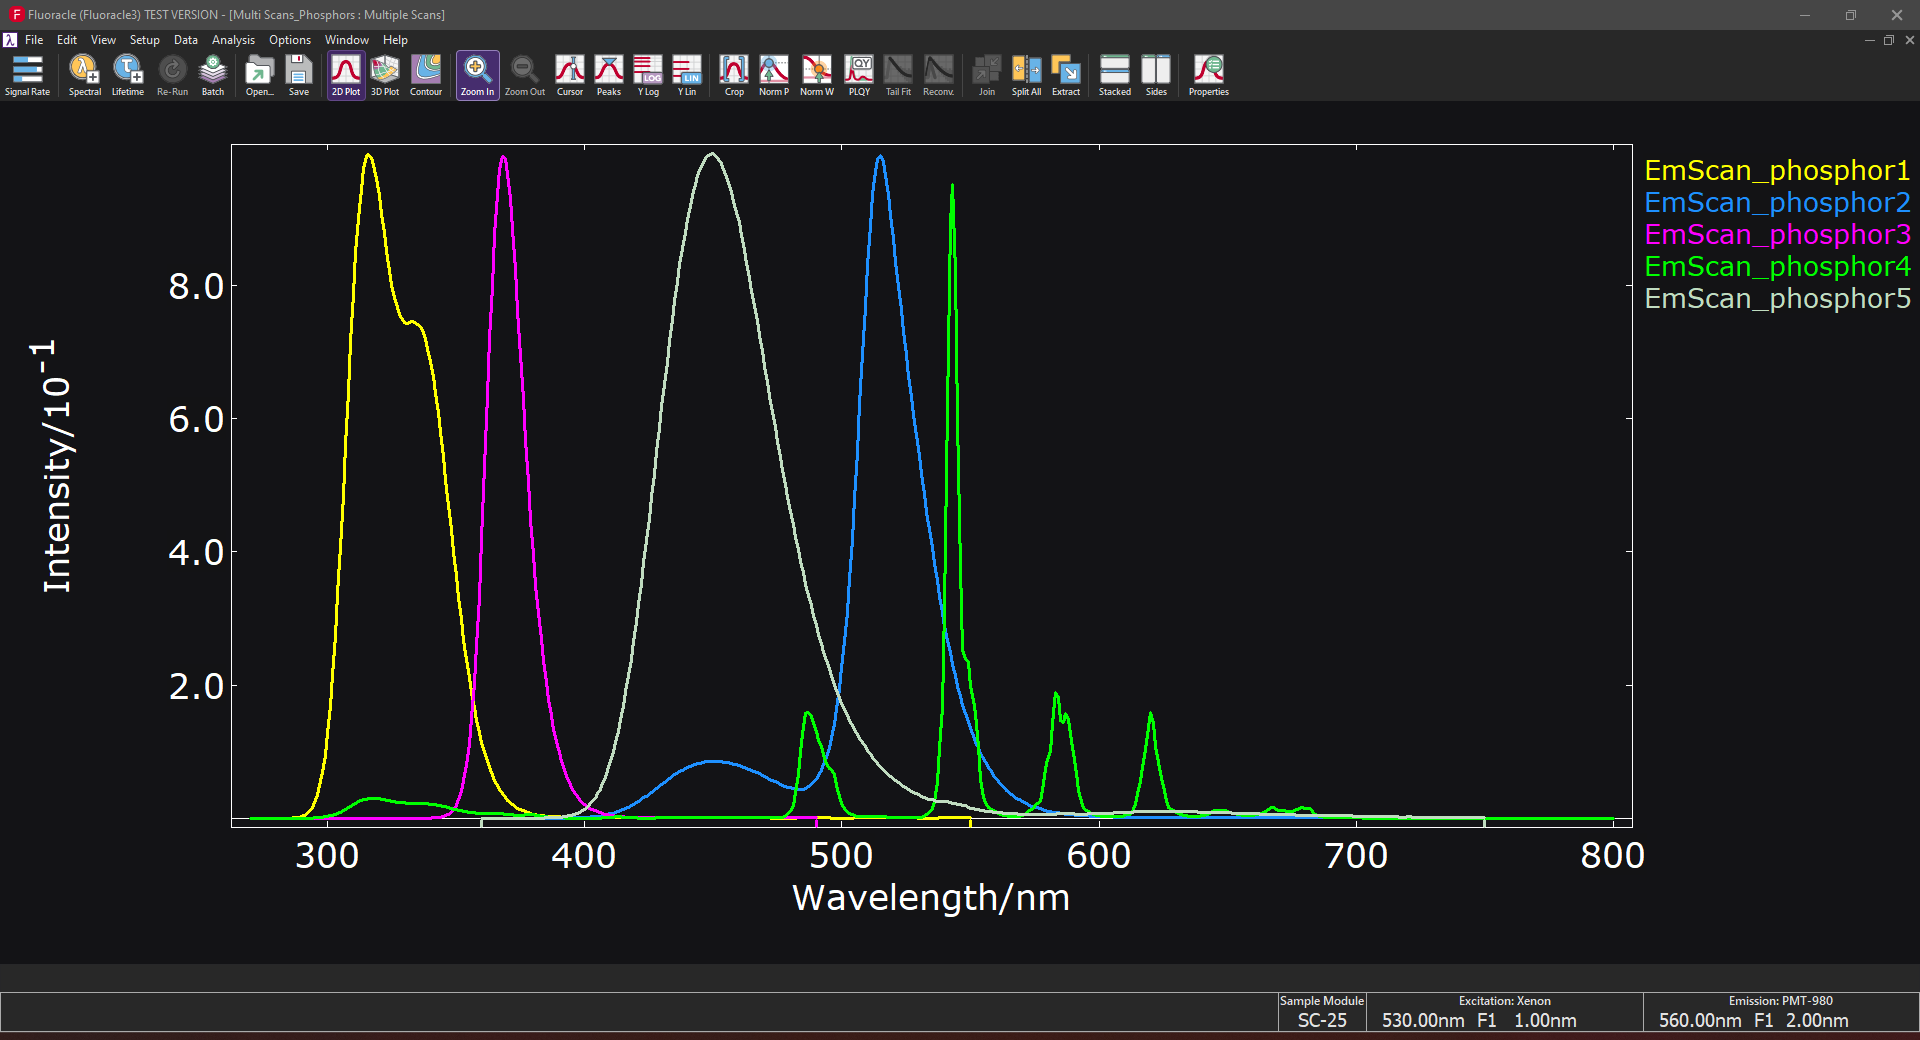
Figure 1: Fluoracle software interface
Whether you select a basic spectral scanning version of FS5 Spectrofluorometer, or you go for an advanced version that includes TCSPC lifetime measurements or integrating sphere measurements, the all-inclusive software will provide instrument options automatically, from data acquisition to analysis and presentation.
Upgrade to FAST Software for advanced fluorescence lifetime analysis.
The FS5 Spectrofluorometer can measure emission spectra up to 1650 nm when equipped with an NIR PMT or up to 2025 nm with an InGaAs detector. These upgrades maintain the standard photon-counting PMT for high sensitivity in the UV-Visible range.
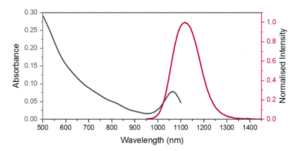
Figure 1: Absorption and emission spectrum of PbS quantum dots in tetrachloroethylene measured in an FS5 with InGaAs-1650 NIR detector (NIRA1650 upgrade).
Kinetic absorption and emission scans are available in the standard FS5 Spectrofluorometer. This capability can be expanded further with a stopped flow accessory for rapid injection of reactants.
![]()
Figure 2: Bleaching of K4[Fe(CN)6] by Ascorbic Acid using the stopped-flow accessory. The absorption kinetic of Fe(CN)63- bleaching was recorded using the transmission detector of the FS5.
The SC-41 plate reader module allows measuring liquid samples with microplates up to 384 wells. As with all sample holder accessories, this microplate reader is compatible with FS5 upgrade options such as NIR detection and time-resolved photoluminescence.
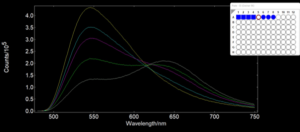
Figure 3: Live measurement display for the SC-41 plate reader
If the FS5 is equipped with the polariser (POL) upgrade, automated measurements of fluorescence anisotropy are possible. A software wizard in Fluoracle guides the user through the acquisition and analysis of spectral and time-resolved (if equipped with TCSPC) anisotropy.
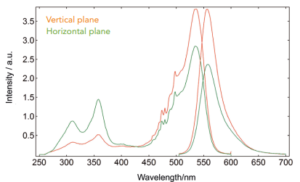
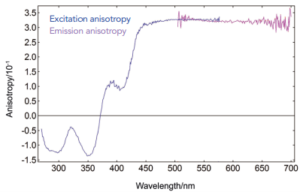
Figure 4: Fluorescence Anisotropy measurement of Rhodamine 6G in glycerol at room temperature (top) and anisotropy result (bottom).
Fluoracle features user-friendly wizards for acquiring and fitting calibration curves, perfect for developing quantitative analysis methods. Peak signals, areas, and ratios can be fitted to linear and non-linear curves.
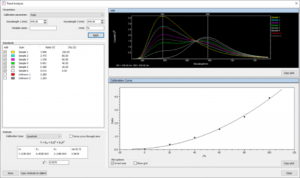
Figure 5: Ratio trend analysis using Fluoracle.
The SC-25 TE cooled sample cassette is controlled by the Fluoracle software allowing automated temperature-dependent measurements of spectra and/or lifetimes. In the example below, it is used for Time-Correlated Single Photon Counting (TCSPC) as a function of temperature.
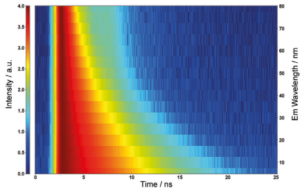
Figure 1: Automatically acquired temperature lifetime map of Rhodamine-B emission in H2O measured using the SC-25 TE-cooled module, from +10 °C to +80 °C.
The FS5 can be equipped with a Multichannel Scaling (MCS) upgrade and a range of high-power lasers suitable for upconversion measurements. Lasers at 808 nm and 980 nm are particularly useful for upconversion of lanthanide samples and can be operated in CW mode for spectra and pulsed mode for MCS lifetimes.
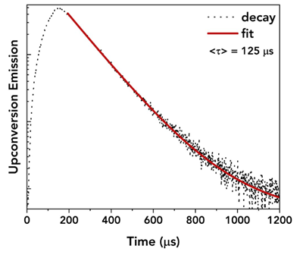
Figure 1: Photoluminescence decay of upconversion nanoparticles (UCNPs) in water at 653 nm acquired in an FS5 with MCS, using a 2 W 980 nm laser diode in pulsed mode at 500 Hz.
Active Gating enables the rapid separation of overlapping fluorescence and phosphorescence spectra. It prevents detector overexposure when measuring weak phosphorescence alongside strong fluorescence, ensuring accurate and reliable spectra.
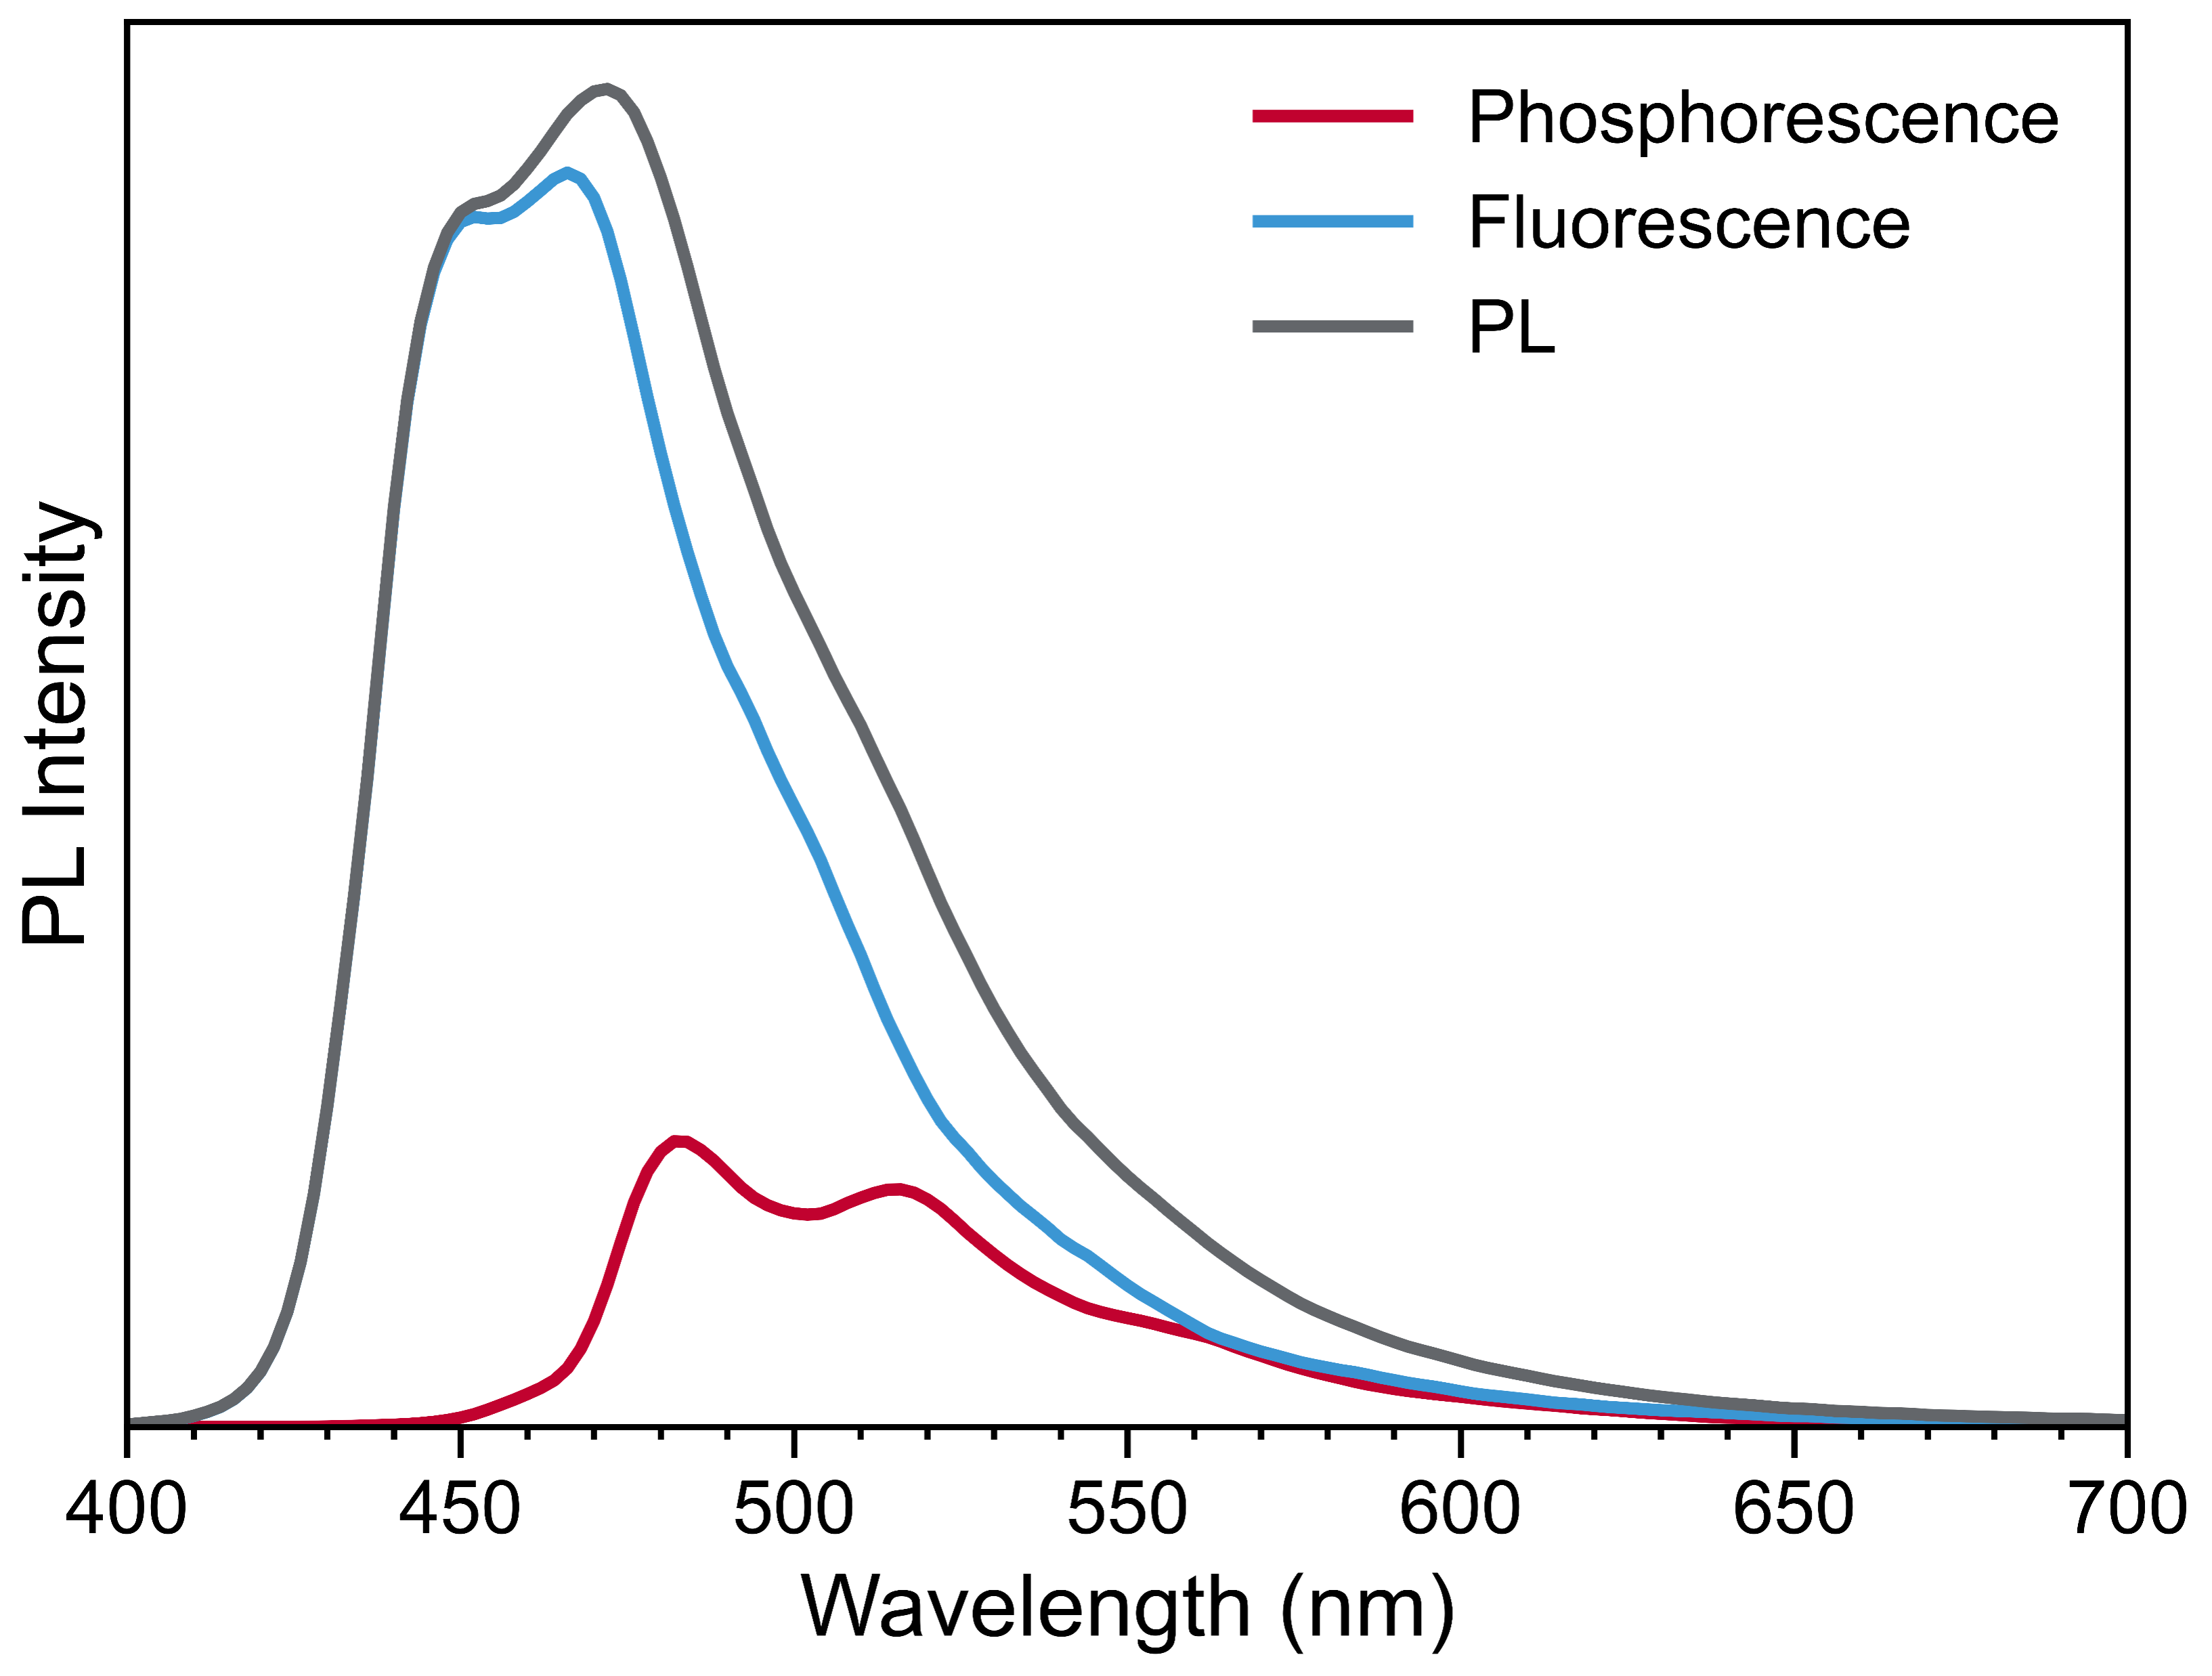
Figure 2: Fluorescence, phosphorescence, and photoluminescence spectra at low temperature
Absolute photoluminescence quantum yield (PLQY) is available for the visible and NIR range using the SC-30 integrating sphere module. An intuitive wizard in the Fluoracle software calculates the PLQY automatically for different sample configurations.
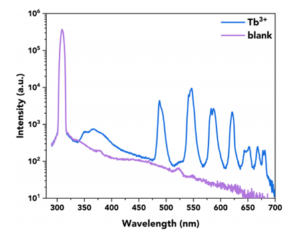
Figure 1: Absolute PLQY measurement from a Tb3+ complex in DI water in the FS5 with SC-30 sample cassette (PLQY = 29.01%). The blank measurement was performed in DI water.
The FS5 offers measurement modules available for practically all applications. These can be purchased at any time and can be easily installed by the user. The installation takes no more than a few seconds. The Fluoracle software automatically recognises which of the measurement modules is in use. This reduces the complexity in the user interface and ensures ease of operation.
Sample Modules available include:
SC-05: Standard Cuvette Holder
SC-06: Two-position Cuvette Holder. Offers automated absorption and two-position measurements.
SC-10: Solid Sample Holder (upright/tilted sample). With external position control.
SC-15: Solid Sample Holder (horizontal sample)
SC-20: Thermostatic Sample Holder (external water bath regulation)
SC-24: TE-Cooled Sample Holder (-50°C to +150°C), software controlled
SC-25: TE-Cooled Sample Holder (-35°C to +105°C), software controlled
SC-26: TE-Cooled Sample Holder (-35°C to +150°C), software controlled
SC-27: 4-position TE-Cooled Sample Holder (-40°C to +105°C), software controlled including automated sample exchange
SC-28: Heated Sample Holder for Powders (up to 300°C)
SC-30: Integrating Sphere for absolute PLQY
SC-41: Microplate reader (up to 384 wells), for automated multiple measurements of spectra and/or lifetimes
SC-50: Optical Fibre Launcher (liquid light guides, SMA, FC)
SC-70: Liquid Nitrogen EPR Dewar
SC-80: Liquid Nitrogen Cryostat, software controlled
SC-90: Cryostage, software controlled
Contact us directly to customise your sample cassette
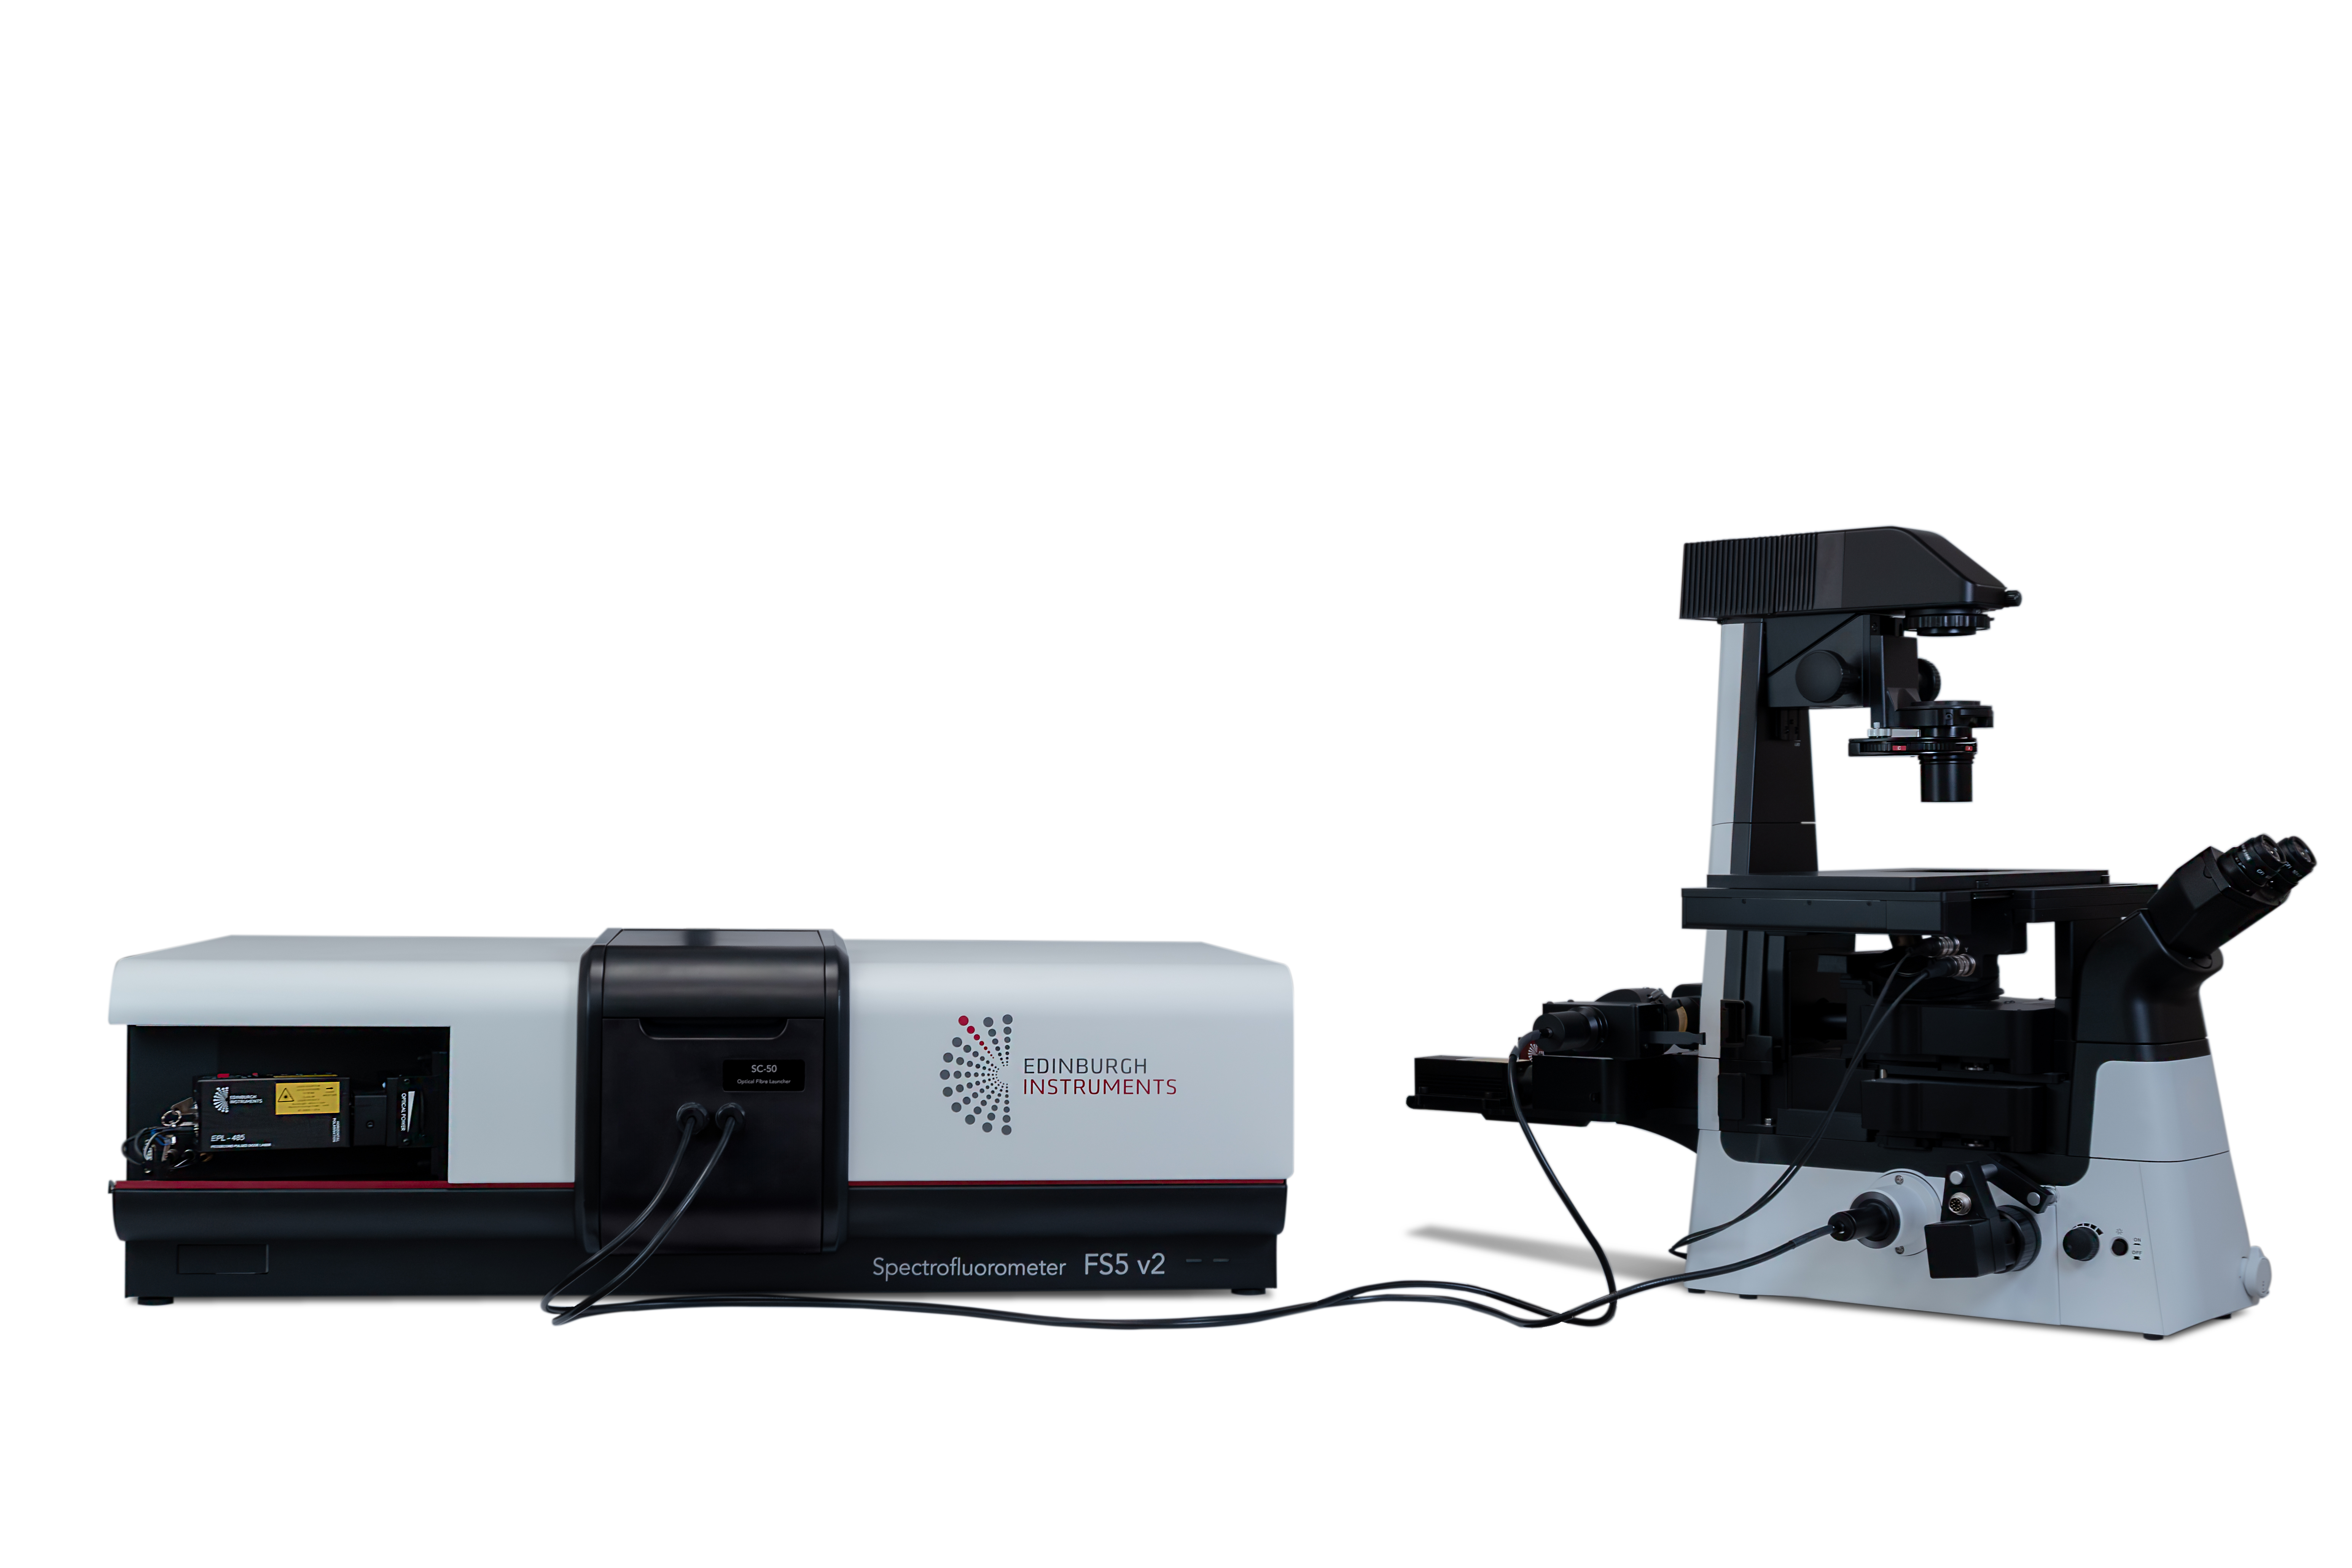
The MicroPL upgrade allows spectral and time-resolved photoluminescence measurements of samples in the microscopic scale. The FS5 is upgraded with a microscope so you can finely tune both the excitation light (illumination) and the detected emission, using widefield or point excitation.
The microscope can be supplied as either an upright or inverted microscope. Imaging cameras are available spanning the spectrum from the visible to the near-infrared, up to 1700 nm. Excitation can be provided by halogen lamps (widefield excitation), picosecond pulsed diode lasers (EPL Series, HPL Series) and pulsed LEDs (EPLED Series), supercontinuum sources and Nd:YAG lasers (lasers provide point source illumination). Steady state emission spectra and fluorescence lifetime measurements can be obtained from specific spots on your sample, when using appropriate lasers. Lasers can achieve a spot size of ~2 μm (objective dependent).
The optional FLIM add-on includes a computer-controlled XYZ stage and unlocks special features in the Fluoracle software including advanced analysis options for maps, such as multi-component decay fitting algorithms.
Download the MicroPL Datasheet datasheet for full details.