


Relative Quantum Yield of 2-Aminopyridine
Quantum yield is a fundamental photophysical parameter that describes a sample’s fluorescence efficiency and is defined as the ratio of the number of photons emitted to the number of photons absorbed by a sample. Accurate and reliable quantum yield measurements are important for a broad range of applications including displays, solar cells, bioimaging and drug development.
There are two optical methods for measuring the quantum yield: the absolute method and the relative method. In the absolute method, the quantum yield is measured directly using an integrating sphere, while in the relative method the fluorescence intensity of the unknown sample is compared with the fluorescence intensity of a standard sample to calculate the quantum yield of the unknown.
In this application note, an Edinburgh Instruments FS5 Spectrofluorometer (Figure 1) is used to measure the quantum yield of 2-Aminopyridine (2AMP) via the relative method. 2AMP in sulfuric acid (H2SO4) has been previously used as a quantum yield reference standard in the UV-visible range. The quantum yield of 2AMP was measured to be 60% in 19681 and 66% in 1983.2 These literature quantum yield reference values are now decades old, and here we present a reinvestigation and revaluation of the quantum yield of 2AMP in 1M H2SO4 using quinine bisulphate (QBS) in 1M H2SO4 as the reference standard with a modern spectrofluorometer.
Figure 1: Edinburgh Instruments FS5 Spectrofluorometer.
Methodology
The relative quantum yield of 2 Aminopyridine can be calculated through the following formula,3
Eq.1
where the subscripts S and R denote sample of interest (2AMP) and reference standard (QBS), respectively. Φ is the quantum yield, I is the integrated fluorescence intensity, and A is the absorbance at the excitation wavelength. n is the refractive index of the solvents used for sample and reference solutions at the mean emission wavelength. In this application note, the same solvent (1 M H2SO4) was used for both 2AMP and QBS and this term cancels.
To increase the accuracy and precision of the calculated quantum yield value, it is best practice to prepare and measure several solutions of the sample and reference with different concentrations. By plotting I versus 1-10-A for 2AMP and QBS, the gradients (GradS and GradR) can be used to calculate the quantum yield (Eq.2). This approach prevents potential systematic errors, such as dye aggregation, which would appear as a deviation from the straight line at higher concentrations.
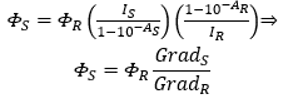
Eq.2
Five solutions of 2AMP in 1M H2SO4 and five solutions of QBS in 1M H2SO4 at different concentrations were prepared. Absorption and fluorescence spectra were measured using an FS5 Spectrofluorometer equipped with a 150 W Xenon lamp, a PMT-980 detector and a SC‑05 cuvette holder.
Absorption & Emission Spectra of 2-Aminopyridine & QBS
Firstly, the absorbance values of the five 2AMP and QBS solutions were determined by measuring the absorption spectra using the FS5’s built-in transmission detector. The absorbance values of the solutions were kept below 0.1 at the excitation wavelength (310 nm) to minimise the probability of inner filter effects and ranged between 0.008 and 0.098. The normalised absorption spectra of 2AMP and QBS are shown in Figure 2a.
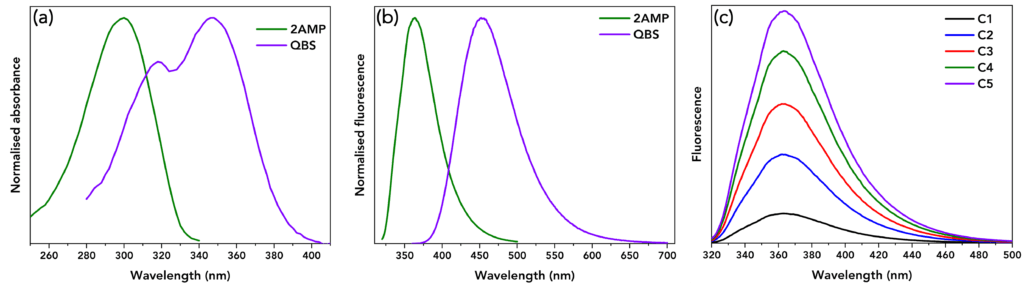
Figure 2: (a) Normalised absorbance spectra of 2AMP (green) and QBS (violet). (b) Normalised fluorescence spectra of 2AMP (green) and QBS (violet). (c) Fluorescence spectra of 2AMP of different concentrations. The C1 solution is the least concentrated (absorbance at 310 nm=0.01), and C5 is the most concentrated (absorbance at 310 nm=0.098). All spectra were acquired on an Edinburgh Instruments FS5 Spectrofluorometer.
Next, the fluorescence spectra of five 2AMP and QBS solutions were acquired. The intensity of the fluorescence detected by a spectrofluorometer is dependent on the excitation wavelength, excitation and emission bandwidths, and integration time. By keeping these parameters identical the integrated fluorescence intensities, IS and IR, of 2AMP and QBS can be meaningfully compared. The experimental parameters were λex=310 nm with excitation and emission bandwidths set at 3 nm and 0.5 nm, respectively, 1 nm step size, and 0.5 s integration time. Figure 2b shows the normalised fluorescence spectra of 2AMP and QBS.
Using Fluoracle Trend Analysis to Determine Quantum Yield
The fluorescence spectra for each concentration of 2AMP were combined into a single plot in Fluoracle (Figure 2c). The gradient GradS in Eq.2 can be calculated from the 2AMP spectra in Figure 2c using the Fluoracle Trend Analysis feature which is shown in Figure 3.
To calculate GradS the Calibration parameter was set to Area (orange frame) and (optionally) the Variable name was set as 1‑10‑A (green frame). The areas (integrated fluorescence intensity) are calculated by pressing Apply. The absorbance term (1-10-A) values for each concentration of 2AMP that were obtained from the absorption spectra were then input (light blue frame).
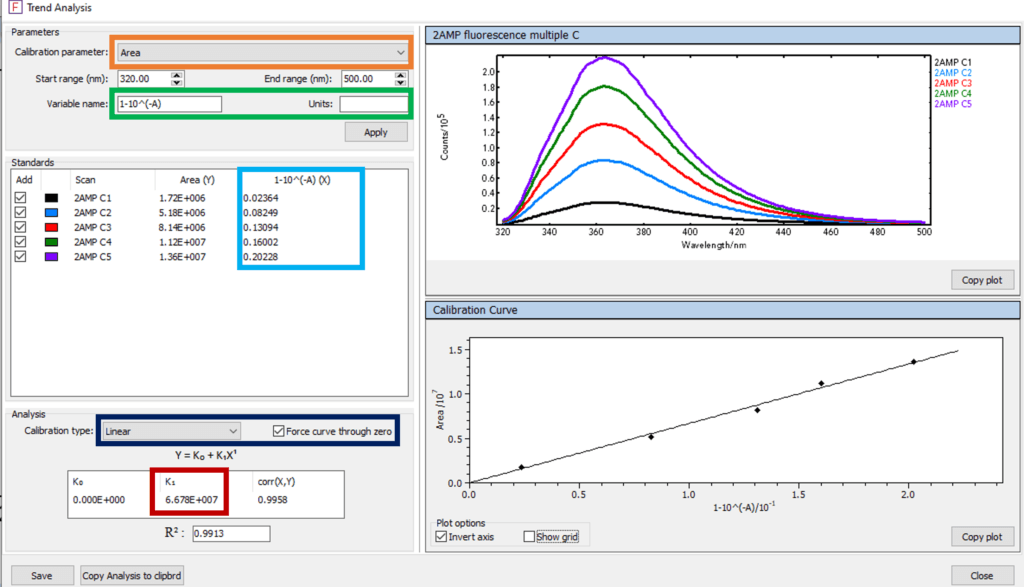
Figure 3: Figure 2c’s Trend Analysis in Fluoracle.
The Calibration type was set to Linear and the Force curve through zero box ticked (dark blue frame). The integrated fluorescence intensity versus absorbance term is plotted on the lower right side of the screen, along with the linear fit. The gradient of the curve (GradS) is given as K1 (red frame). The same process was then repeated for the five QBS spectra to calculate the gradient GradR. Both curves and their calculated gradients are shown in Figure 4.
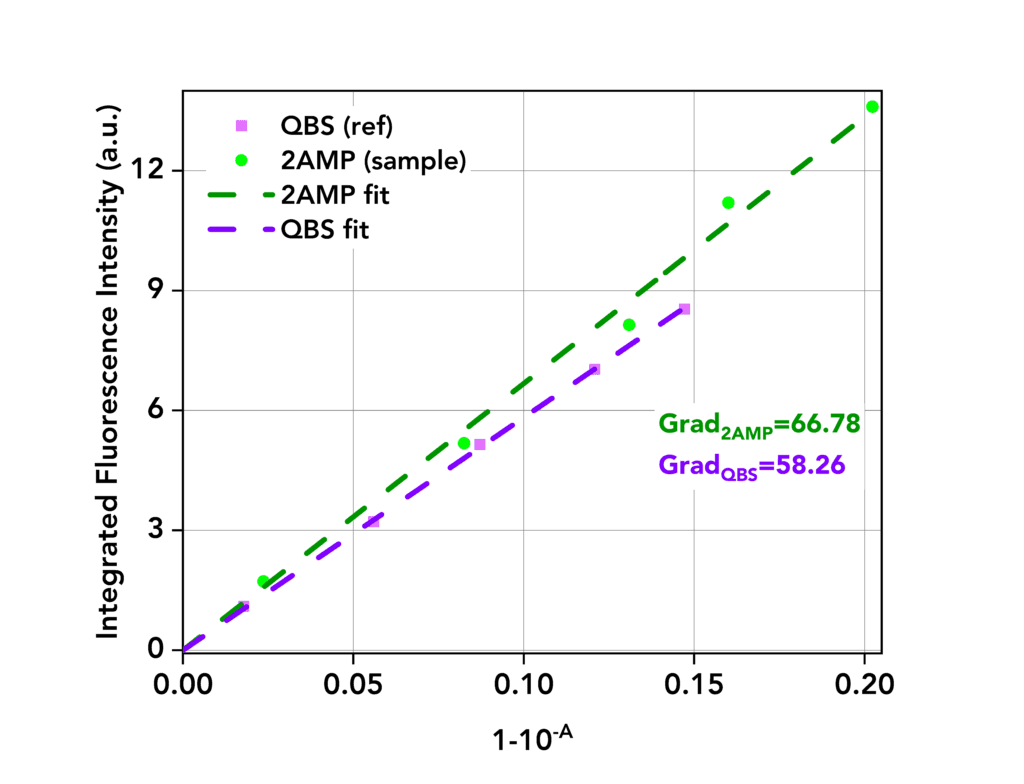
Figure 4: Integrated fluorescence intensity versus absorbance term of 2AMP and QBS.
The literature value of the quantum yield of QBS in H2SO4 is ΦR=56.1%.4 The quantum yield of 2AMP in H2SO4 was then calculated using Eq.2 to be 64.3%, a value which closely agrees with previous values reported of 60% and 66%.1,2
Conclusion
An Edinburgh Instruments FS5 Spectrofluorometer was used for the determination of the quantum yield of 2-Aminopyridine in 1M H2SO4 via the relative method. The data analysis was made simple by the Trend Analysis feature of FS5 Fluoracle software. The quantum yield of 2-Aminopyridine, using Quinine Bisulphate as the reference standard, was calculated to be 64.3%. This value closely agrees with previous reports in the literature and demonstrates that the FS5 can undertake accurate and reliable relative quantum yield measurements.
References
- R. Rusakowicz, A. C. Testa, 2-Aminopyridine as a standard for low-wavelength spectrofluorimetry. J. Phys. Chem. 72, 2680–2681 (1968).
- S. R. Meech, D. Phillips, Photophysics of some common fluorescence standards. J. Photochem. 23, 193–217 (1983).
- K. L. Wong, J. C. Bünzli, P. A. Tanner, Quantum yield and brightness. J. Lumin. 224, 117256 (2020).
- B. Gelernt, A. Findeisen, A. Stein, J. A. Poole, Absolute measurement of the quantum yield of quinine bisulphate. J. Chem. Soc. Faraday Trans. 2 Mol. Chem. Phys. 70, 939–940 (1974).
Keep in Touch
If you have enjoyed this application note and would like to be the first to know about our future research articles, please take a moment to join us on social media – LinkedIn, Twitter, Facebook – and sign up to our infrequent eNewsletter via the link below.
