


Raman Spectroscopy as a Tool for Studying Polymer Phase Transitions
Introduction
Semicrystalline polymers, such as polyethylene, are the largest group of commercially produced plastics. Heating and cooling between phase transitions is used in industry for shaping these polymers into their final product. A phase transition occurs when a substance changes into a different state e.g. from a solid to a liquid.
Polymers can be classified as either amorphous or crystalline. Crystalline polymers are highly ordered which provides strength and rigidity, in amorphous polymers the molecules are randomly ordered and this allows for flexibility and elasticity. Two transitions that polymers can go through, studied in this application note, are the melting transition and the glass transition. The melting transition refers to changing from solid to liquid, and is only seen in crystalline polymers. The glass transition occurs in amorphous polymers and is gradual and reversable. An amorphous sample would change from a hard “glassy” state to a rubbery or viscous state. Polymers are generally a mix of the two, termed semicrystalline, and these can have both a glass and melting transition.
Raman spectroscopy can be used to determine the glass transition temperature, melting transition temperature, and estimation of crystallinity.¹ Peak intensities prove useful in identifying changes in the samples molecular organisation and therefore the temperature of transition such as the glass transition. In this application note we investigated the phase transitions occurring in polyethylene and nylon-6 using the RMS1000 Raman Microscope and a temperature stage.
Materials & Methods
Polyethylene and nylon-6 powders were purchased from Sigma Aldrich and loaded into a quartz cuvette. The powders were analysed using an RMS1000 Raman Microscope equipped with a 785 nm laser and a Linkam HFS600 temperature stage. This temperature stage allows measurements from -195°C to 600°C.
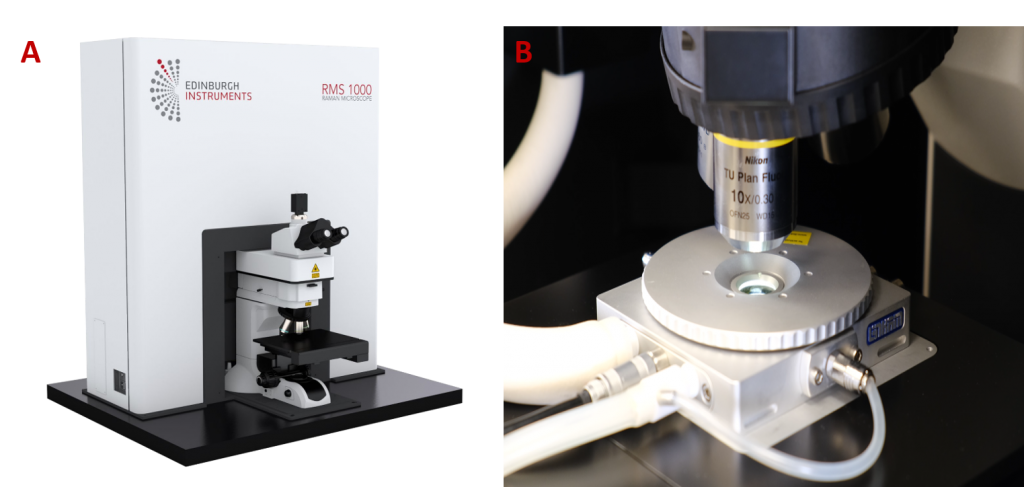
Figure 1. A) RMS1000 Raman Microscope B) Temperature Stage.
Results & Discussion
Polyethylene
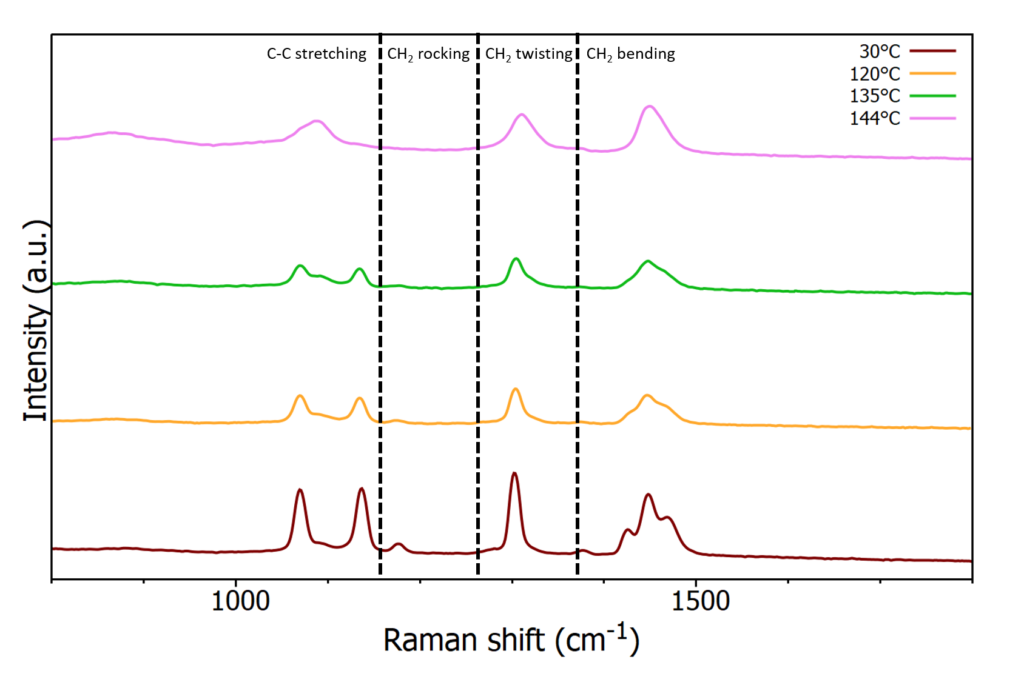
Figure 2. Raman spectra of polyethylene at increasing temperatures
Figure 2 shows the Raman spectra for polyethylene at four different temperatures. The crystalline phase, shown here at 30°C, has characteristic narrow Raman bands. This is due to the strict organisation of the polymer in this state with trans-rich conformation. As the polymer heated it moves into the amorphous state and the polymer becomes more disorganised with gauche-rich conformation, meaning the Raman bands become broader. It can clearly be seen from these Raman spectra that by 144°C the polyethylene sample has gone through the melting transition and is in the amorphous phase.
Nylon-6
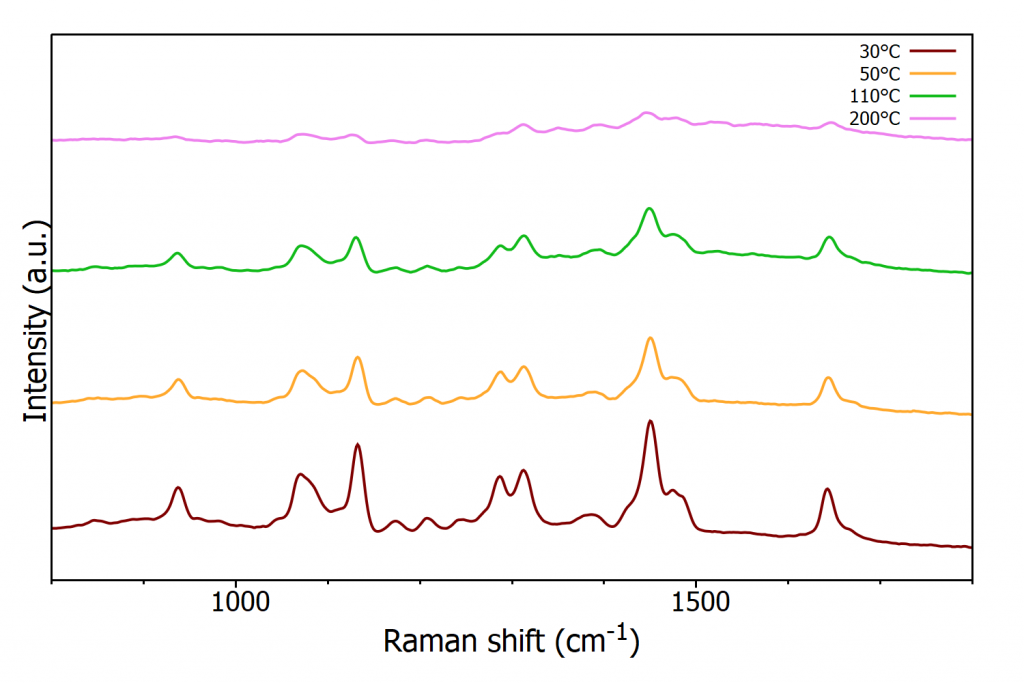
Figure 3. Raman spectra of nylon-6 at increasing temperatures
Nylon-6 was heated to gain spectral measurements for both the glass transition and subsequent melting. From the spectra, Figure 3, a decrease in Raman intensity of key peaks is seen as we increase the temperature to melting point. The changes in peak intensity during heating can be used to determine the phase transition temperature. Figure 4 shows the intensity of the 1450 cm-1 Raman band against increasing temperature and the glass transition can clearly be seen by the sudden drop followed by steep increase in intensity at 50°C.
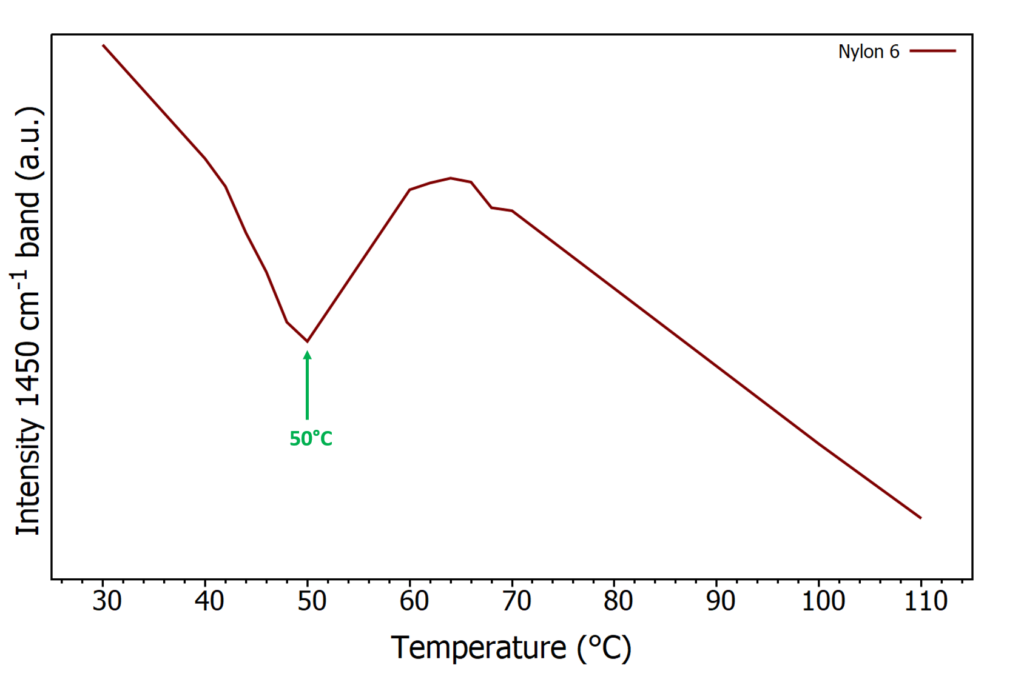
Figure 4. Intensity of 1450 cm-1 band at increasing temperature for nylon-6, arrow indicates glass transition temperature.
Conclusion
Raman spectroscopy is a great method to study phase transitions in polymers and to determine the temperature at which such transitions begin. This information is critical for ensuring their efficient use in industry. In this case the RMS1000 Raman Microscope with a temperature stage reveals the spectral changes when the polymer transitions from the crystalline state into the amorphous state, for both melting and glass transitions.
References
1. Jin, Y. et al. Raman Identification of Multiple Melting Peaks of Polyethylene. Macromolecules (2017)
RMS1000 Raman Microscope
Find out more about the RMS1000 Raman Microscope. If your work involves polymer phase transition and you would like to talk to one of our sales team to find out how the RMS1000 can be used within your own Raman research, please contact us. We’d be delighted to help.
