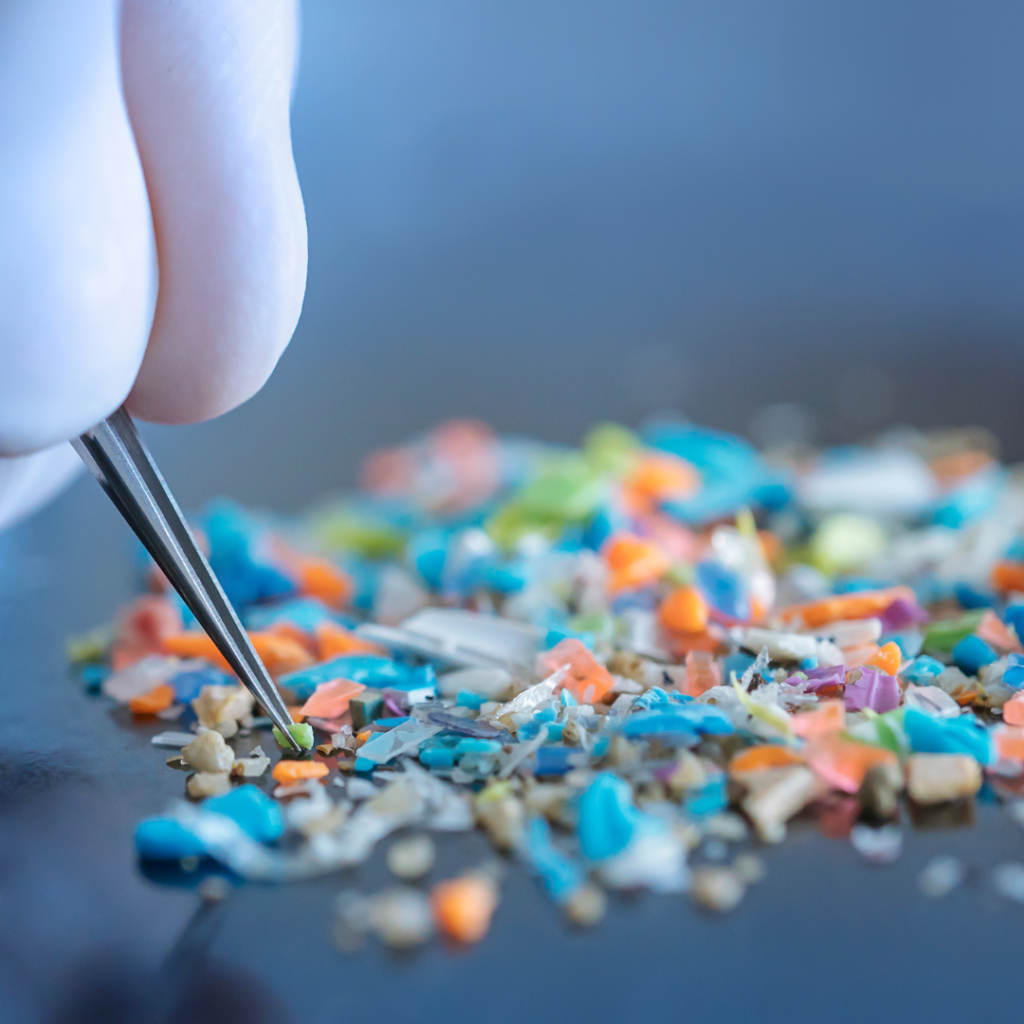
“Microplastics have invaded virtually every crevice on Earth” – a recent headline from a National Geographic article that highlights the global issue of the volume of microplastics in our environment. 1
Microplastics are defined as small solid particles of less than 5 mm composed of polymers. Additionally, they may also contain additives, such as dyes, and impurities from manufacturing. They are either described as primary microplastics which are plastics intentionally made small (e.g. microbeads), or secondary microplastics which are discarded plastic waste which has been broken down in marine environments and by the sun.
Microplastics are found everywhere in the environment including oceans, fish, salt, air, rivers, bottled water, and tap water. They accumulate in water and are eaten by animals such a fish and shellfish. These microplastics are then subsequently found in food and water for human consumption. There is a lot of debate and research around how dangerous microplastics are to the human body and so far, the results are inconclusive.
The World Health Organisation (WHO) last year called for more research into microplastics stating that currently, microplastics in drinking water don’t appear to pose a risk to public health.2 However, this is mainly due to the limited information available and there is no conclusive evidence that microplastics do not pose a risk to human health.
Raman spectroscopy is an extremely sensitive technique and gives rapid results, ideal for distinguishing polymers, contaminants, and dyes. Its fingerprint type analysis offers great potential as a tool in identifying microplastics in marine environments. Commonly employed techniques for studying microplastics are often limited to particle sizes above 300 µm. However, only particles smaller than 150 µm can be absorbed into the human gut and therefore this size range could be of vital importance.3 The high spatial resolution offered by confocal Raman spectroscopy means even the smallest of microplastics can be interrogated.
This application note will investigate 3 polymers, polyethylene (PE), polytetrafluoroethylene (PTFE), and nylon-6, using the Edinburgh Instruments RM5 Raman Microscope. PE is one of the most manufactured polymers, with tens of millions of tonnes made globally each year, much of this being used in packaging. PE is one of the top three most commonly found plastics in global aquatic systems. PTFE is a fluoropolymer used frequently for its non-stick properties, for example in frying pans. PTFE shares a very similar structure to PE however their synthesis and uses differ significantly. There have been several cases recently where perfluorooctanoic acid (one of the synthesis materials for PTFE) has been found in drinking water in the USA and Australia, this acid is a carcinogen. Nylon-6 is a polyamide which frequently finds use in the automotive industry and in fishing materials. Discarded fishing equipment provides an instant route for nylon-6 to enter the aquatic ecosystem. These 3 polymers were chosen for their abundance in the Earth’s oceans.
An RM5 Raman Microscope equipped with a 785 nm laser and a X10 objective was used for the identification of microplastics. Three polymers of known particle size were purchased from Sigma Aldrich; nylon-6, PTFE, and PE. Their particle size being in the range of 35-50 µm. The polymers were added to water and filtered through a Whatman® ME membrane filter.

Figure 1. RM5 Raman Microscope.
Raman spectra of polymers and filter
As a reference, the Raman spectra of bulk nylon-6, PE and PTFE polymers were first measured to identify their characteristic peaks, Figure 2.
 Figure 2. Raman spectra of nylon-6, PE, and PTFE
 Figure 3. Filter spectrum
Raman spectra of unknown water sample
An unknown microplastic water sample was simulated by adding 1 mg of each plastic to 500 mL of water. This sample was filtered and left to dry. The filter was then investigated under the Raman microscope, in total 25 particles were selected to have their Raman spectra measured. The spectra contained both peaks attributed to the polymer and the filter. Figures 4-6 detail an example of three particles Raman spectra and their white light image (particle 8, particle 20, and particle 25), which were identified as PE, nylon-6, and PTFE respectively.
 Figure 4. Spectra and white light image from particle 8
 Figure 5. Spectra and white light image from particle 20
 Figure 6. Spectra and white light image from particle 25
The KnowItAll® Raman spectral library was then used for the identification of the plastic particles, KnowItAll® ID Expert comes with all Edinburgh Instruments Raman spectrometers.4 KnowItAll® Raman spectral library is a database containing over 25000 Raman spectra. The KnowItAll® technology applies a best fit comparison of the measured spectra with those in its library. It carries out a series of optimised corrections to provide the best possible match against its database.
After uploading the spectra of all 25 particles into KnowItAll® the database search provides the most likely match, and gives a score out of 100 with 100 being a perfect match. For example, particle 8 was identified as PE with an 89.96% match. For this particle, PE was identified individually with no likely other contributors. However, some of the particles could not be uniquely identified, this was due to the spectral influence from the filter. For particle 6 KnowItAll® identified the spectrum as a combination of 2 Raman spectra; nitrocellulose and PTFE. It weighted the contribution from PTFE at 0.56 and nitrocellulose at 0.44. Overall, the match for the particle spectrum being this combination was 92.83%. The 25 spectra were identified either individually or in a mixed result with nitrocellulose by KnowItAll®, detailed in Table 1.
Table 1. Results from KnowItAll for all 25 particles
As we learn more about the spread of microplastics throughout the planet and their potential dangers there is an increasing need for accurate and rapid identification for the smallest of particles discovered. Raman spectroscopy can clearly distinguish different polymers at very small particle sizes easily. This application note demonstrates how the RM5 Raman Microscope combined with the KnowItAll database can be used to identify three types of microplastics commonly found in marine environments.
2. World Health Organization. Microplastics in drinking-water. (2019)
4. KnowItAll ID Expert. https://sciencesolutions.wiley.com/knowitall-spectroscopy-software/