


Raman Microscopy for the Characterisation of Antihistamine Formulations
Introduction
Raman microscopy is a powerful and non-destructive analytical tool for the identification and characterisation of pharmaceuticals. Antihistamines are commonly used medications to alleviate allergic symptoms, and their efficacy is directly linked to the presence and purity of the active pharmaceutical ingredient (API). Accurate identification of the API is critical to ensure the safety and efficacy of antihistamine formulations. Raman microscopy offers a unique advantage in providing detailed chemical information, and insights into the spatial distribution and composition of antihistamine tablets without altering the samples. This application note highlights the benefits of Raman microscopy in pharmaceutical analysis and the role it can perform in assuring the quality and reliability of antihistamine medications.
Materials & Methods
The antihistamine tablets analysed were Tesco Health®, Piriteze® and Allevia®. Each tablet was ground in a mortar and pestle to ensure both surface and bulk compounds of the tablet were analysed. The ground tablets were placed on a glass microscope slide and flattened to create a flat surface, Figure 1.
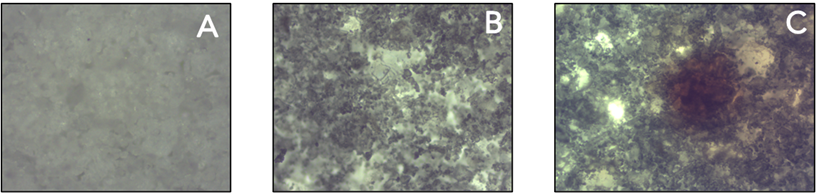
Figure 1: Brightfield images of the ground tablets; Tesco Health®(A), Piriteze®(B) and Allevia®(C).
Using an Edinburgh Instruments RM5 Raman Microscope, Figure 2, the chemical composition of components within three antihistamine tablets was investigated. Raman maps with a spatial resolution of 10 μm were acquired using a 40x objective and a 785 nm laser for excitation.
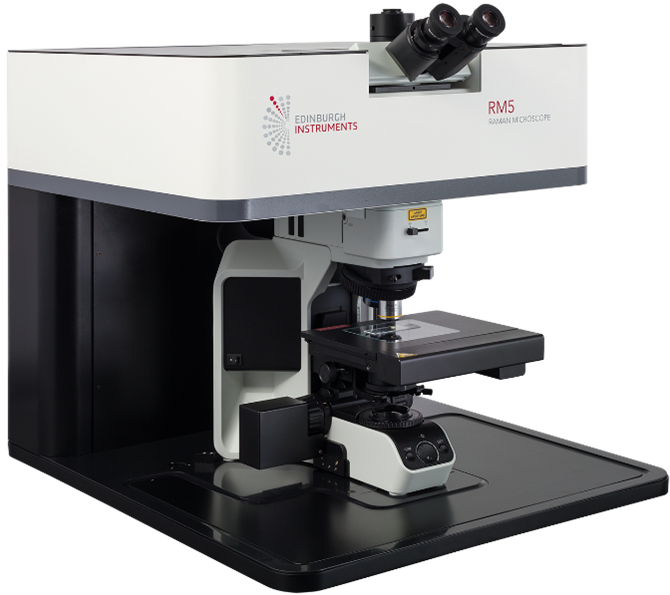
Figure 2: Edinburgh Instruments RM5 Raman Microscope
Raman Mapping of Pharmaceutical Tablets
Tesco Health®
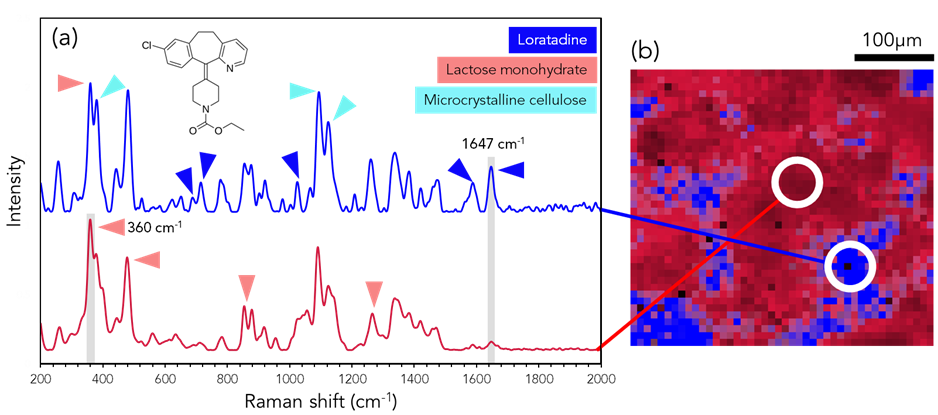
Figure 3: (a) Raman spectral analysis and (b) imaging of Tesco Health® sample. The image shows the intensities of 360 cm-1 (red) and 1647 cm-1 (blue) Raman bands. Triangles indicate the most intense bands in each pharmaceutical ingredient.
The chemical distribution of the Tesco Health® tablet is shown in Figure 3. From the peaks at 380 cm-1, 441 cm-1 and 1097 cm-1 due to O-H rocking, O-H bending, and C-H wagging respectively; the presence of microcrystalline cellulose can be identified.1 The 360 cm-1 band, signifying CCO bending, was utilized to map lactose monohydrate distribution, with additional confirmation provided by bands at 478 cm-1 and 856 cm-1.2 Lactose monohydrate acts as a binder for the API and holds the capsule together when ingested.3 The distribution of the Tesco Health® API, specifically loratadine, was determined using distinctive bands at 1586 cm-1, 1063 cm-1, 715 cm-1, and 691 cm-1. The 1647 cm-1 mode, associated with C=N stretching, served as the basis for Raman mapping.
Piriteze®
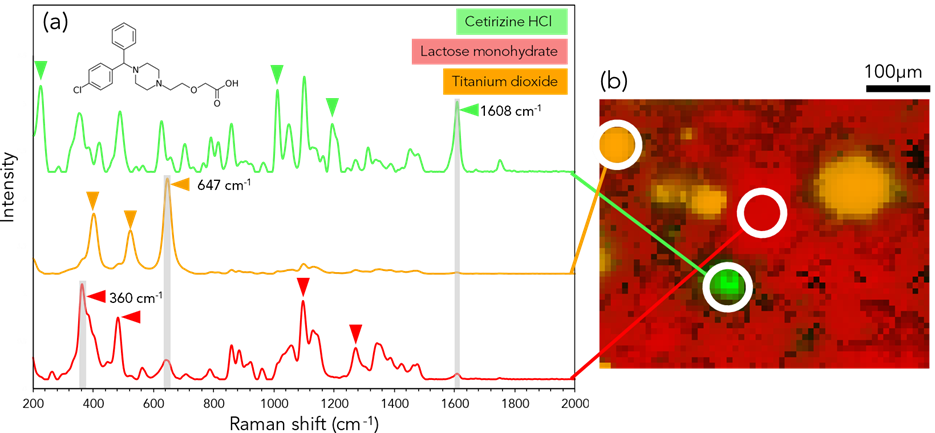
Figure 4: (a) Raman spectral analysis and (b) imaging of Piriteze® with intensities of 647 cm-1 (orange), 1608 cm-1 (green) and 360 cm-1 (red). Triangles indicate the most intense bands in each pharmaceutical ingredient.
Figure 4 shows the chemical distribution from the Piriteze® tablet. Titanium dioxide (orange) was present based on the bands 400 cm-1, 523 cm-1 and the 647cm-1 (anti-symmetric bending vibration of O-Ti-O) was used for an intensity map.4,5 Lactose monohydrate was mapped based on the 360 cm-1 band, and confirmed with the subsequent modes of 478 cm-1, 1087 cm-1 and 1263 cm-1.6 The API cetirizine hydrochloride (HCl) was confirmed from the peaks at 222 cm-1, 1003 cm-1, 1183 cm-1 and mapped using the 1608 cm-1 band of C-C stretching of a carboxylic acid.7,8
Allevia®
Figure 5 highlights the chemical distribution of a section of crushed Allevia®. Allevia® is coated in a pink-red shell coating.
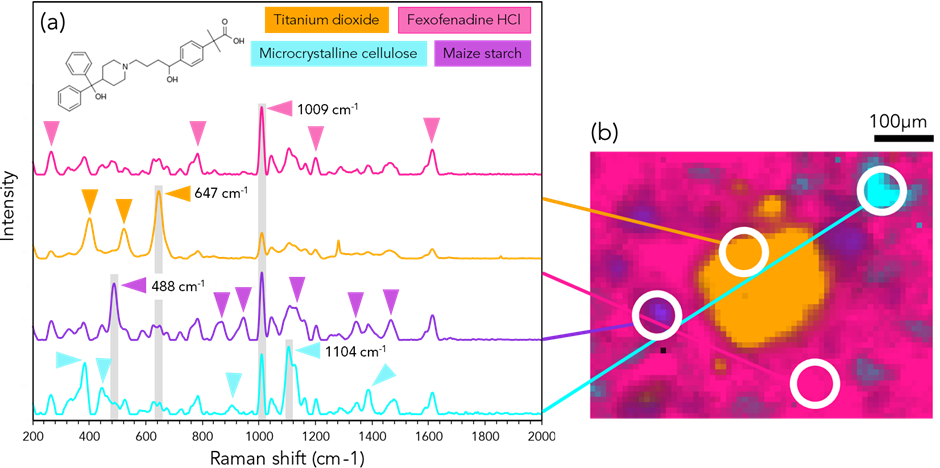
Figure 5: (a) Raman spectral analysis and (b) imaging of Allevia® with intensities of 647 cm-1 (orange), 1009 cm-1 (pink) 1104 cm-1 (cyan) and 488 cm-1 (purple). Triangles indicate the most intense bands in each pharmaceutical ingredient.
The central region, as seen on the white light image, Figure 2C, and has been found to contains the anatase form of titanium dioxide. Titanium dioxide, in this instance, is used as a coating agent which prevents degradation of the API.9 Maize starch was also another ingredient identified. Similar to lactose monohydrate, maize starch is mostly used in pharmaceuticals as a binder to the API when it is granulated, and it also prolongs the steady release of the drug.10 The active ingredient fexofenadine HCl was detected due to the modes at 260 cm-1 (C-C stretching), 782 cm-1, 1614 cm-1 (carboxylic acid group) and mapped using the 1009 cm-1 band.11
Conclusion
In conclusion, the analysis of the tablet’s spectra, in conjunction with the manufacturer’s provided ingredients list, has yielded valuable insights into the composition of the tablet. This investigation has allowed us to confirm the presence of various crucial ingredients, including binders like lactose monohydrate and microcrystalline cellulose, coating agents like titanium dioxide, and active pharmaceutical ingredients such as loratadine, cetirizine HCl, and fexofenadine HCl. The findings are summarized in Figure 6, which highlights the distinctive spectral bands corresponding to each ingredient across different tablets. It is evident that Raman microscopy serves as a powerful tool, providing unique and indispensable insights into the formulation of pharmaceutical products.
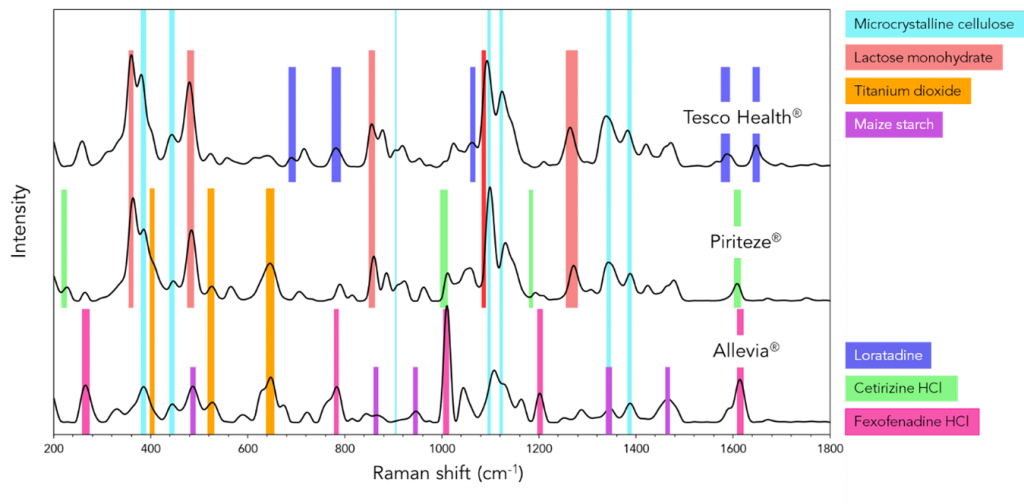
Figure 6: Average spectrum of Raman maps for each antihistamine tablet, Tesco®, Piriteze® and Allevia®; corresponding ingredients and their Raman modes are shown.
References
- Fathy, M. et al. Absorption of calcium ions on oxidized graphene sheets and study its dynamic behavior by kinetic and isothermal models. Appl Nanosci 6, 1105–1117, (2016) Figure 2.
- Hicham M Gafour et al. Harmonic Dynamics of α-D-Lactose in the Crystalline State. Journal of Molecular Imaging & Dynamic, 1:1 (2011).
- Marleen de Veij et al. Reference database of Raman spectra of pharmaceutical excipients, Wiley Interscience (2008) Figure 2.
- ©PublicSpectra. Raman Spectrum of Titanium(IV) oxide (Anatase), CAS Registry Number: 1317-70-0, www.publicspectra.com/Raman/Titanium(IV)%20oxide%20(Anatase), Accessed: 15/09/2023.
- J. Ekoi et al. Characterisation of titanium oxide layers using Raman spectroscopy and optical profilometry: Influence of oxide properties, Results in Physics, Volume 12 (2019), Pages 1574-1585.
- ©PublicSpectra. Raman Spectrum of Lactose Monohydrate, CAS Registry Number: 64044-51-5, www.publicspectra.com/Raman/Lactose%20Monohydrate, Accessed: 15/09/2023.
- Paczkowska M et al. Effects of inclusion of cetirizine hydrochloride in β-cyclodextrin. J Incl Phenom Macrocycl 91(3):149-159. Epub (2018).
- ©PubChem, Cetirizine Hydrochloride (Compound), 4.3 Raman Spectra, Catalog Number: C3618, © 2012-2021 John Wiley & Sons, Inc. Accessed: 15/09/2023.
- Colorcon, ColorCon Insights, TiO2 EU Regulations and Pharmaceuticals: What to Know, Accessed: 15/09/2023.
- Gujarat Ambuja Exports Ltd. Blog, Applications of Maize Starch, 4. Pharmaceutical Industry , Published: July 2020, Accessed: 15/09/2023.
- Missono Brondi et al. Mapping the Polymorphic Forms of Fexofenadine in Pharmaceutical Tablets Using near Infrared Chemical Imaging. Journal of Near Infrared Spectroscopy. 22. 211-220 (2014) Figure 3.
