


Measuring Ethanol Content in Hand Sanitiser Using Raman Spectroscopy
Introduction
Hand sanitiser is a gel like liquid used to kill microorganisms, providing a way to disinfect hands when there is no way for hand washing with soap and water. They’ve seen a boom in demand due to the COVID-19 pandemic, with either ethanol or isopropyl being the active ingredient. Generally, ethanol is slightly more effective than isopropyl, but this depends on the microbe of interest. The Centres for Disease Control and Prevention (CDC) states a disinfecting hand gel should have ethanol content (or isopropyl) of 60-90% to be effective.1 Anything less than this will not successfully kill all microbes present and therefore still leave a risk of infection.
During the height of the pandemic, with hand sanitiser sales soaring, some products were vastly overstating their alcohol content, for example a Which? study found one product for sale stating an alcohol content of 75%, however when tested it only contained 10%.2 This renders the hand sanitiser ineffective at killing microbes, and therefore not offering protection against COVID-19.
Ethanol kills cells by a process called denaturation, the alcohol molecules break down the proteins in the cell membrane. More specifically, the virus which causes COVID-19 (SARS-CoV-2) is an enveloped virus. The viral envelope is the outermost layer of the virus, it protects the genetic material when travelling between host cells. Without the protection of their membrane cells will dehydrate, and quickly die. Figure 1 shows the general structure of an enveloped virus, the lipid envelope and spike proteins are the areas ethanol interacts with and breaks down.

Figure 1: Structure of an enveloped virus.
A simple, quick method for confirming ethanol content in hand sanitisers is needed to ensure their efficacy. In analytical chemistry a calibration (or standard) curve is a method for determining the concentration of unknown samples by comparing the unknown to a series of known standards. Raman spectroscopy can offer quantitative analysis, making it suitable for calibration curves. In the case of ethanol, a known peak is selected at approx. 880 cm-1 attributed to the C-C-O symmetric stretching vibration. The peak area will increase with increasing ethanol concentration and using these data points a calibration curve can be created. This application note details the use of an ethanol calibration curve to check hand sanitiser ethanol concentrations by Raman spectroscopy.
Materials and Methods
An RM5 Raman Microscope equipped with a 785 nm excitation laser and a cuvette holder were used for the analysis. Pure ethanol was purchased from Merck to make the standard solutions for the calibration curve. Hand sanitiser samples were obtained locally. To create the calibration curve aqueous solutions of 20%, 40%, 60%, 80%, and 100% of ethanol were made. Raman spectra were taken of all standard solutions and samples using the same measurement conditions: 100% laser power, 0.5 second exposure time, 300 gr/mm grating, 100 µm slit, 2 mm pinhole.
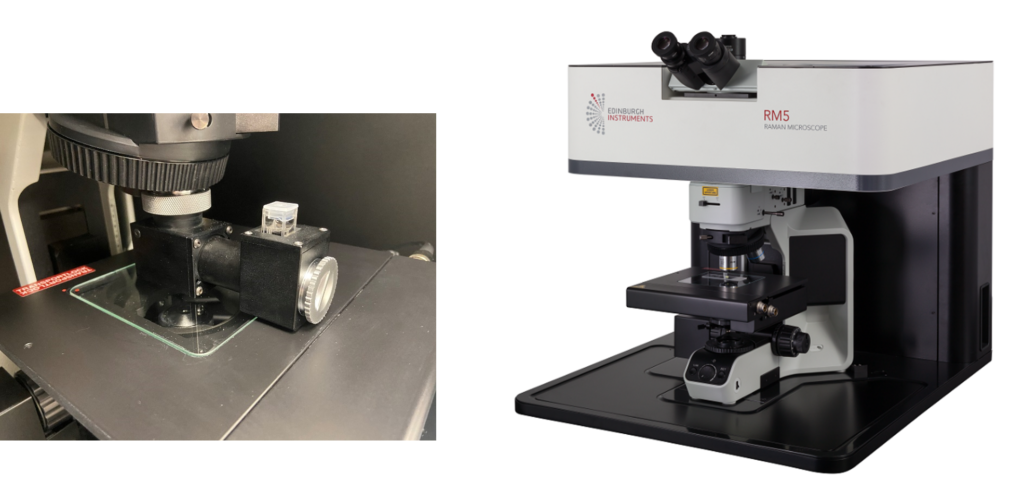
Figure 2: Cuvette holder (left), RM5 Raman Microscope (right).
Creating the Calibration Curve
The calibration curve was created from the 5 standard solutions of known ethanol % using the marker band at approx. 880 cm-1, Figure 3(a). For vol/vol (%) measurements it was found that the increase in peak area with concentration behaves linearly. From these values the calibration curve was plotted, Figure 3(b).
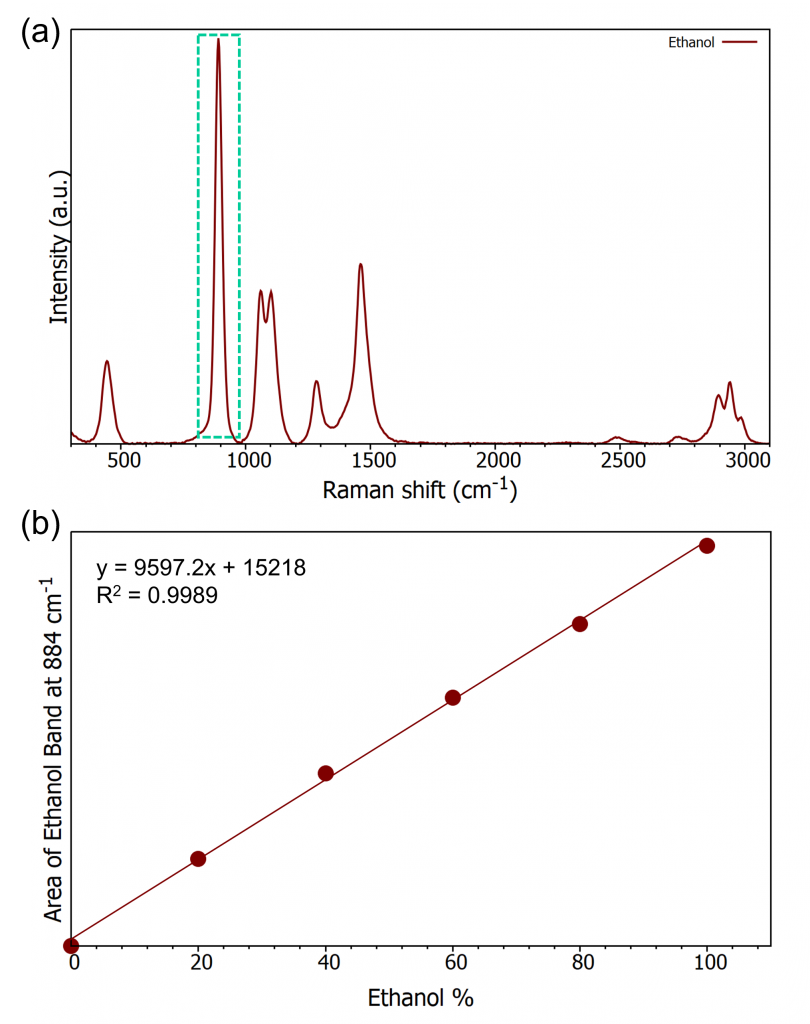
Figure 3: (a) ethanol spectrum highlighting the peak of interest, (b) ethanol calibration curve.
The calibration curve provides the equation of the line which allows an unknown sample’s ethanol content to be determined from the area of the peak at 880 cm-1. Also shown in Figure 3(b) is the R2 value, this is a measurement of how closely the curve matches the data generated, in this case how close to a straight line are the data. A value of 1 is a perfect result, values ≥0.990 are considered a good result and can be used quantitatively.
Ethanol Content Analysis
Four samples of hand sanitiser were analysed. Three were different bottles of the same brand to determine the variance between different bottles (Samples 1-3), and a further sample which proved to have much lower than expected ethanol concentration were analysed. The 3 samples of same of the same brand all show ethanol %’s over the 68% stated on the label with a variance of 3.4% between them. The second brand analysed was determined to have a lower ethanol content of 57.1%, Table 1, which would make it ineffective at killing microbes. The ethanol concentration of the hand sanitiser samples is shown by orange squares in Figure 4.
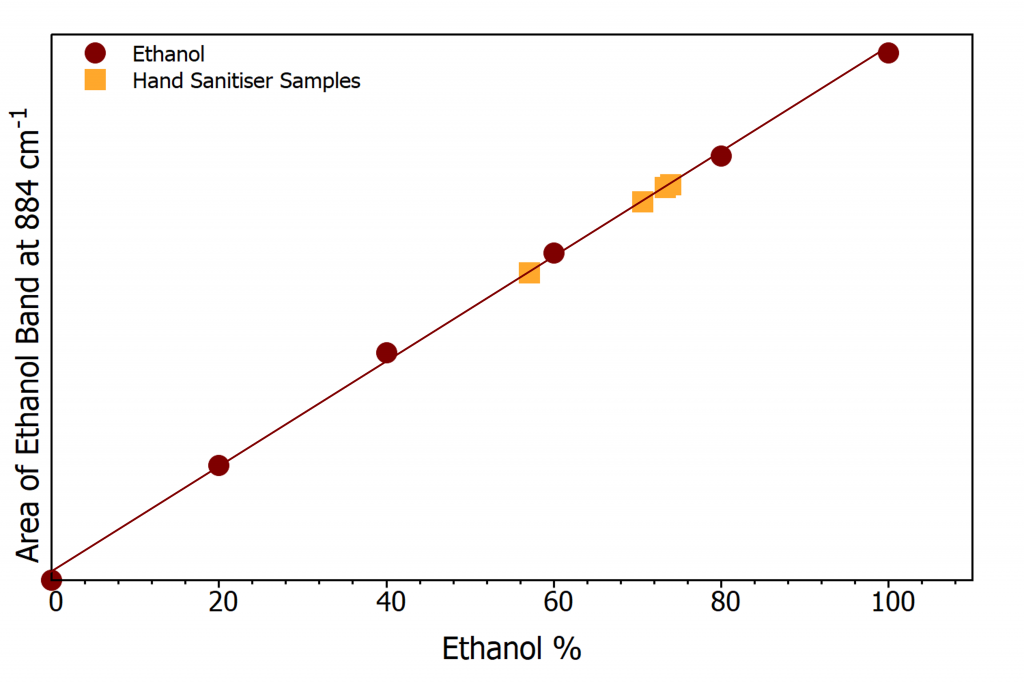
Figure 4: Calibration curve with hand sanitiser samples (orange squares).
Table 1: % Ethanol results Hand Sanitiser Samples.
| Sample | Labelled Ethanol % | Measured Ethanol % |
| 1 | 68% | 70.6% |
| 2 | 68% | 73.3% |
| 3 | 68% | 74.0% |
| 4 | 70% | 57.1% |
Conclusions
This application note demonstrated the ease of using Raman spectroscopy for quantitative analysis. The RM5 was equipped with a cuvette holder for rapid measurements of standard ethanol samples and hand sanitiser samples of unknown ethanol content. The determination of ethanol percent is critical to know products for sale are legitimate, safe, and effective. Raman spectroscopy presents a simple, non-destructive method for such analysis here revealing 3 out of 4 hand sanitisers tested contained >60% ethanol.
References
- Chemical Disinfectants,Guidelines Library, CDC, https://www.cdc.gov/infectioncontrol/guidelines/disinfection/disinfection-methods/chemical.html, (accessed 20 April 2022).
- Hand sanitiser gels sold online fail Which? tests – Which? News, https://www.which.co.uk/news/2020/12/hand-sanitisers-sold-online-fail-which-tests/, (accessed 19 April 2022).
