


API Identification Using FTIR Spectroscopy
Key Points
- Active pharmaceutical ingredients (APIs) can be identified using FTIR spectroscopy by analysing their unique chemical bonds and functional groups.
- Vibrational shifts in key bonds, such as C=O stretching, provide distinctive spectral patterns for each API.
- Accurate API identification is important for all stages in the pharmaceutical process from R&D to quality control.
Introduction to API identification using FTIR
Accurate and rapid identification of the active pharmaceutical ingredient (API) in pharmaceutical development and manufacture is critical. Allergic rhinitis, also known as hay fever, is a widespread condition, affecting 10-15% of children and 26% of adults in the UK1. There are many antihistamine formulations available for treating hay fever and these utilise various active pharmaceutical ingredients.
This application note showcases the remarkable capability of FTIR spectroscopy in swiftly and precisely discerning the API within antihistamine medication. It highlights how FTIR spectroscopy is an indispensable tool for API identification and ensuring quality standards within the pharmaceutical industry.2
Materials and Methods
Three commercially available tablets, Piriteze®, Allevia® and Tesco Health®, were analysed using an Edinburgh Instruments IR5 FTIR spectrometer equipped with a diamond Attenuated Total Reflection (ATR) accessory, Figure 1. 
Figure 1: Edinburgh Instruments IR5 FTIR Spectrometer.
The tablets were ground into a fine powder, which was then placed onto the ATR. FTIR spectra were then collected using Miracle™ software of the IR5, where 30 averages at a resolution of 4 cm-1 were obtained, and the APIs were identified by comparing the spectra with those of known compounds in the KnowItAll® spectral library.
API Identification
Pharmaceutical industries utilise spectral databases to classify, compare and detect ingredients, such as APIs and excipients. Using database spectra, the major compounds in each tablet were identified. Figure 2 shows the spectrum obtained from Allevia®, the API from this brand was successfully identified as fexofenadine hydrochloride.3
The Allevia® spectrum also shows that it contains hypromellose. Hypromellose is an important ingredient in pharmaceutical tablets, providing controlled API release to prolong their therapeutic effects. This is why antihistamines, for example, only need to be taken once per day.
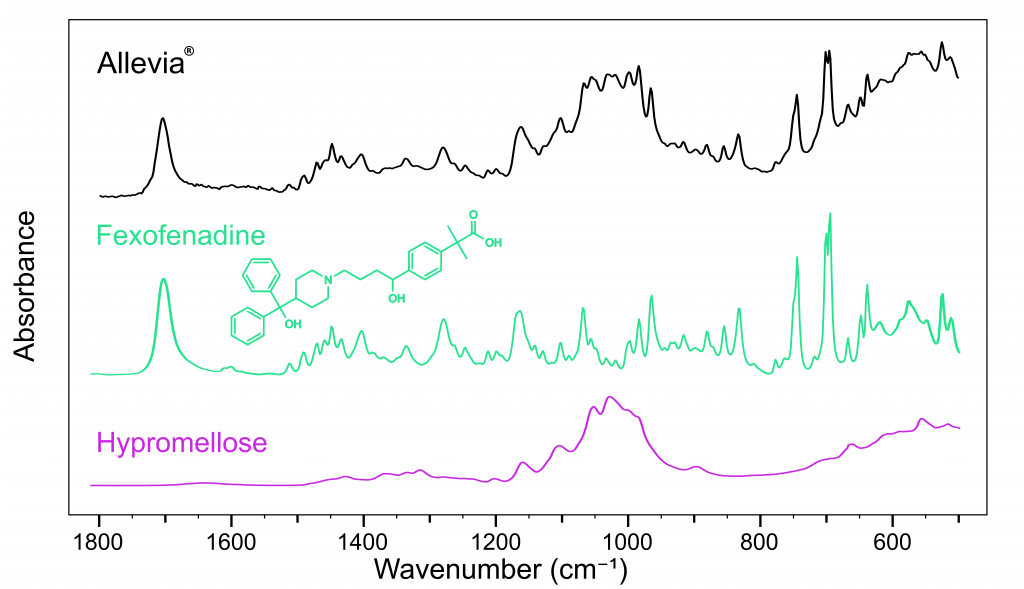
Figure 2: FTIR spectra of Allevia® (black), fexofenadine (green), and hypromellose (pink).
Figure 3 shows the spectrum of Piriteze® and could be used to identify the API as cetirizine dihydrochloride. Piriteze® was also found to contain lactose monohydrate5, a crystallised form of milk-sugar, which has excellent compressibility properties allowing the tablet to be digested smoothly.
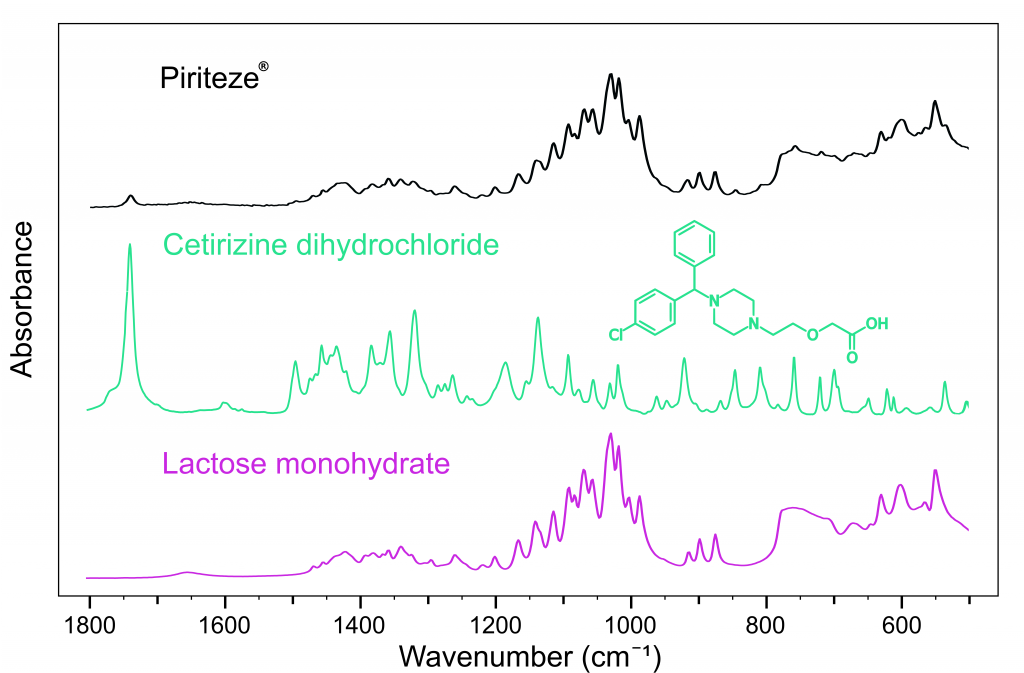
Figure 3: FTIR spectra of Piriteze® (black), cetirizine dihydrochloride (green), and lactose monohydrate (pink).
Figure 4 shows that the API in the Tesco Health® tablet is loratadine. Both loratadine and cetirizine have very high protein binding ratios compared to fexofenadine making them very fast-acting allergy medications.5,6 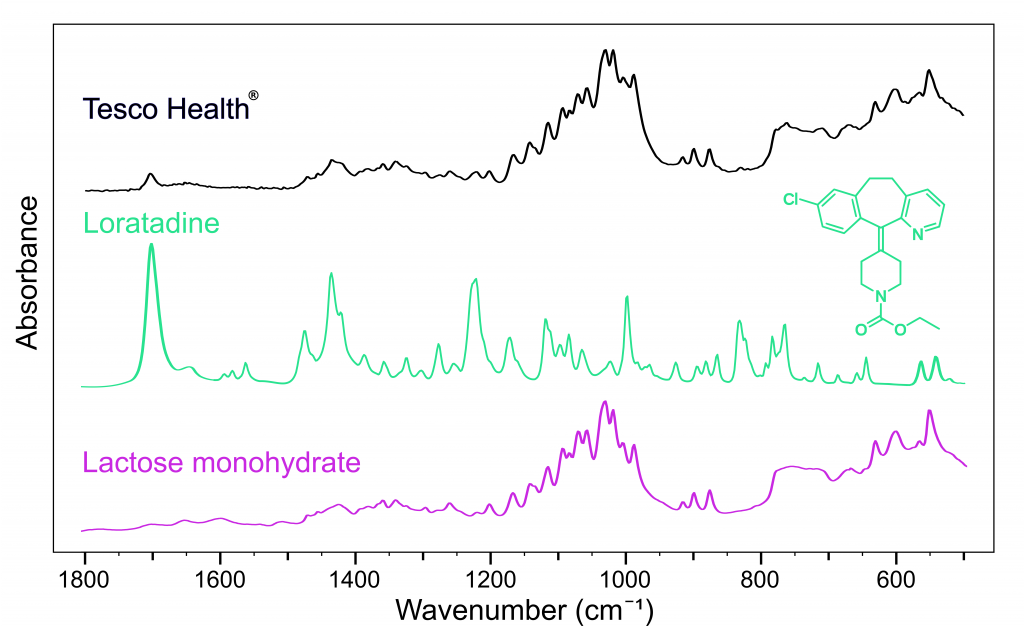
Figure 4: FTIR spectra of Tesco Health Hay fever® (black), loratadine (green), and lactose monohydrate (pink).
The major IR-active vibrations were identified for each API and shown in Table 1. The C=O stretching mode in the 1600-1800 cm-1 region is shifted for each API because the surrounding chemical environment is different in each compound.
Table 1: Table of IR modes of APIs in antihistamines. 3,7,8
| Antihistamine Tablet | API | IR active modes (cm-1) | Stretching Bond |
|---|---|---|---|
| Allevia® | Fexofenadine | 1699 1275 750 995 | C=O C–N C-H C=C |
| Piriteze® | Cetirizine | 1740 1650 1325 780 | C=O C=N C–N C=Cl |
| Tesco Health® | Loratadine | 1703 1650 780 | C=O C=N C–Cl |
Conclusion
API identification using FTIR was shown to be a robust and effective technique for analysing antihistamine tablets. The unique spectral fingerprints obtained through FTIR spectroscopy enable the characterisation of various pharmaceutical components, providing an excellent tool for quality control and manufacturing.
References
- Scadding GK et al. BSACI guideline for the diagnosis and management of allergic and non-allergic rhinitis, 2017. Clin Exp Allergy.
- Gumieniczek A et al. Chemical Stability Study of H1 Antihistaminic Drugs from the First and the Second Generations, Diphenhydramine, Azelastine and Bepotastine, in Pure APIs and in the Presence of Two Excipients, Citric Acid and Polyvinyl Alcohol. Molecules. 2022 29;27(23):8322.
- National Center for Biotechnology Information (2023). PubChem Compound Summary for CID 63002, Fexofenadine hydrochloride, 2023.
- Coblentz Society, Inc., Lactose Monohydrate in NIST Chemistry WebBook, NIST Standard Reference Database Number 69, Eds. P.J. Linstrom and W.G. Mallard, National Institute of Standards and Technology, 2023.
- Chen C, Physicochemical, pharmacological and pharmacokinetic properties of the zwitterionic antihistamines cetirizine and levocetirizine. Current Medicinal Chemistry, 2008, 15 (21): 2173–2191.
- Smith SM et al. Fexofenadine: biochemical, pharmacokinetic and pharmacodynamic properties and its unique role in allergic disorders. Expert Opinion on Drug Metabolism & Toxicology, 2009, 5 (7): 813–822.
- Der Pharmacia et al. Formulation and Evaluation of Cetirizine HCl Mouth Fast Dissolving Tablets, 2011. Figure 2.
- Najla Al-Masoud et al. Chapter Two – Loratadine, Profiles of Drug Substances, Excipients and Related Methodology, Academic Press, Volume 47, 2022, Pages 55-90.
