We recently launched our newest product, the IR5 FTIR Spectrometer, but what is FTIR spectroscopy? This blog post will highlight the basics of FTIR spectroscopy, discussing how it works and what the resulting FTIR spectrum can reveal about your sample.
Infrared (IR) spectroscopy is one of the most used spectroscopic techniques in analytical laboratories for both qualitative and quantitative analysis. It measures the interaction of IR radiation with a sample, to provide chemical identification. The three main areas studied by IR are the near-IR 14000-4000 cm-1, mid-IR 4000-400 cm-1, and the far-IR 400-10 cm-1.
The mid-IR region is of most interest as it contains the characteristic bands for identification and is what is standardly regarded as IR spectroscopy. An IR spectrometer measures the infrared light energy required to initiate molecular vibrations. The functional groups within molecules have unique vibrational energies creating distinctive bands in the resulting IR spectrum that allow sample identification. Solids, liquids, and gasses can be analysed using IR spectroscopy making it a highly versatile technique.
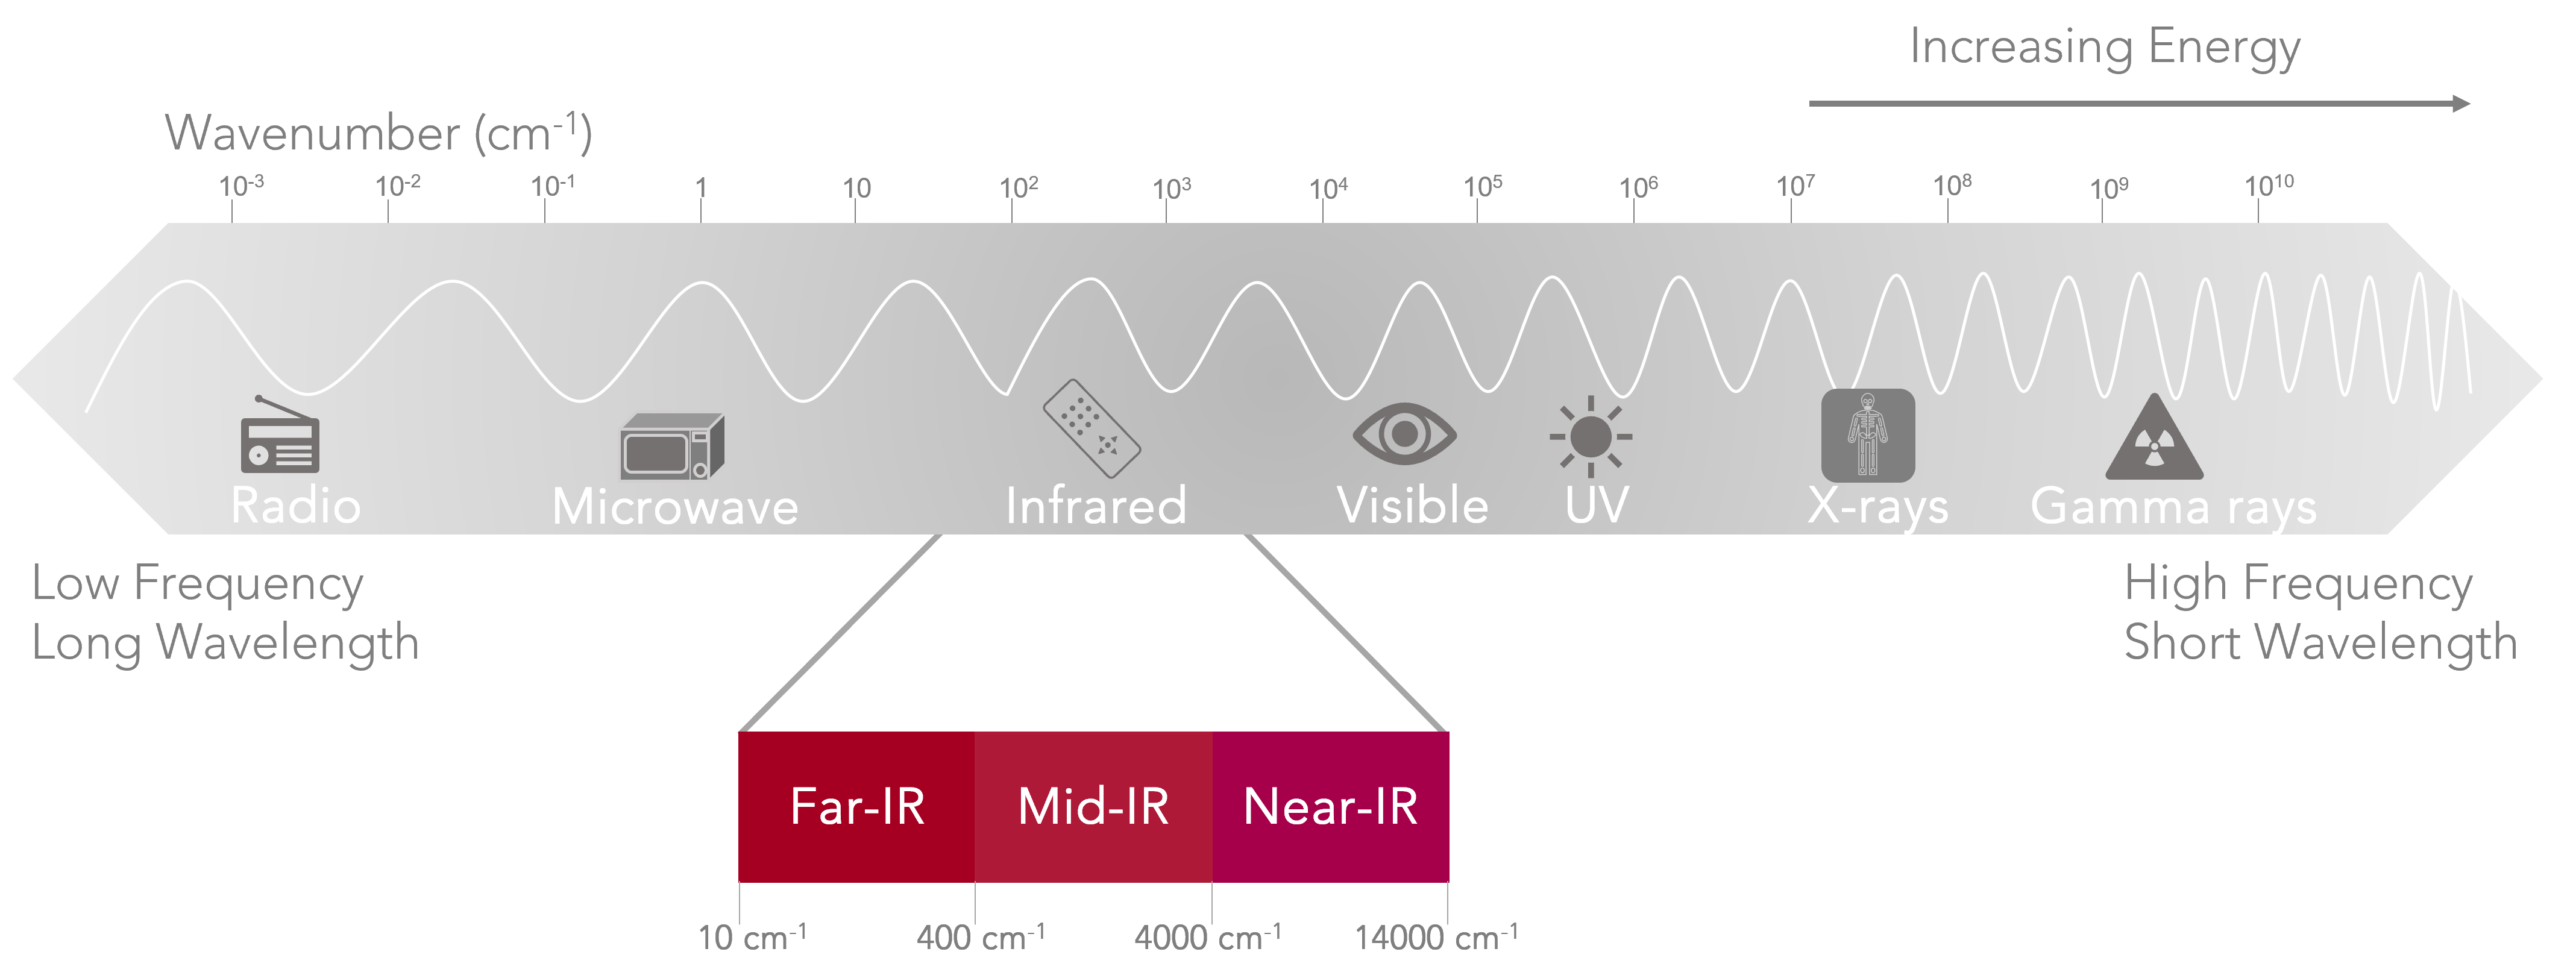
Figure 1: Electromagnetic spectrum highlighting the infrared region.
The first IR spectrometer was built in 1835, and it quickly became a valuable tool for chemical characterisation. It was a dispersive design which means that the IR light is split into its constituent frequencies (wavelengths) and each frequency detected sequentially. The issue with this dispersive design was the long time it took to obtain an entire spectrum due to the sequential detection.1 In the late 1960’s there was a breakthrough for IR spectroscopy with the development of Fourier Transform Infrared (FTIR) spectroscopy, which has now almost exclusively replaced dispersive spectrometers. FTIR spectrometers measure all frequencies simultaneously resulting in significantly faster acquisition times with improved signal to noise ratios and wavenumber accuracy.
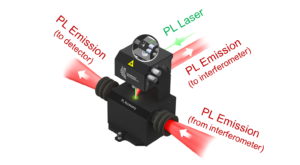
The basis of the FTIR spectrometer is the two beam interferometer originally designed in 1891 by Michelson, Figure 2.2 It works by dividing a beam into two paths using a beamsplitter, one beam is reflected by a fixed mirror and the second by a moving mirror. They recombine at the beamsplitter after a path difference has been introduced creating interference between the beams. Due to the changing travel distance of the second beam, caused by the moving mirror, the resulting IR light has a varying frequency distribution. The signal on the detector is recorded as a time-domain interferogram which then undergoes a Fourier Transform to the frequency domain to give the IR spectrum.3

Figure 2: Interferometer schematic in an FTIR spectrometer.
The selection rule for IR states for a molecule to be IR active it must have a change in dipole moment during the vibration. Two primary modes of vibration in IR are bending (changing bond angle) and stretching (changing bond length). Stretching occurs at higher frequencies than bending as it takes more energy to stretch a bond than to bend it.

Figure 3: IR spectral regions.
Samples typically have many stretching and bending vibrations resulting in a highly specific IR spectrum. The spectrum can be divided into four main sections, Figure 3. The high wavenumber end of the spectrum is where stretching vibrations of single bonds are present, for example the O-H in water will be strongly observed in this region as a broad peak. Between 2500 cm-1 and 2000 cm-1 stretching of triple bonds are observed, such as the C≡N in acetonitrile. The double bond stretching region is observed between 2000 cm-1 and 1500 cm-1, for instance the C=O bond in carboxylic acid will present a band in this region. The final part to consider in a typical IR spectrum is termed the fingerprint region. The fingerprint region is a complex area of the spectrum, containing several stretching and bending bands. Whilst it is the most difficult area of the spectrum to interpret, it also provides the most characteristic information providing a ‘chemical fingerprint’ of the sample.
FTIR spectroscopy offers simple, non-destructive, and reliable sample analysis both qualitatively and quantitatively. The specificity of the IR spectrum produced allows rapid ‘chemical fingerprinting’ of samples with endless applications from industry to academia.
If you have enjoyed this article and would like to hear more about our product news and applications including more about how the IR5 can be used for FTIR Spectroscopy, be sure to subscribe to our newsletter or follow us on social media using the links below.