Rapid and accurate identification of specific bacterial species and strains is crucial for administering the correct treatment and preventing the acceleration of antimicrobial resistance.1 Despite being highly effective and reliable, conventional gold standard techniques, such as polymerase chain reaction and enzyme-linked immunosorbent assay, are resource-intensive and time-consuming. Additionally, they require skilled personnel and often prior knowledge of the bacteria under investigation, limiting their potential for point-of-use applications in a clinical setting.2 An alternative technique that has the potential to offer rapid identification is Raman spectroscopy because of the information-rich data it provides and the ability of the technique to be coupled with multivariate analysis (MVA) and machine learning approaches. In this Application Note, an Edinburgh Instruments RM5 Raman Microscope is combined with the multivariate technique principal component analysis (PCA) to discriminate between bacterial species.3
Bacillus subtilis (B. subtilis), Clostridium sporogenes (C. sporogenes), and Escherichia coli (E. coli) were purchased from NCIMB. Each species was individually cultured on horse blood agar for 24 hours at 37 °C. Biomass from the cultures was collected and washed three times in deionised water to prevent spectral interference from the agar. The resulting slurries were transferred onto calcium fluoride (CaF2) slides and left to dry before being analysed. Raman microscopy was performed on the samples using an RM5 equipped with a 532 nm laser, a 1200 gr/mm diffraction grating, and a back-illuminated CCD camera, Figure 1. Datasets were exported to Eigenvector Solo® software for PCA analysis.
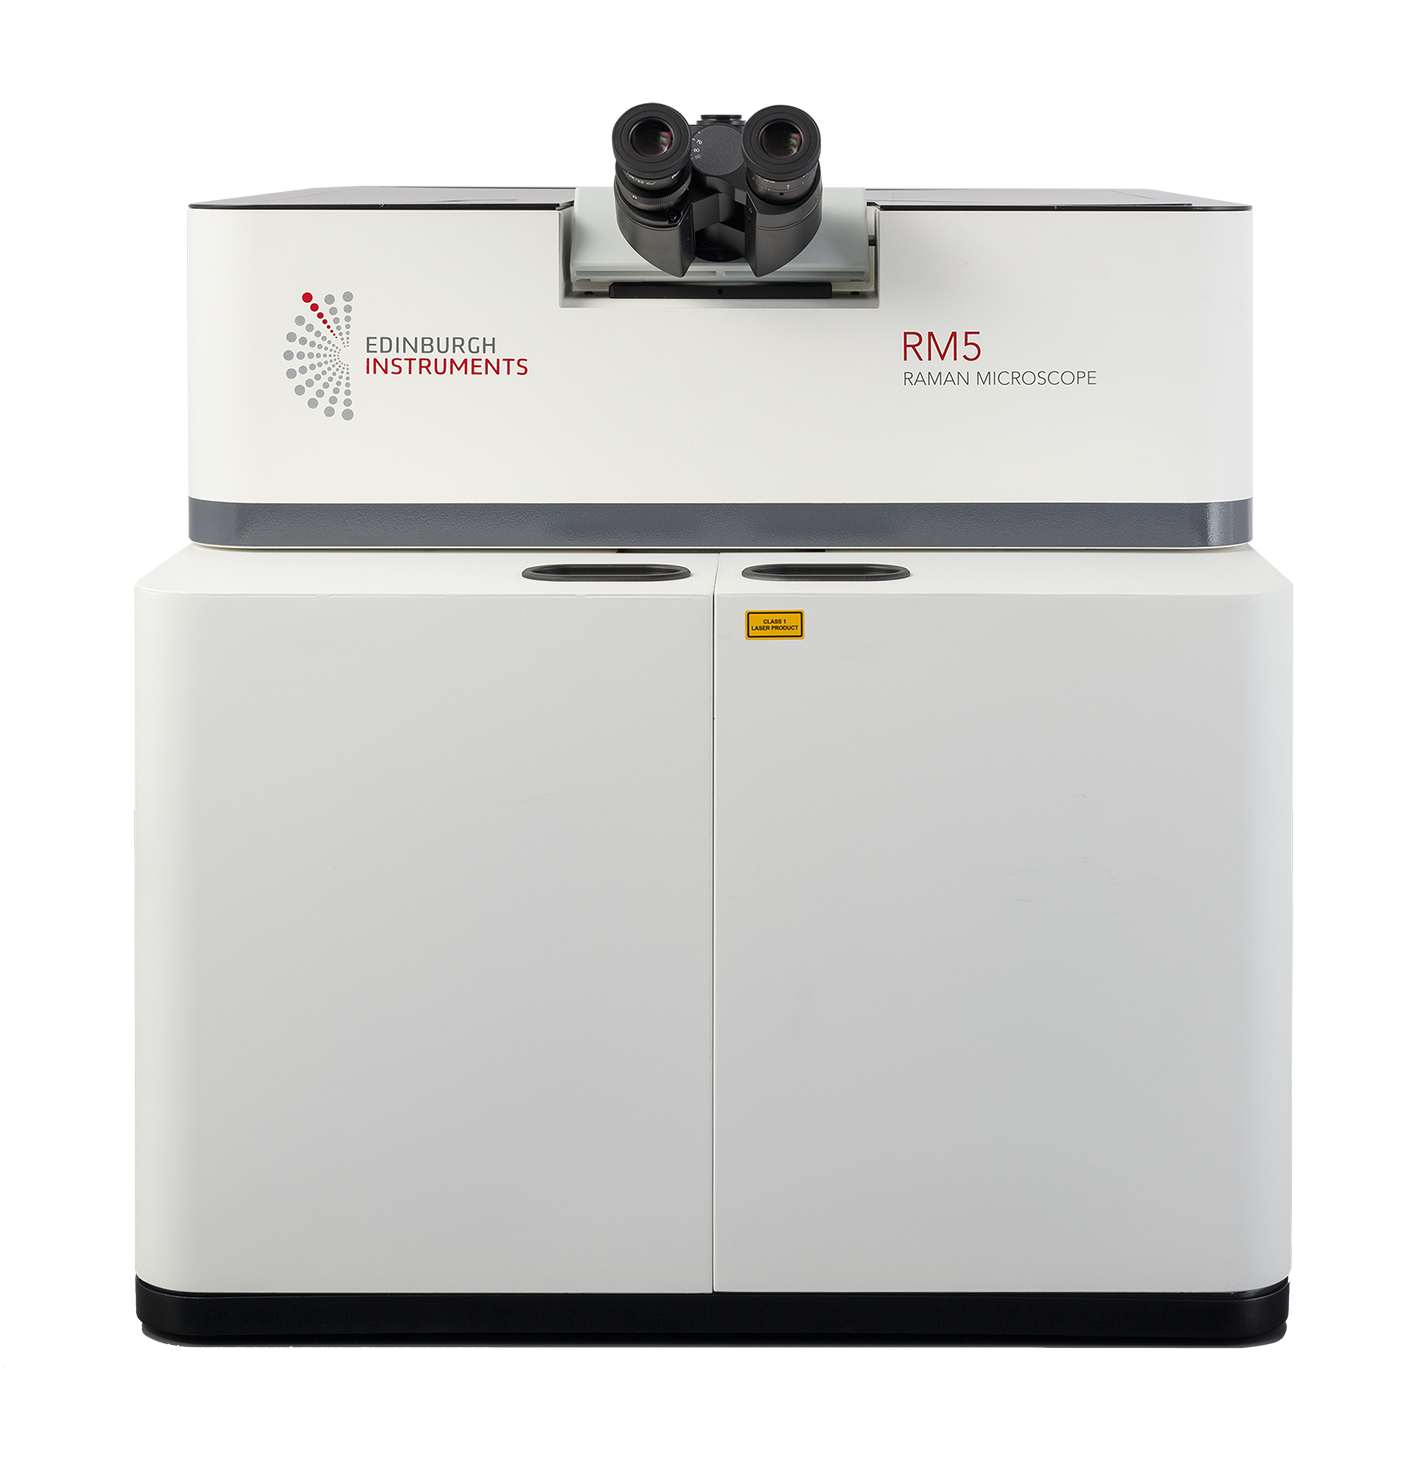 Figure 1. Edinburgh Instruments RM5 Raman Microscope.
The two species initially analysed were E. coli and B. subtilis. E. coli is a predominant species that causes extraintestinal illness in humans, such as urinary tract infections, pneumonia, and meningitis. B. subtilis, while not considered pathogenic to humans, is in the same genus as B. anthracis, the species responsible for anthrax. The two species were first analysed using Raman spectral analysis, Figure 2. One hundred spectra were recorded from different points across each colony. Then, each spectrum was fit with the same background correction algorithm and maximum-minimum normalisation, which corrects for any sample and experimental variables such as thickness and density without significantly altering spectral features.4 The solid blue and red lines represent the mean spectra from each 100-spectrum dataset, and the surrounding shaded curves represent the ± standard deviation.
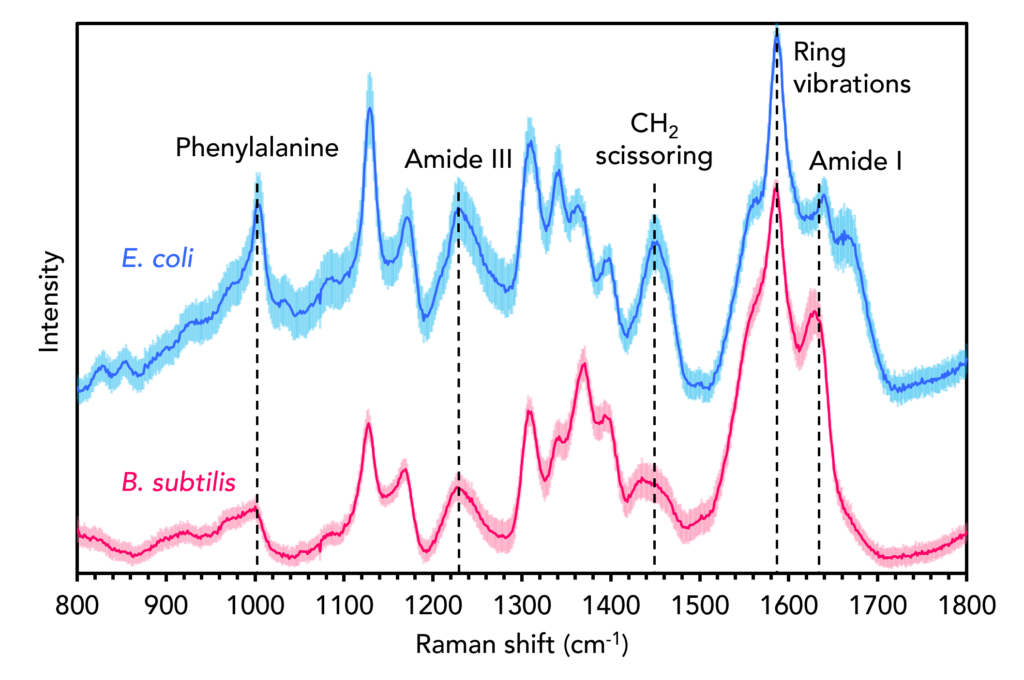
Figure 2. Raman spectra of B. subtilis (red) and E. coli (blue).
Both spectra contain the archetypical vibrational fingerprints of biological materials, such as the band attributable to the amino acid phenylalanine at 1001 cm-1, the amide III and I bands at 1250 cm-1 and 1640 cm-1, the CH2 scissoring band at 1450 cm-1, and the sharp band at 1580 cm-1 which can be assigned to aromatic ring vibrations from nucleic acid bases.5 Subtle differences between the two species can be observed, including the relative intensities, positions, and shapes of various bands within the mean spectra. The Raman spectra of bacteria are information-rich and, under the correct experimental conditions and with appropriate data pre-processing, can be used to discriminate between species and even strains based on differences in their chemical composition.
When detecting bacterial infections in a clinical setting, discriminating different species and administering specific treatments is crucial because the incorrect use of antimicrobial drugs causes antimicrobial resistance. A manual comparison of the statistically significant number of Raman spectra required for strain and species delineation is impractical, time-consuming, and unreliable. Therefore, Raman spectra are standardly analysed with MVA techniques that enable the categorisation of samples into different groups based on the spectral variance and chemical information they exhibit.
One MVA technique frequently used alongside Raman spectroscopy is PCA.6 This powerful dimensionality reduction technique reduces spectra into a defined number of principal components (PCs), which only retain information about the key variables causing variance across the dataset. It is an unsupervised technique that finds patterns in datasets and is excellent for exploratory data analysis. The output of PCA is an easily interpretable cluster plot in which each measurement from the dataset is a point, and the relative position (scores) of each point within the plot infers differences in the spectral output and, therefore, chemical composition. PCA was performed on the combined spectral datasets to discriminate between the E. coli and B. subtilis samples, Figure 3.
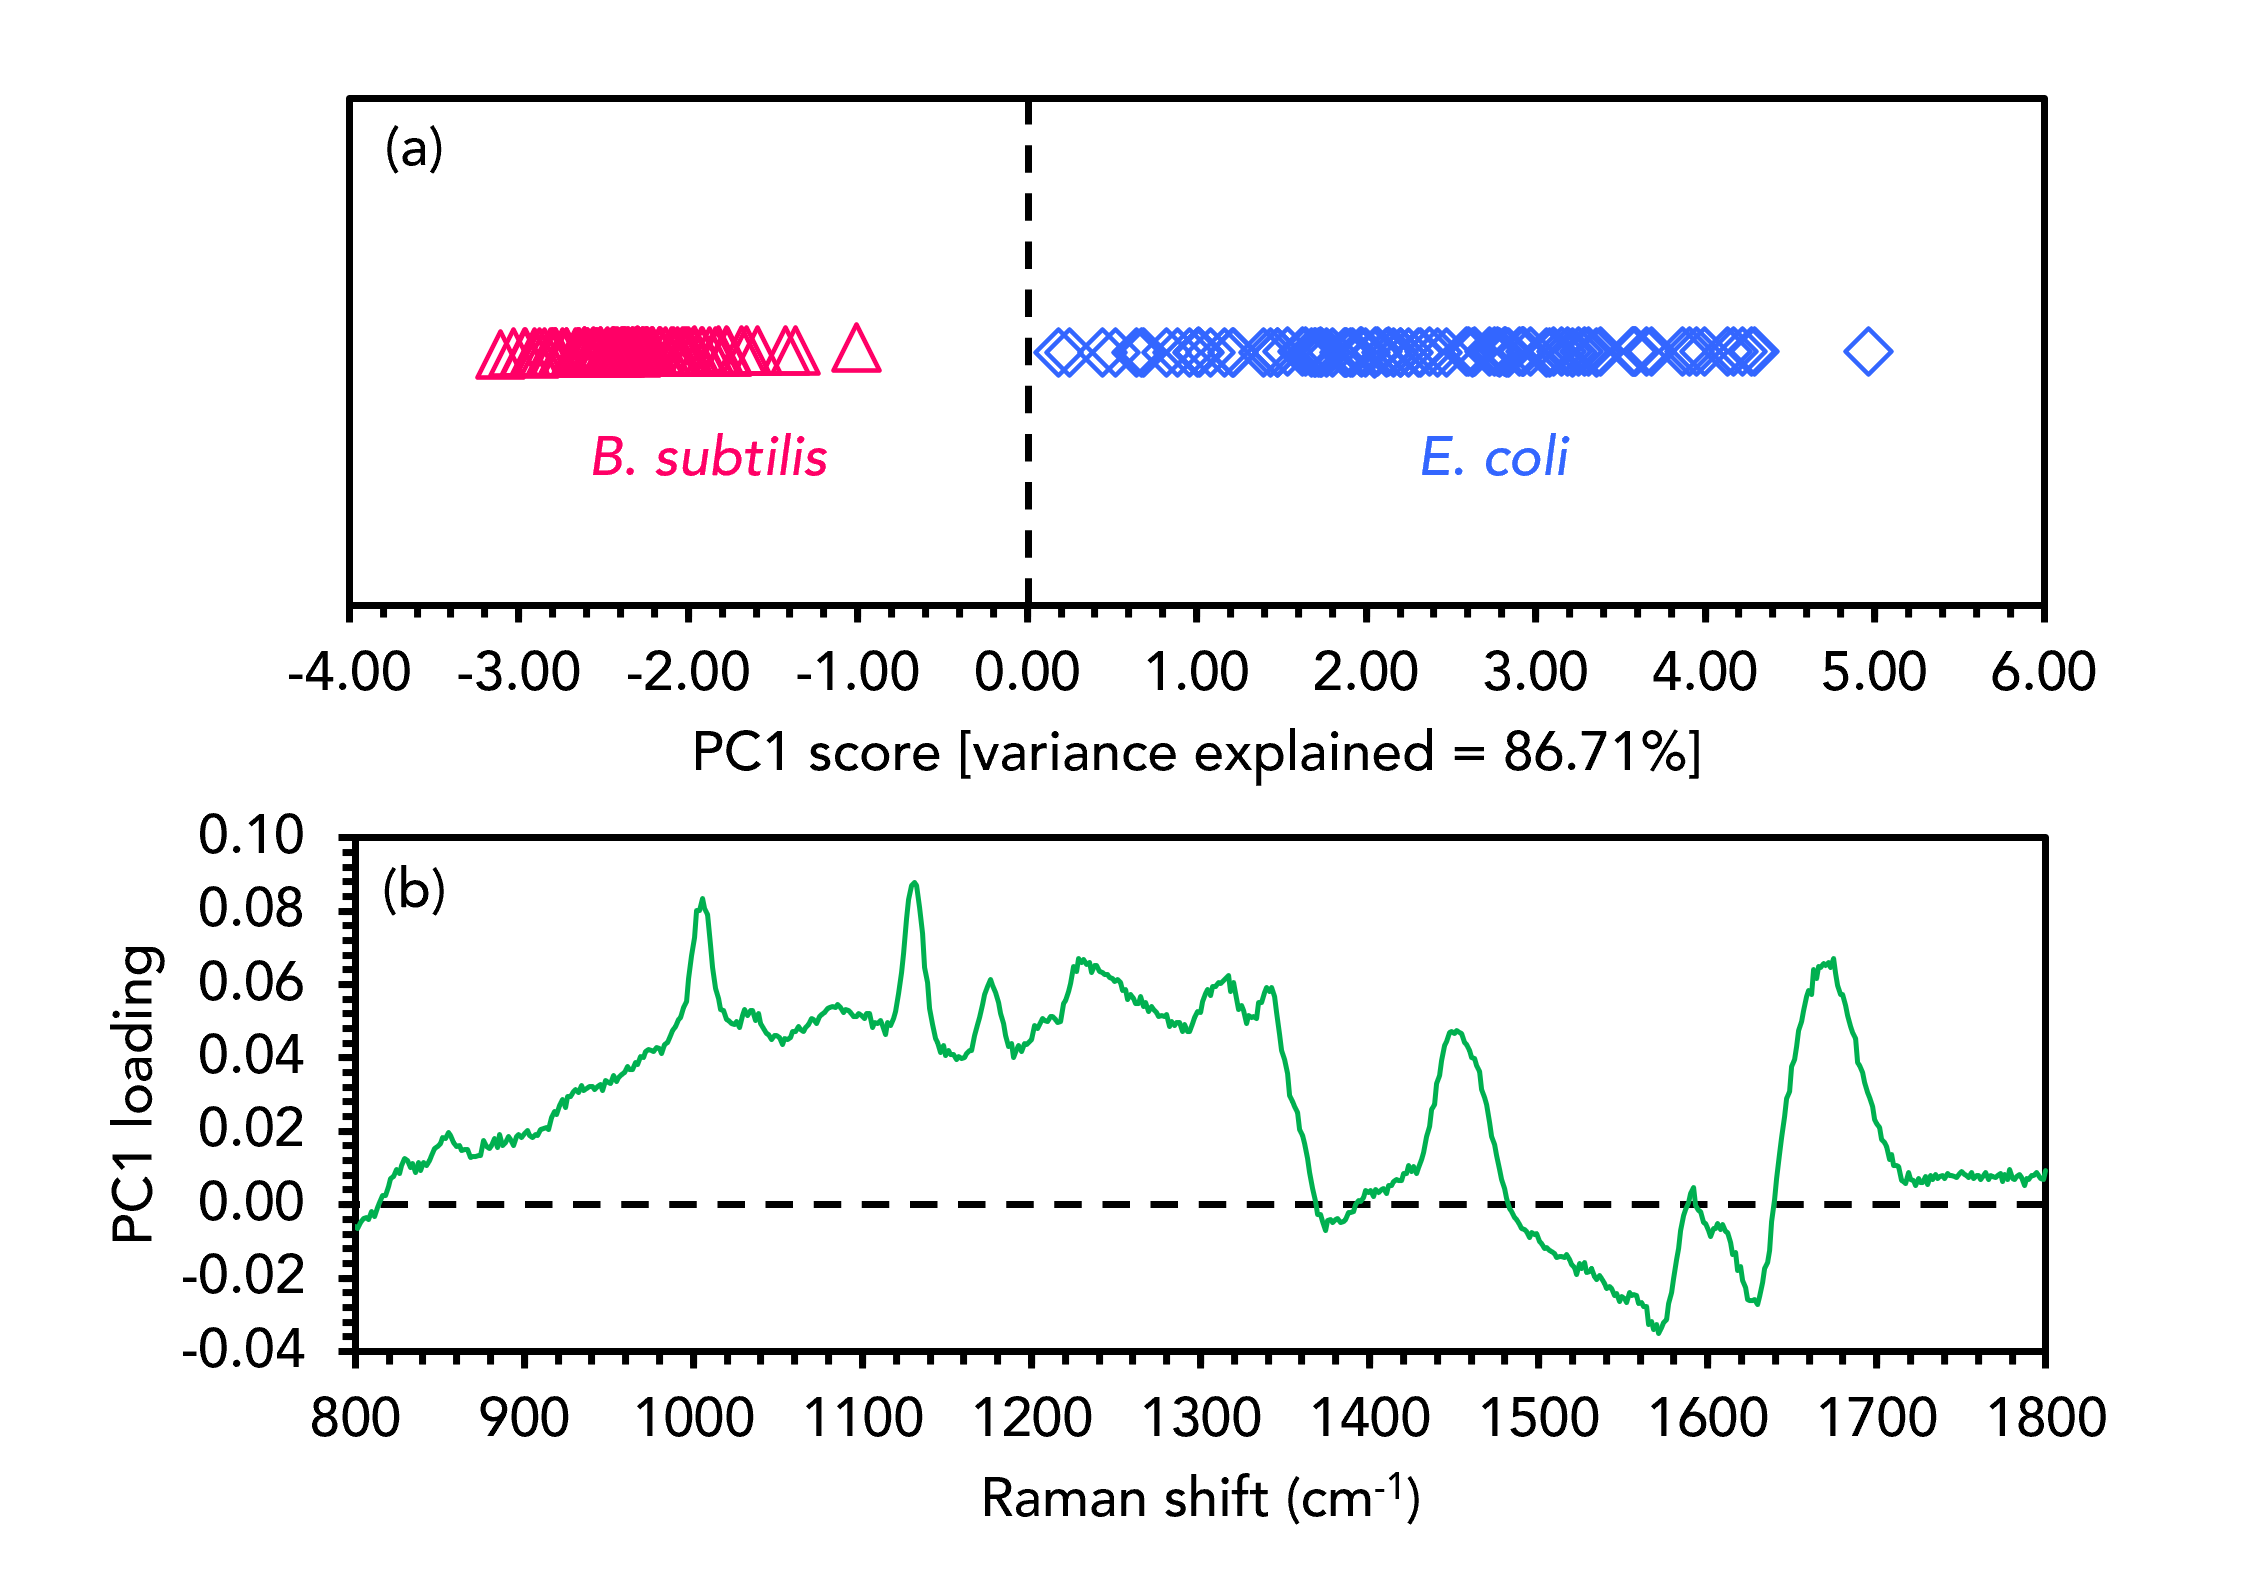
Figure 3. PCA discrimination of B. subtilis (red) and E. coli (blue).
The PCA score plot in Figure 3a shows that the two samples were well separated and hence discriminated effectively based on their spectral features. Separation between the two bacteria was observed in the first PC (PC1), which is the PC that gives rise to the highest level of spectral variance (86.71%) from across the dataset. Only one PC was needed to separate the species in this instance, but for more complex examples PCA scores plots can be two or three dimensional and include any combination of PCs. The PCA scores for each spectrum in the dataset are linked to corresponding PC loadings, shown in Figure 3b for PC1. For spectral datasets, the PC loading plot appears as a spectrum which can have positive and negative peaks. The loading plot indicates that the E. coli spectra cluster positively in PC1 because of features such as the bands attributable to phenylalanine, the amide III vibration, and the CH2 scissoring mode, which are all positive in the loading plot. The B. subtilis clusters negatively in PC1 because the features that dominate the E. coli spectra are diminished proportionately to the much more intense aromatic ring vibration band, which is negative in the loading plot.
PCA can also be used to generate images showing the location of different species. PC scores contain information about the entire Raman spectrum from each imaging pixel, which means that components within samples with very subtle spectral differences can be discriminated within the image.
To demonstrate this, E. coli and C. sporogenes, a species abundant in the human microbiome that can cause endogenous infections, were added to the same CaF2 slide. A Raman map was taken across the interface between colonies of the two species. PCA was performed on the Raman mapping dataset, in which each spectrum was baseline corrected using the same Savitsky-Golay filter and maximum-minimum normalised, and images were constructed using PC1 scores, Figures 4. The image demonstrates that the two species could be spatially distinguished using their clustering in PC1, because it shows an evident change in the spectral signatures exhibited on either side of the interface.
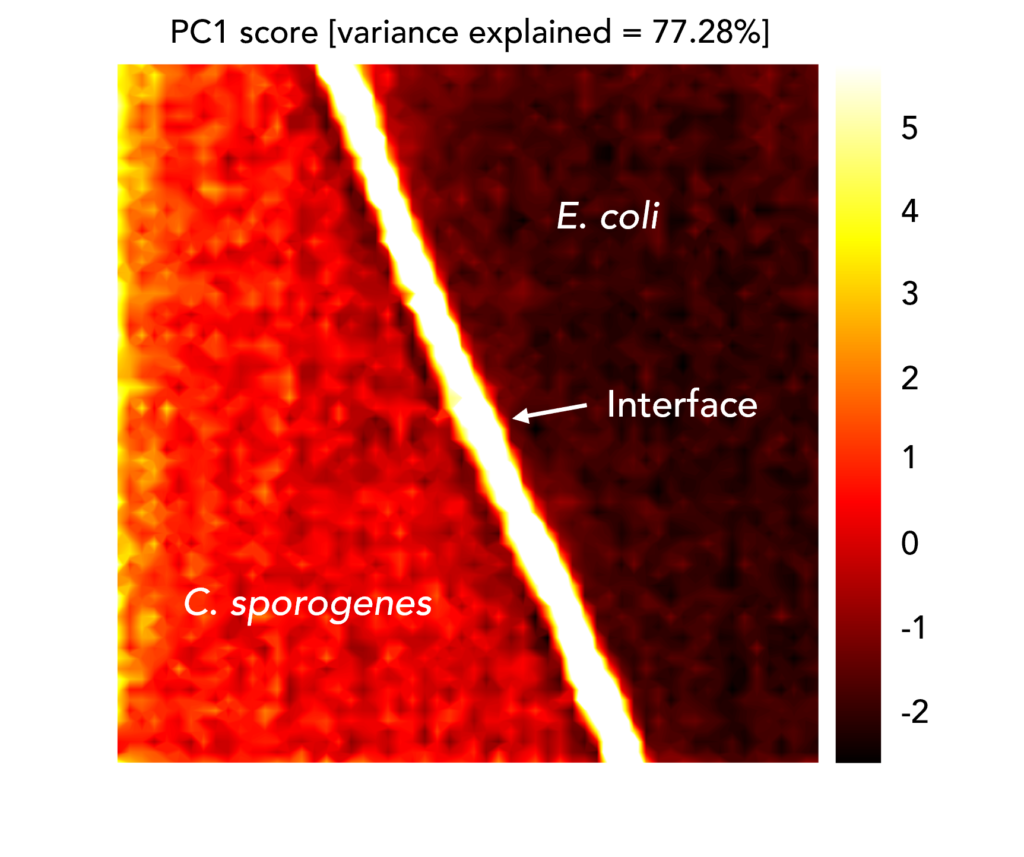
Figure 4. PCA image of the interface between C. sporogenes and E. coli colonies overlapping on the same CaF2 slide.
The rapid and accurate identification of bacteria is essential for various clinical and biological applications. Raman microscopy was combined with PCA to discriminate between different bacterial species. Exploratory research such as this is crucial for translating Raman spectroscopy into clinical environments for diagnostic purposes.