


Raman Microscopy for Pharmaceutical Analysis
The pharmaceutical industry is a crucial contributor to scientific progress and medical breakthroughs. It is responsible for the production of a vast range of products that society has come to rely heavily on, from life-saving medicines to everyday over-the-counter treatments for minor ailments or cosmetic purposes. Raman microscopy for pharmaceutical analysis has become a valuable technique for investigating products and quality control in the industry.
Key Points
- The pharmaceutical industry requires reliable analytical techniques at many stages in the product development pipeline.
- Pharmaceutical applications of Raman spectroscopy are becoming increasingly popular due to the high level of specificity, ability to perform rapid chemical analysis in real-time, and versatility in instrumentation.
- Here, we show how Raman microscopy, carried out on the RM5 and RMS1000 Confocal Raman Microscopes can be used for pharmaceutical analysis.
Introduction to Raman Microscopy for Pharmaceutical Analysis
To maintain high levels of innovation and productivity, pharmaceutical research laboratories and manufacturing plants require robust and reliable analytical techniques at many stages in the product development pipeline, including drug discovery, process monitoring, and quality control. One such technique is Raman spectroscopy, which is becoming increasingly popular because of its high level of molecular specificity, ability to perform rapid chemical analysis in real-time, and versatility in instrumentation for studying various sample types at different stages in the pipeline. In this Application Note we show how Raman microscopy, performed on the the Edinburgh Instruments RM5 and RMS1000 Raman Microscopes, can be used to perform chemical analysis of various pharmaceutical product types, including solid tablets, nasal sprays, emulsions, transdermal drug delivery systems, and drug polymorphs.
Figure 1. Edinburgh Instruments RM5 and RMS1000 Raman microscopes.
Pharmaceutical Applications of Raman Spectroscopy
Distribution of Ingredients on Tablet Surface
Pain relief tablets containing aspirin, paracetamol, and caffeine are common over-the-counter combination medications used to treat pain associated with headaches, muscle pain, arthritis, toothache, and the common cold. This formulation is effective because the three ingredients perform different functions: aspirin is a non-steroidal anti-inflammatory drug (NSAID), paracetamol is an analgesic that does not have anti-inflammatory properties and instead specifically targets pain, and caffeine is an alkaloid stimulant known to both reduce drowsiness and enhance the effects of the other active ingredients in the medication.
Since the drugs have unique chemical structures, Figure 2a, Raman spectroscopy can be used to non-destructively determine their distribution in a processed tablet based on features from their vibrational fingerprints. To image the distribution of the three drugs whilst accounting for the complex surface topology of the tablet, SurfMAP® surface mapping was used, Figure 2b and c. Aspirin (pink) was tracked using a band at 1047 cm-1, characteristic of an aromatic ring breathing mode.1 Paracetamol (blue) was tracked using a band at 872 cm-1, also characteristic of aromatic ring breathing.2 The differences in these modes’ relative intensities and positions were attributed to the electronegativity and positions (ortho for aspirin, para for paracetamol) of the substituent functional groups attached to the benzene rings. Caffeine (green) was tracked using the band at 1703 cm-1, not present in the spectra of the two other ingredients and characteristic of carbonyl stretching in the pyrimidinedione ring.3
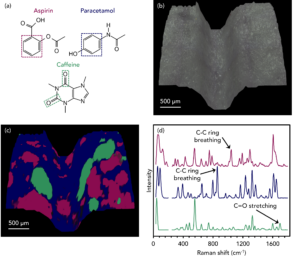
Figure 2. Imaging the distribution of aspirin (pink), paracetamol (blue), and caffeine (green) across the surface of a pharmaceutical tablet using SurfMAP® surface mapping.
Microparticle Analysis
Nasal sprays are designed to reduce the symptoms of allergies, sinusitis, and colds. They are shot directly into the nose by the user, and the active ingredient, suspended in an excipient solution, reduces inflammation in the lining of the nasal passage. The active ingredient is typically a corticosteroid hormone. The sample analysed was fluticasone propionate, shown in Figure 3a, with a four-ring structure typical of a steroid compound. Another critical ingredient listed in the formulation of the spray was microcrystalline cellulose, Figure 3a, which is used as a thickening agent and can provide the nasal lining with a barrier against airborne allergens and pathogens.
Raman imaging was used to determine the distribution of these components throughout a nasal spray formulation. An aliquot was sprayed onto a glass microscope slide, and after drying, optical and Raman microscopy were performed, Figure 3b and c. The white light image shows various microparticles on the glass slide. Raman analysis was used to classify the particles as either the fluticasone propionate active ingredient (pink) or microcrystalline cellulose (green). The spectra in Figure 3d show the Raman modes used to image both components: fluticasone propionate was represented using the most intense band at 1659 cm-1, assigned to C=O stretching, and the cellulose was imaged using the C-O stretching band at 1124 cm-1.4,5
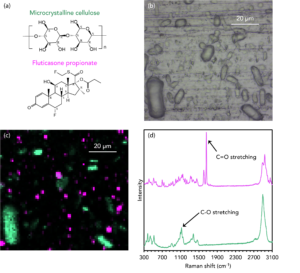
Figure 3. Imaging the distribution of fluticasone propionate (pink) and microcrystalline cellulose (green) microparticles in corticosteroid nasal spray.
3D Imaging of Moisturising Emulsion
An emulsion is a mixture in which a liquid, such as oil, is dispersed in small globules through another immiscible liquid, such as water. The pharmaceutical industry uses emulsions in skincare products, cosmetics, vaccines, and medications. In medicine, emulsions can be used to increase the bioavailability of drug compounds that are insoluble in water, and they can cover the unpleasant taste of drugs that must be administered orally. Over-the-counter topical products such as moisturising creams are manufactured this way because they are easily washed off with water and do not feel greasy after application. Characterising the morphology and distribution of particles within emulsions is crucial to ensure that such products are of high quality and meet their specific application needs.
To do this, an oil-in-water (o/w) moisturising emulsion was imaged in 3D using Raman microscopy. A 100X 0.9 NA objective and a confocal pinhole diameter of 50 μm were used to ensure high axial resolution and effective layer discrimination during imaging. The mapping data and corresponding spectra show that the emulsion consists of oil (red and green) and titanium dioxide (yellow) particles dispersed in 3D within a continuous aqueous phase (blue), Figure 4. The aqueous phase was assigned based on a broad mode ca. 3450 cm-1 characteristic of O-H stretching. This band was diminished in the areas containing the oil particles and vibrational signatures attributable to hydrocarbons dominated spectra. The oil particles were imaged using the high-wavenumber bands between 2800 cm-1 and 3000 cm-1, typical for CH2, CH, and CH3 vibrations.6 Based on the relative intensities of the bands making up this region, two different oil phases were detected (red and green). The titanium dioxide displayed a very intense and narrow peak at 148 cm-1, which can be assigned to Ti-O vibrations.8
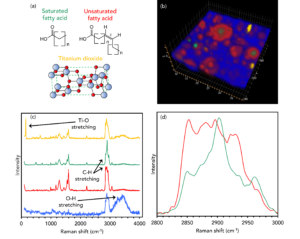
Figure 4. 3D Raman imaging of the distribution of oil and titanium dioxide particles dispersed within an aqueous phase in a moisturising emulsion.
Layer Analysis of a Transdermal Patch
Adhesive transdermal patches deliver a dose of an active ingredient into the bloodstream via the skin over time. Transdermal patches are utilised for a wide range of medical applications, the most well-known being the controlled release of the alkaloid nicotine to aid the cessation of tobacco smoking. Transdermal patches contain numerous polymeric layers that encase the active ingredient, and the non-destructive analysis of each layer is essential for manufacturers because it allows them to understand the quality of their product, determine the amount of active ingredient present, and identify any contaminants.
The transdermal nicotine patch was analysed using 3D Raman imaging, and information about the number of polymeric layers and their relative thicknesses was obtained non-invasively using an XZ cross-section of the collection volume, Figure 5. This data shows that six layers were identified in the sample with varying thicknesses. The outer layers, labelled 1 and 6 and shaded in red, were assigned as poly (ethylene terephthalate) (PET) based on a C-C aromatic ring breathing band at 1614 cm-1.9 The PET in layer 1 is the release liner of the patch and is designed to protect the adhesive and medication. This is the material that is removed directly before application. In layer 6, the PET protects the internal layers from damage whilst the patch is worn. The very narrow pink layer 2 contained a PET/polyisobutylene (PIB) blend and is the adhesive layer. The Raman spectrum for this layer included vibrational signatures from both the PET and PIB, and it was shaded in the image using a band at 1238 cm-1 previously observed for pure PIB.10 Blue layers 3 and 5 were polyethylene (PE). This microporous material can be used as a controlled release agent for the active ingredient. The spectra from these regions contained signature CH2 twisting peaks at 1296 cm-1, characteristic of PE.11 Finally, in layer 4, the nicotine, shaded in green, was identified using a mode at 1047 cm-1, attributable to in-plane deformations of the pyridine ring in the alkaloid.
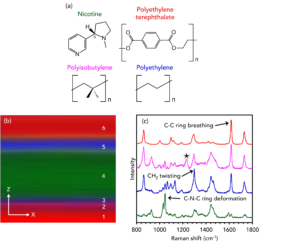
Figure 5. 3D Raman imaging of the polymer and active ingredient layers in a transdermal nicotine patch.
Polymorph Discrimination
In the pharmaceutical industry, drug manufacturing techniques are highly complex and have a meaningful effect on the safety and efficacy of the final product. One phenomenon that can arise during this process is polymorphism, which is the formation of different crystallographic forms of the same drug compound.12 With knowledge and control of the crystal structure multiplicity within a formulation, the effectiveness of the active ingredient can be optimised.
Carbamazepine (CBZ), or 5H-dibenzazepine-5-carboxamide, is an anticonvulsant drug used in the treatment of epilepsy and as an adjunctive in treatments for schizophrenia and bipolar disorder. CBZ has five reported polymorphic structures, each with different dissolution rates and bioavailability.13 Commercial CBZ has a ρ-monoclinic crystalline structure, often referred to as CBZ III and is the most thermodynamically stable form at room temperature. Another polymorphic form is CBZ I, which has a triclinic crystallographic structure, Figure 6a. CBZ III can be converted to CBZ I by heating it.
Crystals of CBZ III and CBZ I were analysed using Raman spectroscopy, and subtle differences in their spectra were detected, Figure 6b-d. In the low wavenumber region in Figure 6b, corresponding to intermolecular phonon modes in the crystal lattice, distinct spectral differences can be seen. The vibrational fingerprints in this region differ because the CBZ molecules adopt different packing orientations in the two crystal structures. The bands highlighted at 108 cm-1 and 120 cm-1 for CBZ III and CBZ I are reported in the literature to be due to changes in σ-π back-bonding between the primary amide and aromatic groups during lattice vibrations.14 In Figure 6c, peak inversion between the two polymorphs at 1027 cm-1 and 1046 cm-1 is detected, and these bands can be assigned to in-plane bending vibrations of the aromatic C-H groups.15 Changes are also seen in Figure 6d between 3045 cm-1 and 3070 cm-1, corresponding to the stretching vibrations of the same C-H groups. The energies of these vibrations are altered when the packing orientation of the CBZ molecules changes during polymorphic phase transitions.
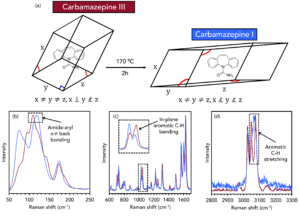
Figure 6. Discrimination of CBZ III and CBZ I using Raman spectroscopy.
Conclusion
In this Application Note, we have shown the detailed chemical analysis of various pharmaceutical product types using Raman microscopy. Raman is a highly versatile technique that can be used for a broad range of pharmaceutical applications.
To learn more about pharmaceutical analysis using Raman microscopy, visit our other application notes in the Suggested Reading.
References
- E. L. Crowell et al., High-pressure of acetylsalicylic acid (aspirin): Raman spectroscopy, J. Mol. Struct., 2015, 1082, 29-37.
- C. Shende et al., Drug Stability Analysis by Raman Spectroscopy, Pharmaceutics, 2014, 6, 651-662.
- M. Baranska et al., Raman mapping of caffeine alkaloid, Vib. Spectrosc., 2008, 48, 153-157.
- H. R. H. Ali, Vibrational spectroscopic study of fluticasone propionate, Spectrochem. Acta A, 2009, 72, 244-247.
- N. Atykyan et al., Raman and FT-IR Spectroscopy investigation of the cellulose structural differences from bacteria Gluconacetobacter sucrofermentans during the different regimes of cultivation on a molasses media, AMB Express, 2020, 10.
- L. E. Jamieson et al., Ratiometric analysis using Raman spectroscopy as a powerful predictor of structural properties of fatty acids, Roy. Soc. Open Sci., 2018, 5, 181483.
- T. Sugiyama et al., Label-free Raman mapping of saturated and unsaturated fatty acid uptake, storage, and return towards baseline levels in macrophages, Analyst, 2021, 146, 1268-1280.
- Z. Osborne et al., An experimentally calibrated thermobarimetric solubility model for titanium in coesite (TitaniC), Contrib. Mineral. Petr., 2019, 174.
- E. Rebollar et al., Physicochemical modifications accompanying UV laser induced surface structures on poly(ethylene terephthalate) and their effect on adhesion of mesenchymal cells, Phys. Chem. Chem. Phys., 2014, 16, 17551-17559.
- A. C. De Luca et al., Diffusion in Polymer Blends by Raman Microscopy, Macromolecules, 2008, 41, 5512-5514.
- A. Kotula et al., The rheo-Raman microscope: Simultaneous chemical, conformational, mechanical, and microstructural measures of soft materials, Rev. Sci. Instrum., 2016, 87, 105105.
- D. Chistyakov et al., The Polymorphism of Drugs: New Approaches to the Synthesis of Nanostructured Polymorphs, Pharmaceutics, 2020, 12, 34.
- S. Fateixa et al., Carbamazepine polymorphism: A re-visitation using Raman imaging, Int. J. Pharm., 2022, 617, 121632.
- P. J. Larkin et al., Polymorph Characterization of Active Pharmaceutical Ingredients (APIs) Using Low-Frequency Raman Spectroscopy, Appl. Spectrosc., 2014, 68, 758-776.
- L. E. O’Brien et al., Use of in situ FT-Raman to study the kinetics of the transformation of carbamazepine polymorphs, J. Pharm., Biomed. Anal., 2004, 36, 335-340.
