The hybrid halide perovskite has recently emerged as a new class of low cost semiconductor for optoelectronic applications. They have received widespread attention as an absorber in photovoltaic cells, where they have achieved a remarkable increase in solar cell efficiency; from 9 % in 2012 to 22 % in 2017.1-3 Despite this high efficiency, further research into the fundamental physics and stability of these materials is required. One important area of research is understanding how temperature affects the properties of the perovskite. Photovoltaic cells are exposed to a wide range of climates, with ambient temperatures ranging from -20 °C to 40 °C. Furthermore; the actual working temperature inside the cell could greatly exceed the ambient temperature, due to heating from solar irradiation, and has been shown to be as high as 70 °C in some cases.4 It is therefore crucial to understand the influence that temperature has on the photophysics and performance of perovskite photovoltaic cells. The FLS1000 Photoluminescence Spectrometer can be equipped with a range of cryostat accessories that enable the photoluminescence properties of a material to be studied over a temperature range of 2.3 K to 800 K. In this application note the temperature dependence of the photoluminescence of methyl ammonium lead iodide perovskite is investigated using the FLS1000 with the liquid nitrogen cryostat accessory.

Figure 1: FLS1000 Photoluminescence Spectrometer with double excitation and emission monochromators.
The term perovskite refers to any compound which has an ABX3 crystal structure, where A and B are two different cations and X is the anion. The highest performing and most widely studied perovskite for photovoltaic applications is methylammonium lead iodide (CH3 NH3 PbI3), also known as MAPI, the structure of which is shown in Figure 2.

Figure 2: The unit cells of the cubic, tetragonal and orthorhombic phases of MAPI perovskite.
The lead cation (blue) is located in the centre of a cube of methylammonium cations (green) and is surrounded by an octahedron of iodide anions (red). There are three different phases of the crystal structure that MAPI can adopt, with the temperature controlling which phase is thermodynamically stable. At room temperature MAPI is known to be in the tetragonal phase where two of the unit cell lengths are equivalent (a = b ≠ c).W At lower temperatures the tetragonal symmetry is broken and MAPI adopts the orthorhombic structure where all three unit cell lengths are different (a ≠ b ≠ c).5 At elevated temperatures the symmetry of the structure increases, with MAPI adopting the cubic crystal structure (a = b = c).5 The temperature of the transitions between these three structures can be determined using photoluminescence spectroscopy.
MAPI perovskite films were deposited on quartz discs, using the methylamine / acetonitrile route developed by Noel et al. 6 After deposition of the perovskite, the films were annealed on a hotplate at 100°C for 10 minutes.
Photoluminescence emission spectra were measured on an FLS1000 Photoluminescence Spectrometer equipped with double monochromators, a 450 W Xenon lamp, a PMT-980 detector and an extended temperature range (77 K to 500 K) liquid nitrogen cryostat (N-K06exd). The perovskite coated quartz discs were secured inside the cryostat and photoluminescence measurements performed under a nitrogen atmosphere. The sample was allowed to equilibrate for 10 minutes between each temperature change. The cryostat temperature was fully controlled using the Fluoracle® software of the FLS1000. This allowed the photoluminescence temperature maps to be acquired automatically by Fluoracle, without requiring oversight by the user.
At room temperature MAPI has a single well-defined photoluminescence (PL) peak at 790 nm which corresponds to band-to-band recombination of electrons in the conduction band with holes in the valence band. The variation in intensity and position of this PL peak with temperature was investigated over a temperature range of 370 K to 80 K, as shown in Figure 3a-c. The most apparent change that can be seen from Figure 3a-c is that the PL intensity dramatically increases as the temperature is decreased. This increase in PL is due to the charge carriers becoming less mobile as the temperature is lowered, and therefore increasingly unable to reach the non-radiative recombination centres (defects) that are present in perovskite and instead must recombine radiatively. This gives rise to an increase in photoluminescence quantum yield with decreasing temperature.
In addition, the PL peak narrows as the temperature is lowered, reaching a minimum at 130 K. This narrowing arises from the decreasing population of phonons, and therefore less homogenous broadening of the PL due to phonon coupling, as the temperature is lowered.7 Below 130 K the PL spectrum starts to broaden substantially (see Figure 3c), developing a long tail that extends to 950 nm at 80 K. This low energy tail of the PL at low temperatures has been observed previously, and is thought to arise from emission from trapped charge carriers.5,7
Looking again at Figure 3a-c, it can also be seen that the peak wavelength of the PL shifts with temperature. At 370 K the peak wavelength of the PL is 786 nm while at 160 K it is 801 nm; the PL becomes red shifted as the temperature is decreased. As the PL from MAPI corresponds to band-to-band recombination of electrons and holes, the PL peak wavelength is a measure of the optical band gap of MAPI. The red shifting PL therefore indicates that the bandgap of the perovskite is becoming narrower (lower energy gap) with decreasing temperature. This is unusual behaviour, as in the majority of semiconductors the bandgap widens as the temperature is lowered.8 The opposite trend exhibited by perovskites has been predicted theoretically and arises from decreased orbital splitting as the lattice expands, and changes in the electron-phonon coupling.9, 10
To more clearly see the variation in PL wavelength, the peak wavelength is plotted as a function of temperature in Figure 3d. It can be seen that while PL wavelength does decrease with increasing temperature on average, the trend is far from smooth. Instead, there are clear discontinuities in the wavelength shift at 160 K and 310 K. These discontinuities correspond to the MAPI crystal structure undergoing a phase transition and allow the orthorhombic to tetragonal and tetragonal to cubic phase transition temperatures to be assigned as 160 ± 5 K and 310 ± 5 K respectively. These discontinuities arise since the three crystal structures of MAPI have different bandgaps, due to the different orbital overlaps within the three phases, and the PL wavelength therefore abruptly shifts at the phase transition temperature.5,7
Figure 3d demonstrates that temperature dependent photoluminescence spectroscopy is a powerful tool for measuring the bandgap of semiconductors and determining the phase transition temperatures. Photoluminescence temperature maps such as these are easily acquired using the FLS1000 with cryostat accessory, as the cryostat is fully controllable through the Fluoracle software of the FLS1000; enabling temperature maps to be acquired automatically.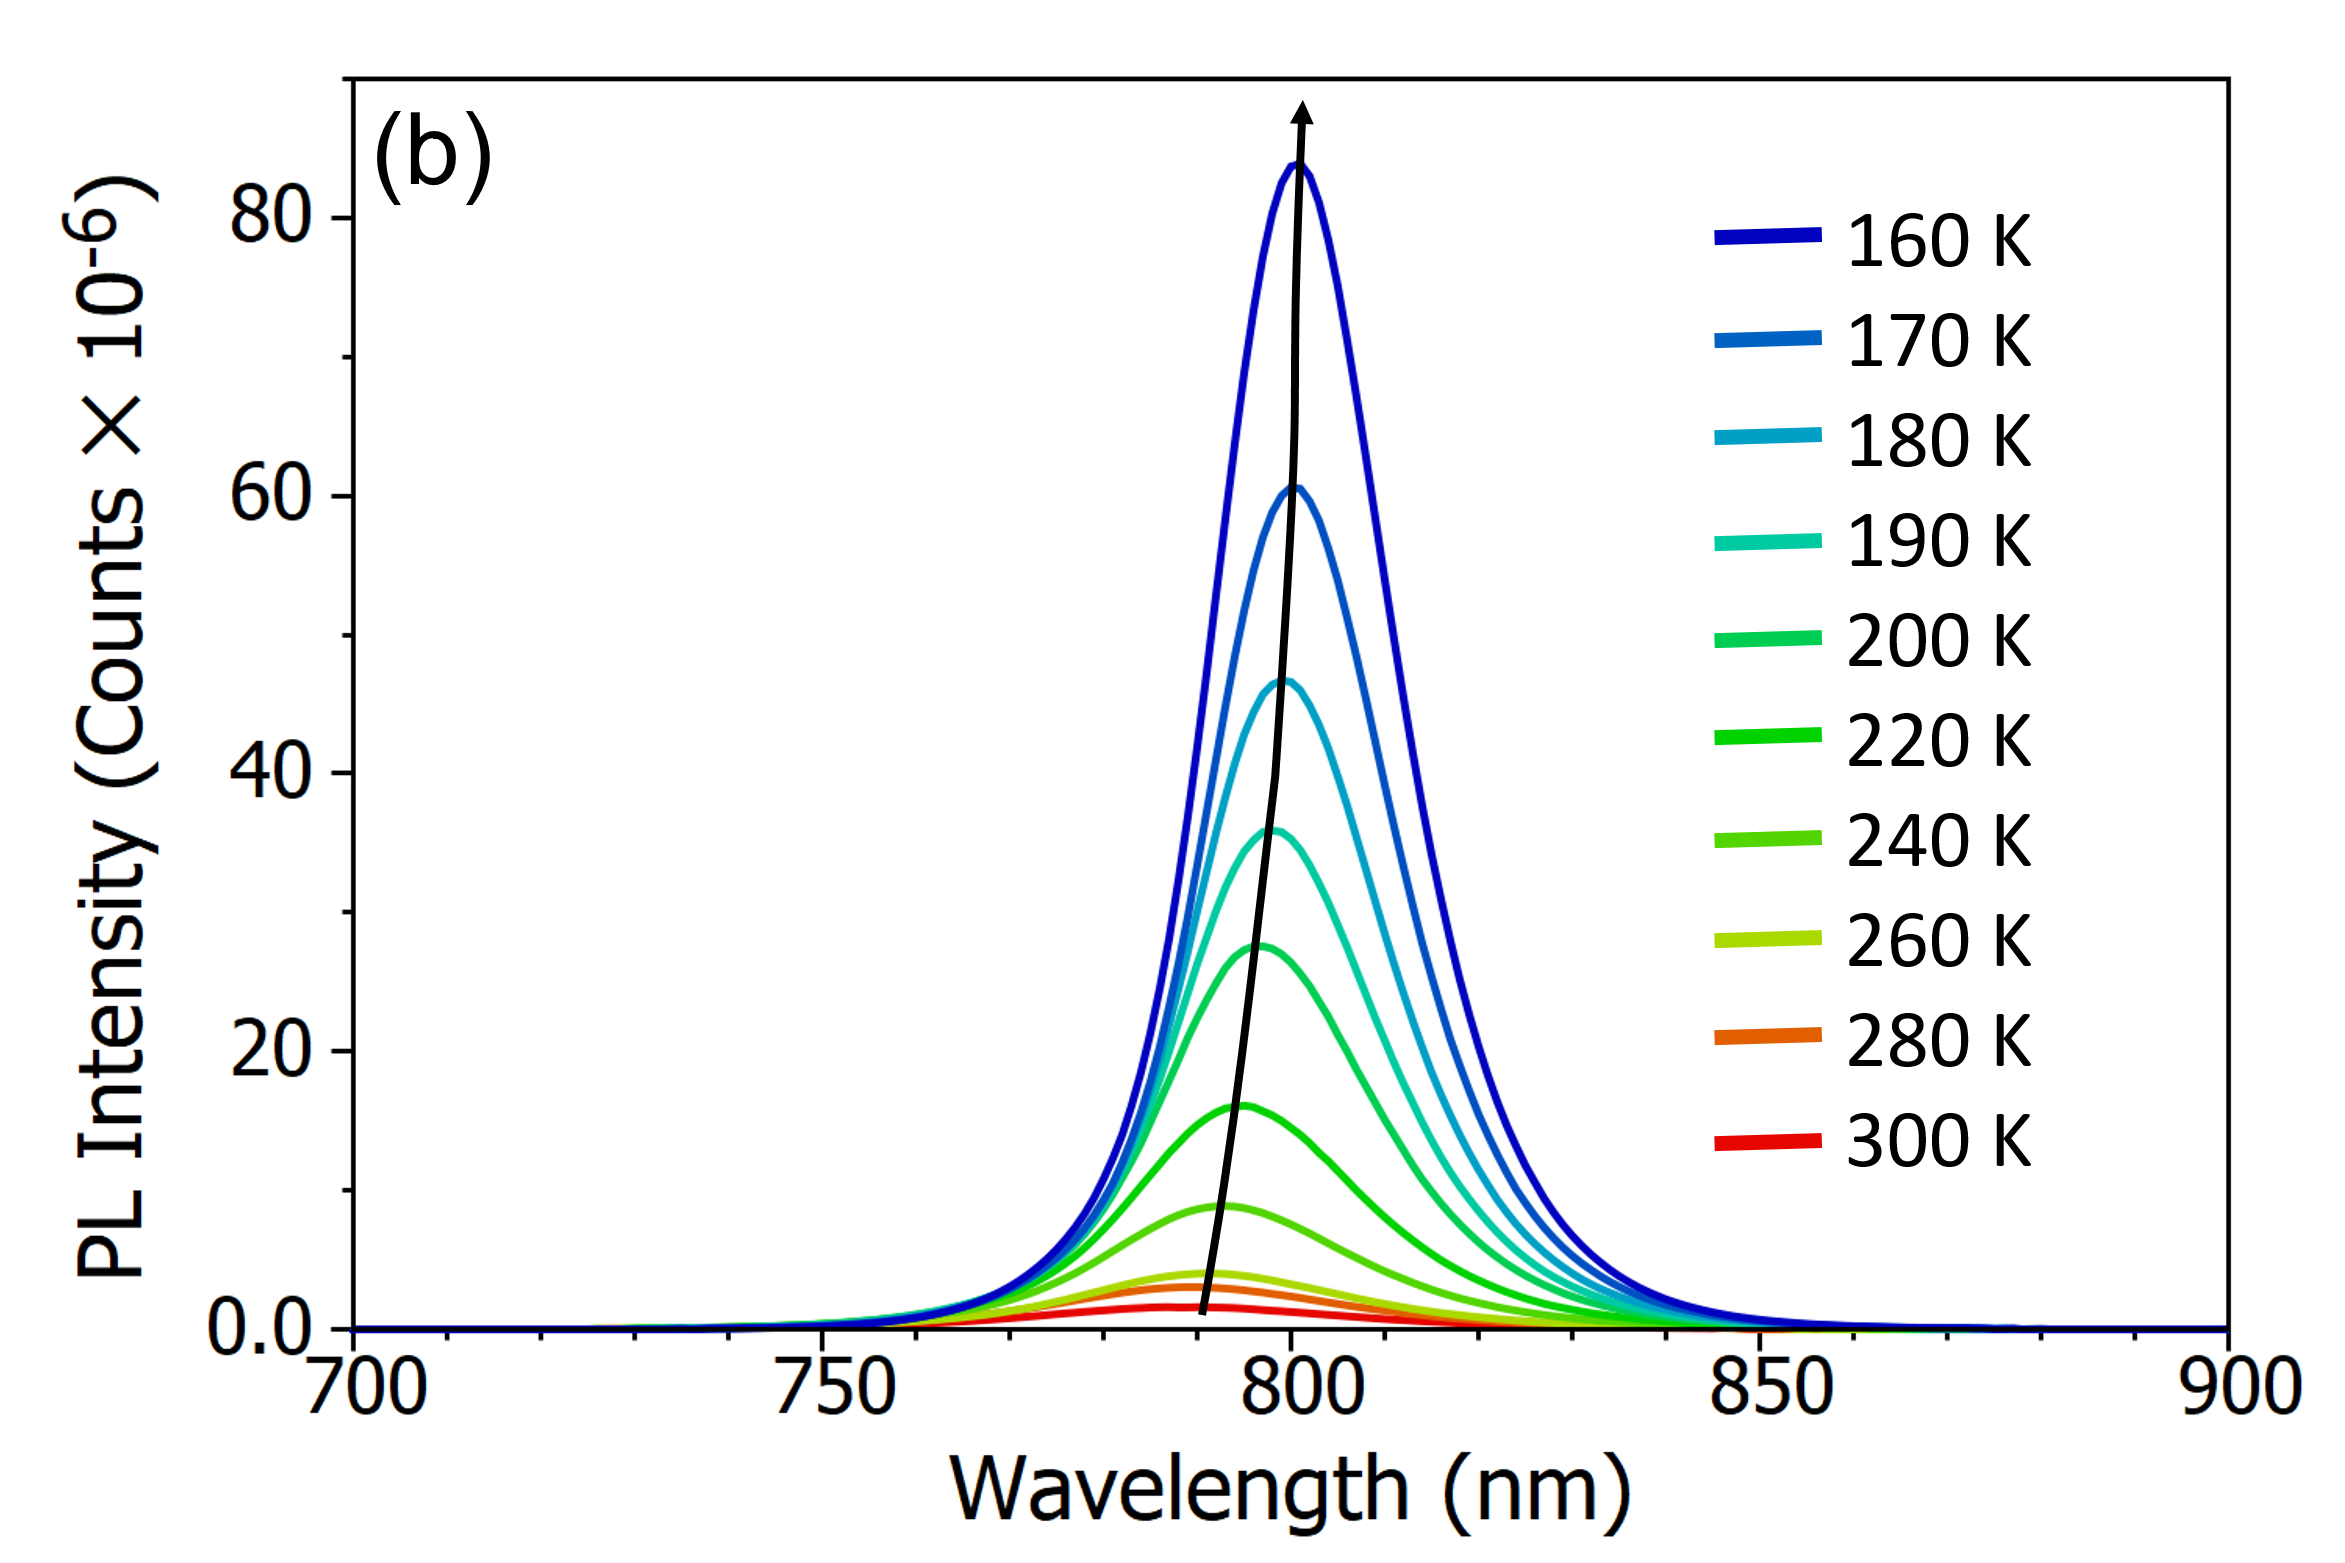
![]()
![]()
![]()


Figure 3. Variation of the photoluminescence spectrum of MAPI with temperature. (a) The change in PL spectrum over 370 K to 300 K, (b) the change in PL spectrum over 300 K to 160 K, (c) the change in PL spectrum over 160 K to 80 K and (d) the variation of peak wavelength of the PL emission with temperature. Excitation source = xenon lamp, λex = 400 nm, Δλex = 7 nm, Δλem = 2 nm. The black arrows in (a) and (b) illustrate the change in peak wavelength with temperature.
The temperature dependence of the photoluminescence of MAPI perovskite was investigated using an FLS1000 Photoluminescence Spectroscopy equipped with the liquid nitrogen cryostat accessory. The PL wavelength was found to redshift with decreasing temperature, indicating that the bandgap of MAPI decreases as the temperature is lowered, in contrast to the trend normally exhibited by semiconductors. The discontinuities in the PL wavelength shift were used to assign the orthorhombic to tetragonal and tetragonal to cubic phase transition temperatures to be 160 ± 5 K and 310 ± 5 K respectively.
If you are conducting halide perovskite research or the investigation of perovskite structures and would like to find out how our FLS1000 Photoluminescence Spectrometer can help you with your work, why not contact one of our sales team today email us at sales@edinst.com or give us a call on +44 (0) 1506 425300.
We are grateful to Dr. J. R. Harwell and Prof. I. D. W. Samuel of the Organic Semiconductor Optoelectronics group at the University of St Andrews for preparing the perovskite sample.
W. A. Saidi , S. Poncé, and B. Monserrat, Temperature Dependence of the Energy Levels of Methylammonium Lead Iodide Perovskite from First-Principles, J. Phys. Chem. Lett. 7, 5247-5252 (2016)