NIR and MIR Photoluminescence Spectra and Lifetime of an Erbium-doped Glass
Investigating the potential of erbium-doped fluoride glass for mid-infrared lasers in applications, including medicine, Lasers and telecommunications. Photoluminescence spectroscopy using an FLS1000 spectrometer with a MIR InAs-3100 detector analyses the material’s emission spectrum and lifetime.
Key Points
- NIR and MIR emitting materials are critical for many applications, including lasers, telecommunications and medicine.
- Photoluminescence spectral and lifetime measurements of an MIR emitting erbium doped fluoride glass were acquired using an FLS1000 Photoluminescence Spectrometer equipped with a MIR InAs-3100 detector.
Introduction
The study of materials emitting in the mid-infrared (MIR) region, particularly around 3 µm, is of significant interest due to their potential applications as gain media in lasers. Lasers utilising Er3+-doped media have diverse applications in soft-tissue medicine as their emission wavelength closely aligns with the fundamental stretching vibration of O-H at 2.95 µm. Previous studies have demonstrated the ability of these lasers to selectively excite or ablate protein-containing tissues, bones, and lipid-rich tissues within this spectral region while minimising collateral damage.1
The scope of their applications also extends beyond the medical field. The strong absorption of CO2 at 2.8 µm, CO at 2.4 µm, and NO2 at 2.9 µm can be utilised in laser-based systems for effective environmental monitoring.1 Er-doped glass is widely used as a fibre amplifier for all fibre communication. Using the photoluminescence peak of Er3+ at 1.5 μm, Er-doped fibres have been developed as the primary amplification medium for C-band (1.530 – 1.565 μm) and L-band (1.565 – 1.625 μm) optical amplifiers.2
In this application note, the photoluminescence spectrum and photoluminescence lifetime of an Er3+-doped ZnF2-BaF2-SrF2-YF3 (ZBSY-e) glass are characterised using an Edinburgh Instruments FLS1000 Photoluminescence Spectrometer.
Materials and Methods
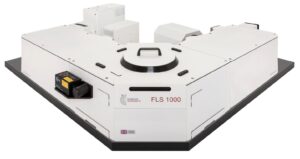
The sample was a 2.5 cm × 1.5 cm piece of Er3+-doped fluoride glass. The photoluminescence properties were characterised using an Edinburgh Instruments FLS1000 (Figure 1) equipped with a 2 W 980 nm laser diode with a pulse modulation (PM-2) box as an excitation source. The detector was a dual-mode MIR InAs-3100 which has a spectral range of 1.2 – 3.1 μm. The glass sample was held using the N-J01 Front-Face Sample Holder of the FLS1000.
Figure 1 Edinburgh Instruments FLS1000 Photoluminescence Spectrometer.
NIR & Spectra
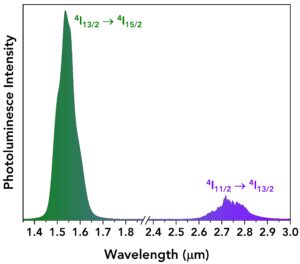
First, the photoluminescence spectrum of the glass was acquired using the 980 nm laser source in CW mode for excitation. Intense emission peaks were observed at around 1.55 μm and 2.75 μm (Figure 2).
Figure 2 Emission spectrum of the Er3+-doped ZBSY-e fluoride glass. The noise of 2.75 μm peak is atmospheric MIR absorption lines.
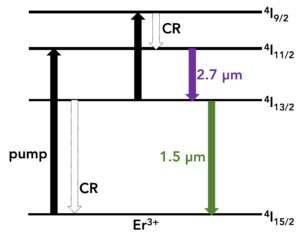
These peaks are assigned to the 4I13/2 –> 4I15/2 and the 4I11/2 –> 4I13/2 transitions, respectively, as shown in Figure 3. In this context, CR denotes the non-radiative process of cross-relaxation. The spectrum agrees with previous reports, which examined the efficiency of laser transitions of the rare-earth cations. It is suggested that with optimal engineering of the Er3+ energy levels and the fibre laser resonator, a high Er3+ concentration and effective cooling of the host fluoride glass, the commercialisation of high-power MIR lasers can be achieved.1
Figure 3 Energy-transfer process between excited Er3+ ions.
Time-Resolved Measurements
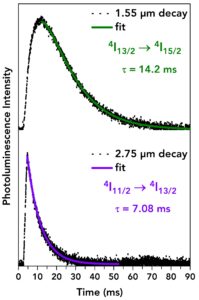
Next, the photoluminescence decays were measured using the 980 nm laser in pulsed mode at a repetition rate of 10 Hz. The laser pulse width was adjusted via the PM-2 box and was set to a pulse width of 1 ms. The photoluminescence decays of the 4I11/2 → 4I13/2 transition at 2.75 μm and 4I13/2 → 4I15/2 transition at 1.55 μm are shown in Figure 4. The 2.75 μm decay was fitted using a single exponential model, yielding a lifetime of 7.08 ms. The 1.55 μm decay has a rising component in addition to the decay and was therefore fitted using a double exponential model (one rising component and one decay component) which gave a decay lifetime of 14.2 ms.
Figure 4 Photoluminescence decays of the Er3+-doped ZBSY-e fluoride glass at 1.55 μm and 2.75 µm.
Conclusion
This application note demonstrates the capability of the FLS1000 for NIR and MIR photoluminescence spectra and lifetime measurements. The spectra and lifetimes of an erbium doped fluoride glass were measured, which is an important characterisation step when developing rare-earth-based applications, including lasers, medicine, environmental monitoring, and telecommunications.


