


Temperature-Dependent Quantum Yield of Chlorophyll Fluorescence in Plant Leaves
Key Points
- Photosystems I and II drive the photosynthesis chain
- Temperature dependence of photosystem I and II emission investigated using Cryosphere
- The Cryosphere enables temperature-dependent quantum yield measurements from 77K to 500K
Chlorophyll fluorescence of plants has long been used to understand their photochemistry and as an indicator of their photosynthetic efficiency. The fluorescence originates from Photosystems I and II (PSI and PSII, respectively) which are protein complexes located inside chloroplasts whose function is to drive the photosynthesis chain. They contain pigments that, upon excitation by light, initiate a chain of redox reactions that leads to the production of chemical energy. The intensity and spectral characteristics of chlorophyll fluorescence offers information on the energy transfer processes occurring under illumination. It can be used to study the influence of environmental factors such as temperature and light on the plant’s photochemistry.
Photosystems I and II (PSI and PSII, respectively) are protein complexes located inside chloroplasts whose function is to drive the photosynthesis chain. They contain pigments that, upon excitation by light, initiate a chain of redox reactions that leads to the production of chemical energy. The main photosynthetic pigments in green plants are chlorophylls and carotenoids. While carotenoids are accessory pigments, chlorophyll is a light-responsive electron donor fundamental to the photosynthesis chain. A schematic of the process is shown in Figure 1.
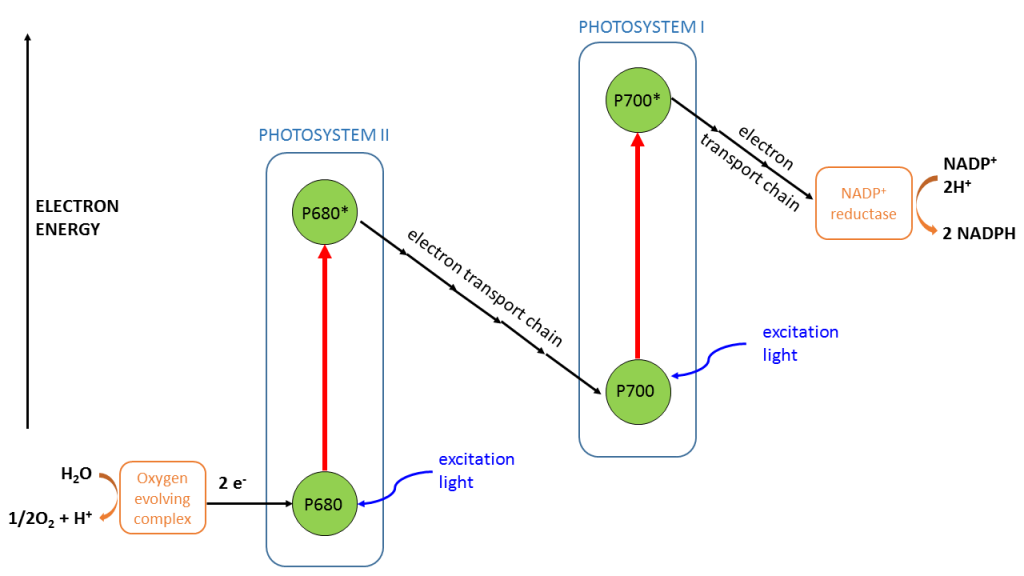
Figure 1: Simplified schematic of the photosynthesis process (Z scheme). P680 and P700 are the chlorophyll centres in photosystems I and II, respectively.
PSI and PSII differ in their absorption and fluorescence transitions although there is considerable spectral overlap between them. The emission spectra of isolated photosystems change when inside a leaf due to interactions with the matrix. The main PSII emission transitions show at 685 nm and 740 nm, the latter being a side band caused by vibrational sublevels. PSI emission shows as a broad band at 720 nm which is much lower in intensity.1 At room temperature the main contribution to fluorescence comes from PSII, the most widely studied photosystem.
Although the fluorescence of plant leaves is often studied with pulse-modulated measurements, continuous fluorescence analysis is a simpler method that provides valuable photochemical information.2 Continuous fluorometers can also be used for complementary measurements of quantum yield using an integrating sphere.3
Plant leaves show a much lower quantum yield of fluorescence than chlorophyll in solution. In vivo, the electron carrier chain converts excitation light into photosynthesis or heat production. Environmental effects can affect the relative absorbance of the different photosynthetic pigments as well as the balance between photosynthesis, fluorescence, and non-photochemical quenching. In order to obtain the full picture of the photosynthesis process it is necessary to characterise the absorption of the leaf besides the fluorescence emission. This can be performed in an integrating sphere; however it is not a widespread method and most researchers use an assumed value for absorbance.4 In addition, low temperature studies in leaves are a good method to study the effect of quenching on the electron transport chain.5 Typically the behaviour at 77 K and room temperature is compared but there is a lack of intermediate-temperature studies in the literature.
In this application note we present temperature-dependent fluorescence quantum yield of perennial leaves from 77 K to 300 K. The quantum yield was measured using an FLS1000 Photoluminescence Spectrometer equipped with the Cryosphere accessory which is a variable temperature integrating sphere. The Edinburgh Instruments Cryosphere allows accurate characterisation of the changes in quantum yield with temperature, accounting for any changes in absorption that depend on temperature.
Experimental
Two perennial leaves were studied: viburnum tinus (Sample 1) and holly (Sample 2). A square of 1 cm x 1 cm was cut from the leaf, washed with distilled water and placed in an FLS1000 Photoluminescence Spectrometer. Emission spectra at room temperature were acquired with a front-face solid sample holder (N-J03) and an Xe2 continuous xenon lamp.
Quantum yield measurements were performed with the Edinburgh Instruments Cryosphere accessory (Figure 2). The Cryosphere comprises a liquid nitrogen cryostat enclosed in an integrating sphere. The direct method of quantum yield measurement was employed, using a 1 cm x 1 cm square of PTFE as the reference. A neutral density filter (OD 2) was placed in the emission path in order to measure the excitation region of the spectrum without detector saturation effects.
The samples were placed in the Cryosphere holder and put under a vacuum of 10-5 mbar with a turbomolecular pump before starting the flow of liquid N2. The temperature was controlled from the Fluoracle software.
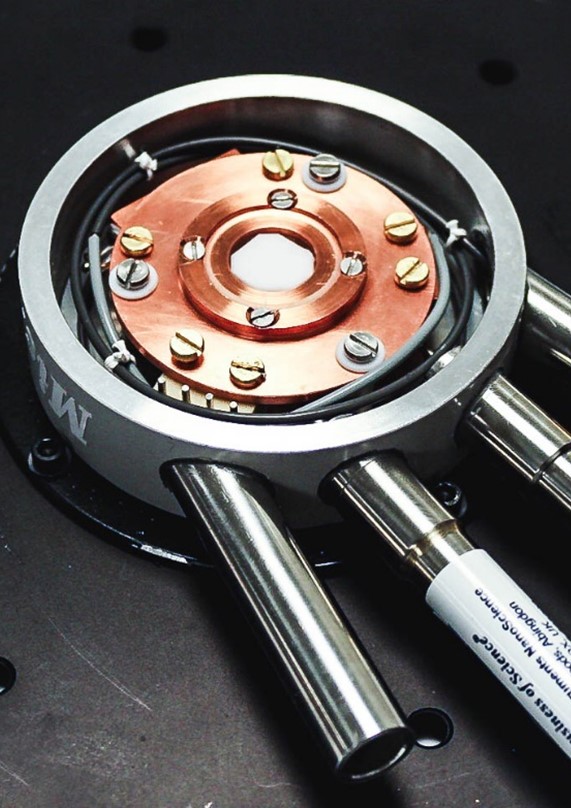
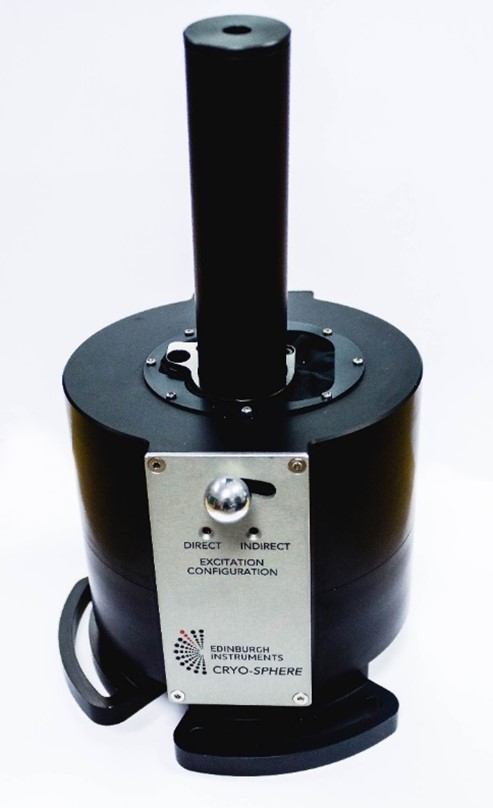
Figure 2: Variable temperature sample holder (top) and side view of Edinburgh Instruments Cryosphere accessory (bottom).
Results
Figure 2 shows room temperature emission spectra of Sample 1 acquired in 90° configuration and in the Cryosphere. As expected, chlorophyll fluorescence shows in the 650 nm – 850 nm range. The 680 nm transition is weaker than the 740 nm band, in agreement with previous measurements of fluorescence in plant leaves.6 This is due to reabsorption of PSII fluorescence: the absorption band of PSII extends up to 740 nm, so the observed intensity is lower than expected at λ < 740 nm. Moreover, the self-absorption effect depends on the geometry of the measurement system. In the Cryosphere the light emitted is reflected back onto the sample and this results in increased reabsorption. The normalised spectra agree above 740 nm, the region unaffected by self-absorption.
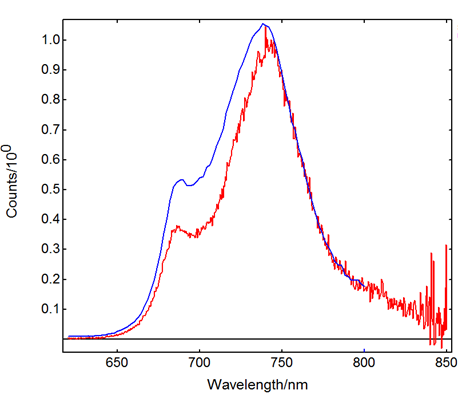
Figure 3: Sample 1 emission spectra acquired at room temperature in frontface sample holder (blue) and in Cryosphere (red, reference background subtracted). The spectra are normalised at 745 nm. Front-face measurement conditions: λex = 460 nm, Δλex = 2 nm, Δλem = 2 nm, step size = 2 nm, dwell time = 0.1 s. Cryosphere measurement conditions: λex = 465 nm, Δλex = 7 nm, Δλem = 4 nm, step size = 0.5 nm, dwell time = 1 s.
At 77 K the shape of the chlorophyll emission bands changes and in some cases it is possible to distinguish further maxima. Besides the 685 nm and 740 nm maxima, two bands appear at intermediate wavelengths.2 Figure 4 presents emission spectra from Samples 1 and 2 recorded at 77 K. They both clearly present bands originating from PSII, but in the case of sample 1 there is a third maximum at 696 nm. This band is not seen at room temperature and indicates different distributions of photosynthetic pigments in the samples.1
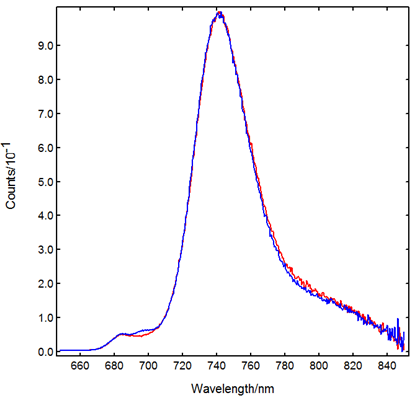
Figure 4: Peak-normalised 77 K emission spectra from Sample 1 (blue) and Sample 2 (red), recorded in the Cryosphere. Measurement conditions: λex = 465 nm, Δλex = 7 nm, Δλem = 4 nm, step size = 0.5 nm, dwell time = 1 s.
Cold temperatures suppress the photosynthetic electron chain, therefore increasing the quantum yield of fluorescence. This effect is shown in Figure 5, which contains emission spectra from Sample 2 at different temperatures. Since the 684 nm transition is heavily affected by reabsorption, it appears independent of temperature. The scattering peaks were recorded in the Cryosphere at the same time as the emission spectra, which allows calculating the absolute quantum yield of fluorescence in the Fluoracle software package. The result, shown in Figure 6, shows a well-defined trend which is in agreement with studies on isolated reaction centres.7
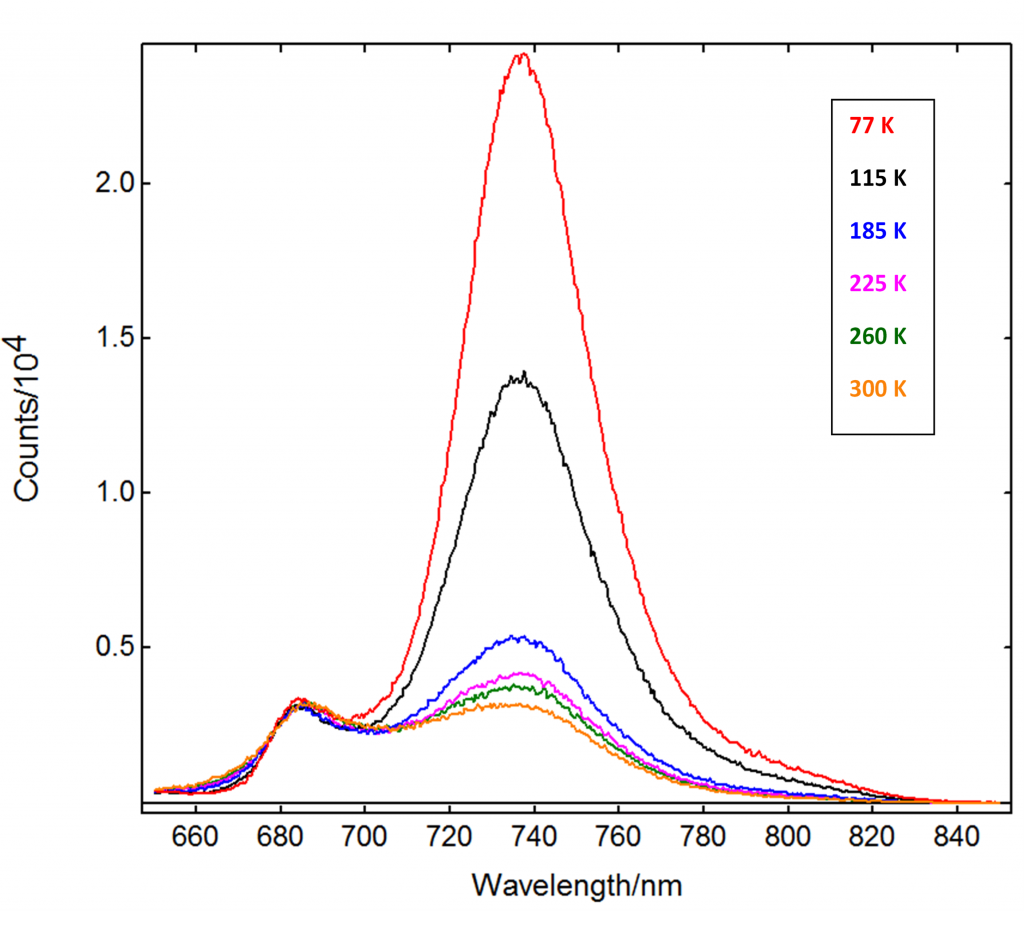
Figure 5: Emission spectra from Sample 2 acquired in Cryosphere at varying temperatures (indicated in legend). Measurement conditions: λex = 465 nm, Δλex = 7 nm, Δλem = 4 nm, step size = 0.5 nm, dwell time = 1 s.
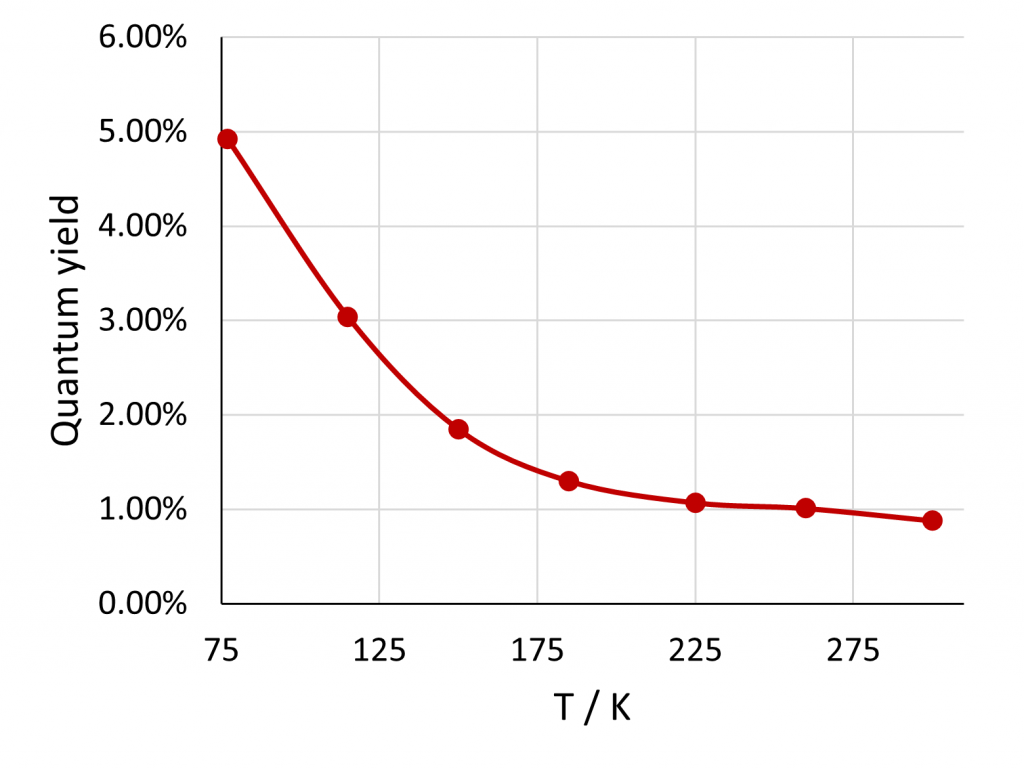
Figure 6: Absolute photoluminescence quantum yield of Sample 2 obtained from the experimental data in Figure 6. The scattering region of the spectrum and the reference sample were measured under the same conditions.
Conclusion
Chlorophyll fluorescence of plant leaves at cryogenic temperatures offers information on their composition and photochemistry. The relatively low fluorescence quantum yield values can be measure accurately thanks to the high sensitivity of the FLS1000 spectrometer. The quantum yield decreases with temperature from 5% at 77 to 1% at 300 K. This decreasing trend is easily characterised with the Cryosphere accessory.
Download Application Note
Download the complete application note: Temperature-Dependent Quantum Yield of Chlorophyll Fluorescence in Plant Leaves
Sign-Up for our Application and Technical Notes
If you have enjoyed reading our Application Note, why note sign-up to our infrequent newsletter via our red Sign-up button below.
