Mapping the Raman Spectra
Raman Mapping of a sample area provides previously unavailable information about the chemical and physical differences across a sample. This can confirm the identity and presence of specific components and reveals their location and distribution within a sample.
Raman mapping is a powerful technique and is employed in many industries:
- In Material Sciences it can investigate how structure, stress and strain vary across a sample.
- In Biology and Life Sciences it can be used to image tissues, whole cells or their components without the need for dyes and stains, or to locate Raman and SERS tags.
- In Pharmaceuticals it can be applied to identify ingredients and analyse their distribution when developing and producing drugs.
The data shown below is from a commercial composite pain killer tablet.
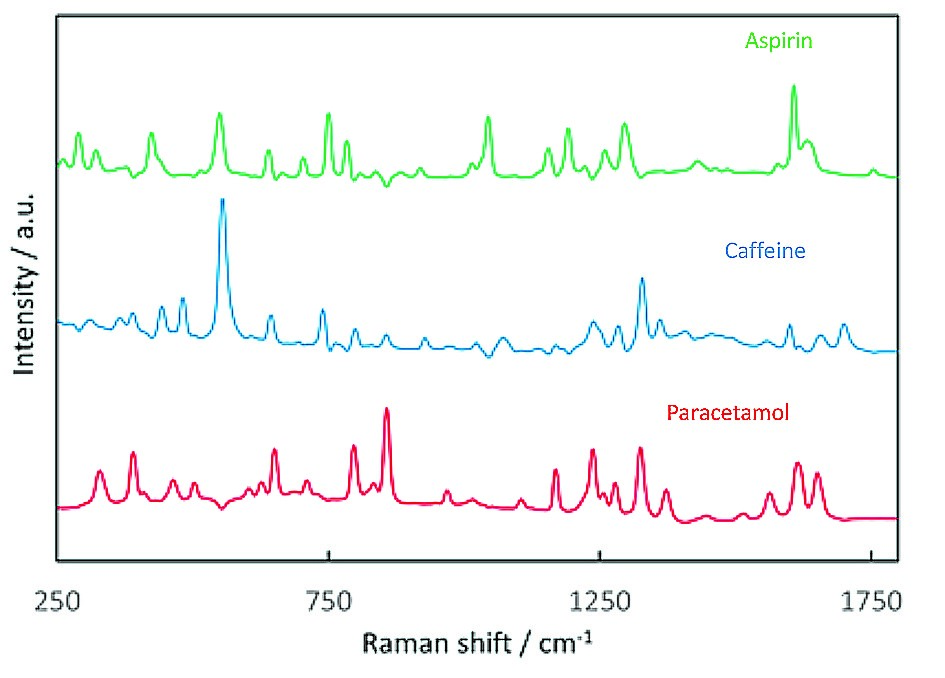
Figure 1. Raman spectra of the constituents of a commercial pharmaceutical tablet, excited with 785 nm laser.
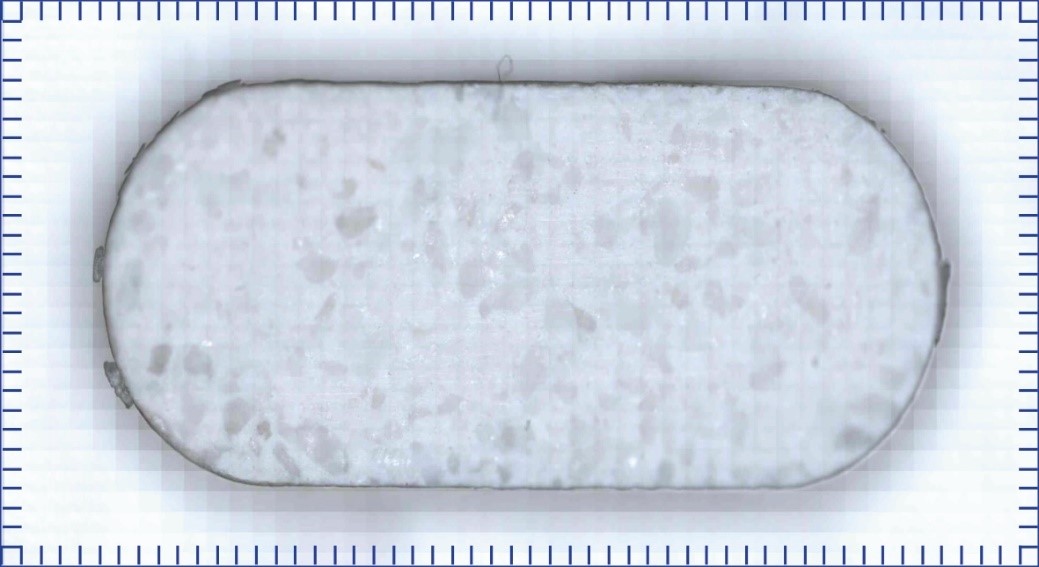
Figure 2. White light image of the tablet under investigation.
Using a 10x objective, the image has been composed of 1,650 (55 x 30) individual white light images automatically acquired and stitched together into one large image by Ramacle. The blue grid scale shows the frame size of the individual images.
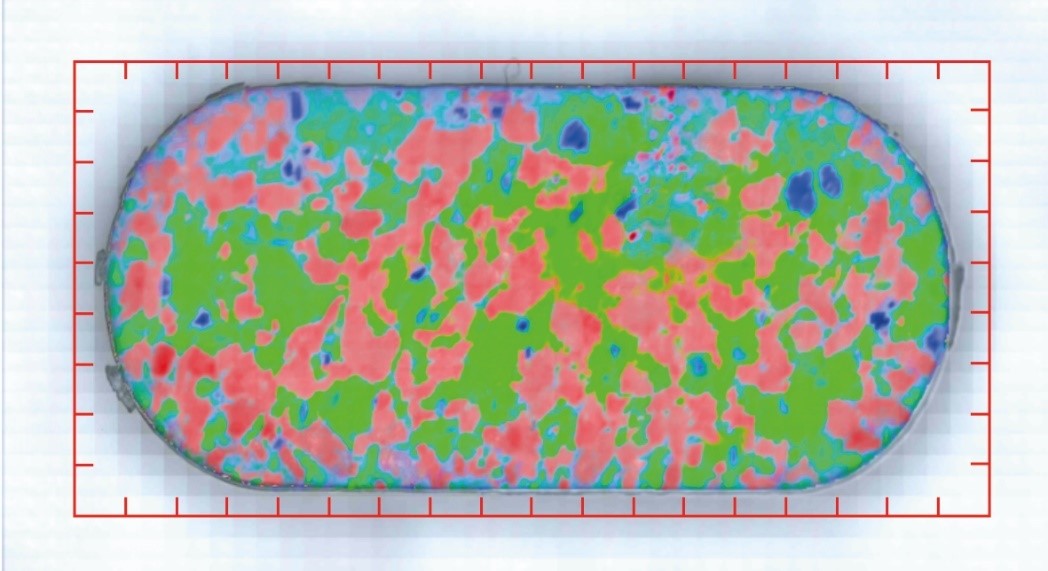
Figure 3. Raman map superimposed on the white light image.
Using the same 10x objective, 785 nm laser excitation, and a 50 µm pinhole, spectra were collected at 100 µm steps along the X and Y axes. This results in over 18,000 individual Raman acquisitions.
The matrix of spectra was then analysed and superimposed onto the white light image using Ramacle® software. The colours in the resulting map represent Aspirin (red), Caffeine (blue) and Paracetamol (green) demonstrated by their Raman spectra above. The red grid scale shows the area that was scanned for Raman with 1mm graduation.
RM5 Raman Microscope
Edinburgh Instruments’ RM5 Microscope generates Raman maps using a motorised stage for sample scanning, which permits finely controlled movement in the X, Y and Z directions. Line scans, plane maps and volume maps can be created.
The adjustable, truly confocal arrangement of the RM5 facilitates exceptional spatial resolution in all three dimensions.
Thanks to the superb sensitivity of the RM5, detailed maps based on high quality and highly resolved spectra can quickly be produced.
Raman Mapping
If you would like further information on how the RM5 Raman Microscope can be used to help you with your Raman mapping and research requirements, simply contact us.
If you have enjoyed this blog about Raman MappingMapping of Raman Spectra, sign up to our monthly eNewsletter below for further updates on our latest research, application notes and products.


