Welcome to Edinburgh Instruments monthly blog celebrating our work in Raman, Photoluminescence, and Fluorescence Lifetime Imaging. Every month we will highlight our pick for Map of the Month to show how our spectrometers can be used to reveal all the hidden secrets in your samples.

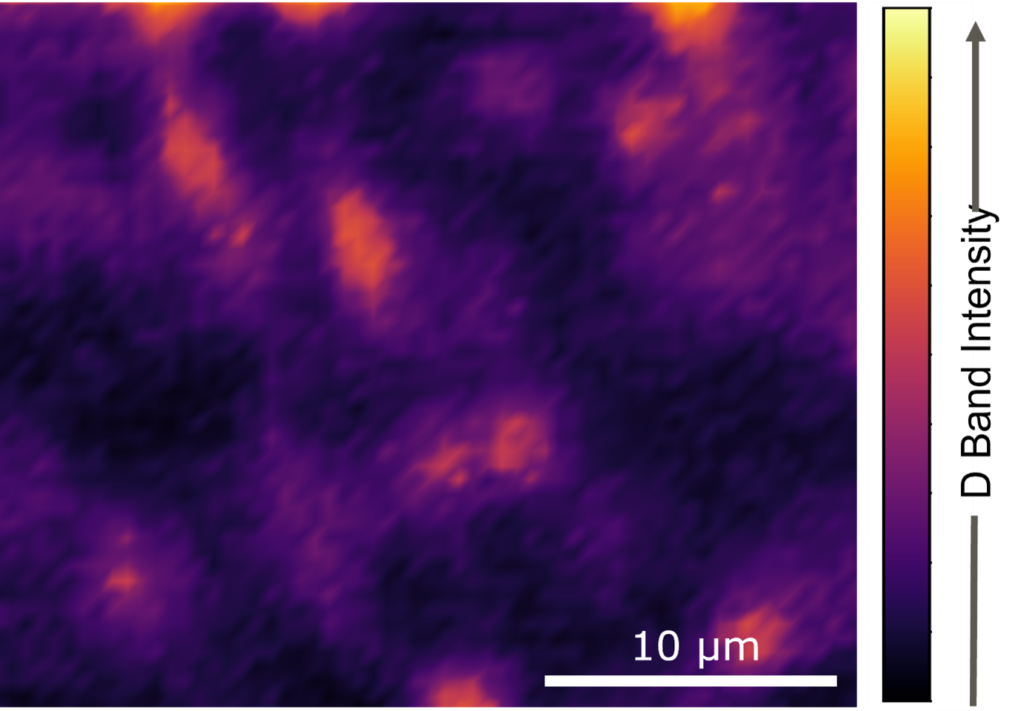
There are 3 main bands of interest in the Raman spectra of graphene, the G-band, the D-band, and the 2D-band. These bands are indicative of the number of layers of graphene present and the quality of the sample. Whilst the D-band and 2D-band will always be present, the D-band will only be seen for samples containing defects. Raman mapping graphene samples allows the visualisation of areas particularly high in defects. The truly confocal nature of the RM5 allows for high spatial resolution which is critical for graphene analysis. Defects can include broken bonds or the presence of sp3 bonded carbon. The image shows a Raman map taken using a 100x 0.9 N.A. objective with a 100 µm pinhole. From the Raman map acquired the intensity of the D-band can be plotted, producing the image which shows areas of the graphene film high in defects. Have a read of our application note to find out more about the D-band in graphene, as well as its G- and 2D-band.
The RM5 is a compact and fully automated Raman microscope for analytical and research purposes. The truly confocal design of the RM5 is unique to the market and offers uncompromised spectral resolution, spatial resolution, and sensitivity. To find out how it can help with your research, please contact us.