


Electroluminescence and Photoluminescence Spectroscopy of a Phosphorescent Organic Light Emitting Diode (PhOLED)
In this application note, emission properties of a phosphorescent organic light emitting diode (PhOLED) are investigated using an FS5 Spectrofluorometer equipped with the electroluminescence accessory. The spectrum and chromaticity coordinates of the PhOLED emission are measured and the triplet lifetime determined using time-resolved spectroscopy.
Our daily experience with organic (carbon based) materials such as polyethylene shopping bags and polyvinyl chloride insulation on cables suggests that they should be electrical insulators and this is indeed true for the majority of organic materials. However, there exists a small subset of organic materials with a particular electronic structure that are semiconducting in nature and can be used to make optoelectronic devices such as light emitting diodes.
The first organic light emitting diode with practical efficiency and brightness was demonstrated by Tang and Van Slyke working at Eastman Kodak in 1986.1 In the ensuing 30 years, OLEDs have been extensively optimised and today OLEDs are found in high end smartphone and televisions displays due to their superior display performance compared to LCDs. A schematic of a typical organic light emitting diode structure is shown in Figure 1a. Electrons and holes are injected into the organic electron and hole transport layers, recombine in the central doped emission layer and the energy is then transferred via resonant transfer to a dopant molecule. The choice of dopant molecule controls the colour of the organic light emitting diode emission and is typically a small molecule with high photoluminescence quantum yield.
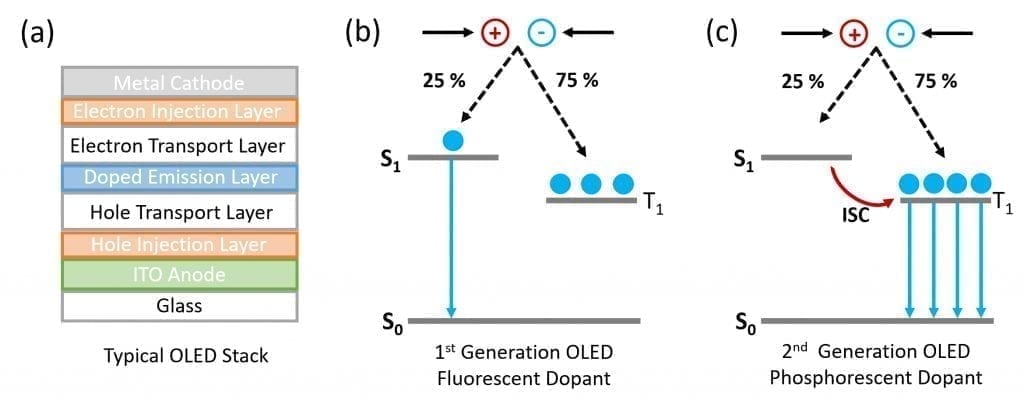
Figure 1: Schematic of (a) layers in a typical bottom emitting OLED stack and mechanism of emission in (b) fluorescent doped OLEDs and (c) phosphorescent doped OLEDs.
In first generation OLEDs the dopant molecule was purely organic and the light was emitted through fluorescence. However, due to spin statistics 75% of the excitons generated when electrons and holes recombine in the organic light emitting diode are in the non-emissive triplet state (T1) and the maximum efficiency of the OLED is therefore fundamentally limited to 25% (Figure 1b). The solution to this problem is to move away from pure organic molecules towards organic molecules that incorporate heavy metals such as Iridium. The use of heavy metals increases the spin-orbit coupling between the exciton spin angular momentum and the orbital angular momentum and the triplet state becomes emissive (Figure 1c) which is called a phosphorescent organic light emitting diode or PhOLED.
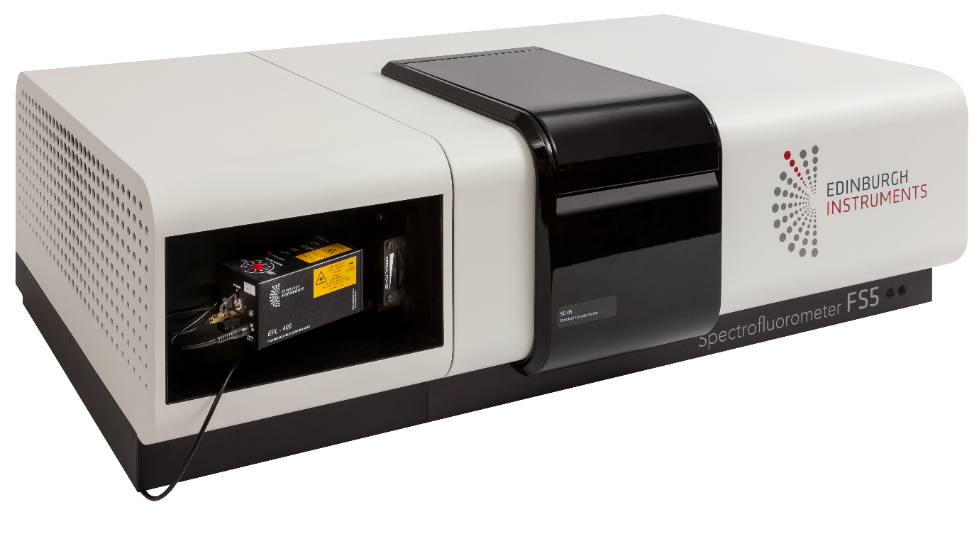
Figure 2: FS5 Spectrofluorometer which can be equipped with a range of light sources, source meters, and function generators for steady state and time-resolved photoluminescence and electroluminescence spectroscopy.
The red and green OLEDs used in modern smartphone and television displays are high efficiency second generation PhOLEDs but a stable high efficiency blue phosphorescent dopant emitter has yet to be found and further research will be required to achieve this goal. Development and characterisation of new organic light emitting diode materials and structures requires both photoluminescence spectroscopy of the individual components and electroluminescence characterisation of the completed device. In this application note the dual functionality of the FS5 Spectrofluorometer for organic light emitting diode characterisation is demonstrated through the investigation of the emission properties of a PhOLED doped with the Iridium based emitter Ir(MDQ)2(acac) using steady state and time-resolved electroluminescence and photoluminescence spectroscopy.
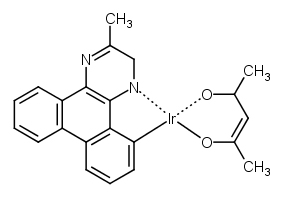
Figure 3: Chemical structure of the phosphorescent emitter Ir(MDQ)2(acac).2
Materials & Methods
A phosphorescent organic light emitting diode was fabricated via vacuum sublimation using Ir(MDQ)2(acac) as the dopant and encapsulated with a glass coverslip and optical epoxy to prevent degradation. Electroluminescence and photoluminescence measurements were undertaken using an FS5 Spectrofluorometer equipped with a PMT-900 detector, phosphorescence lifetime electronics based on single photon counting multichannel scaling (MCS) and an arbitrary function generator (AFG) for steady state and time-resolved electroluminescence. Steady state electroluminescence spectra were measured using the DC offset of the AFG to apply a bias to the OLED. For time-resolved electroluminescence the AFG applied a train of short voltage pulses to the OLED and the decay measured using MCS. For photoluminescence measurements a Xenon lamp was used for steady state spectra and a 445 nm pulsed diode laser with variable pulse width (VPL-445) for time-resolved decays.
Results & Discussion
The electroluminescence spectrum of the organic light emitting diode was measured at a current density of 10 mA cm-2 and is shown in Figure 4. The OLED has a peak emission wavelength at 616 nm resulting in a bright orange emission as seen in the figure inset. The chromaticity coordinates of the emission were calculated to be 0.63, 0.37 in CIE 1931 colour space using the built-in chromaticity wizard of the FS5’s Fluoracle® operating software.
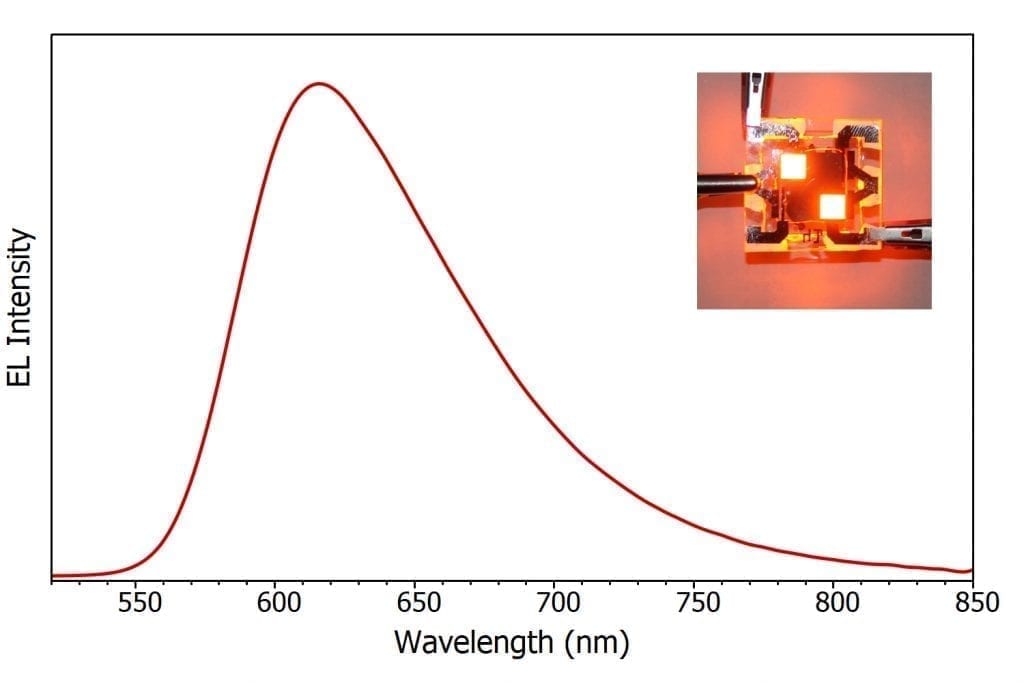
Figure 4: Electroluminescence spectrum of the OLED at a current density of 10 mA cm-2. Inset: image of the working OLED with two pixels illuminated.
The influence of charge carrier density on the electroluminescence spectrum was investigated by measuring electroluminescence spectra across four decades of current density as shown in Figure 5. At the lowest current density (blue) there is a pronounced shoulder at 675 nm. Since the shoulder feature is at a longer wavelength it must arise from states that are lower in energy than the primary emission peak. At low current densities the energetically low lying states will be preferentially populated and the emission from the shoulder feature is therefore pronounced. As the current density increases the low lying states become completely filled and any additional charge carriers instead populate the higher energy states which results in the relative intensity of the shoulder feature decreasing with increasing current density which can be seen in Figure 5.
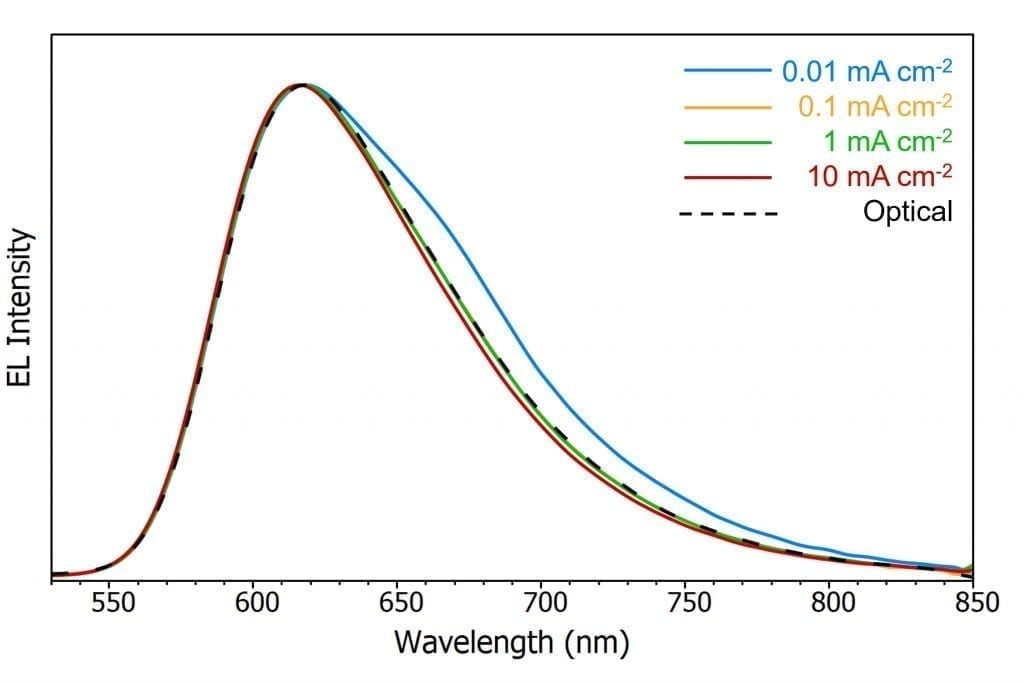
Figure 5: Variation of the electroluminescence spectrum of the OLED with current density and comparison to the optically excited photoluminescence spectrum.
The organic light emitting diode was also optically excited at 450 nm in order to measure the photoluminescence spectrum which is shown by the dashed black line. It can be seen that the photoluminescence spectrum matches perfectly with the electroluminescence spectra at current densities of 0.1 mA cm-2 and 1 mA cm-2. This demonstrates that the excited state responsible for the photoluminescence emission is the same one that is accessed electrically and suggests that the number of charge carrier density during optical excitation is equivalent to the carrier density when the organic light emitting diode is driven at current densities in the ~ 0.1 mA cm-2 to 1 mA cm-2 range.
The lifetime of the emissive excited state in the organic light emitting diode is an important parameter for investigating loss processes in the OLED such as triplet-triplet annihilation and triplet-polaron quenching. The excited state lifetime of the OLED was therefore measured using time-resolved electroluminescence and photoluminescence spectroscopy. The electroluminescence decay following a 4V 1 μs voltage pulse is shown in Figure 6a and was fit using a monoexponential decay using Fluoracle to reveal a lifetime of 989 ns. It is clear from the long lifetime that this is phosphorescence and corresponds to the lifetime of the triplet state of Ir(MDQ)2(acac) dopant. It can be seen that emission wholly arises from the triplet state with no prompt emission from the singlet state observable. This measurement was then repeated with optical excitation using a 100 ns width pulse from a pulsed diode laser. The photoluminescence decay is highly similar to the electroluminescence with a monoexponential fit revealing a near identical triplet lifetime of 991 ns.
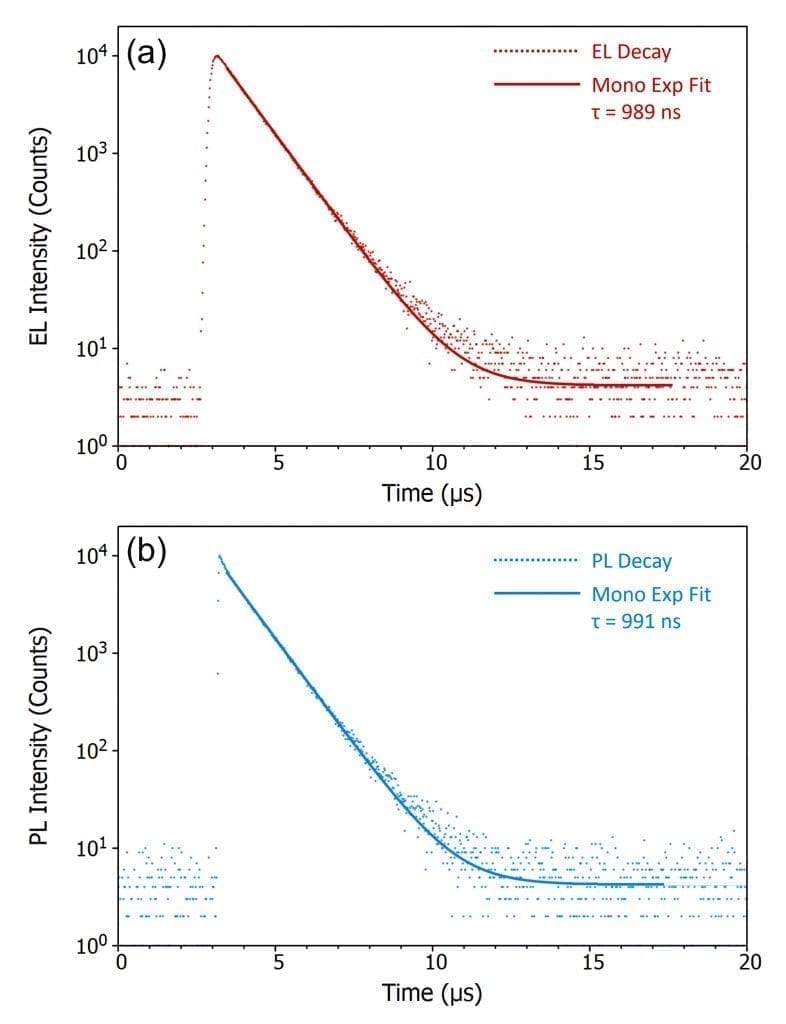
Figure 6: Measurement of the triplet lifetime of Ir(MDQ)2(acac) using (a) time-resolved electroluminescence and (b) time-resolved photoluminescence spectroscopy. Lifetimes were fit with monoexponential decays using Fluoracle. Electrical excitation: 1 μs 4V voltage pulses with a repetition rate of 10 kHz applied to the OLED using an AFG. Optical excitation: 445 nm 100 ns pulses with a repetition rate of 10 kHz from a VPL-445 pulsed diode laser. Decays were measured using MCS.
Conclusion
The properties of a phosphorescent light emitting diode were investigated using electroluminescence and photoluminescence spectroscopy. The emission spectrum of the OLED was measured showing a peak emission wavelength at 616 nm and chromaticity coordinates of 0.63, 0.37 in CIE 1931 colour space. The lifetime of the triplet state in the OLED was measured to be 990 ns using time-resolved electroluminescence and photoluminescence. This application note demonstrates how the functionality of the FS5 Spectrofluorometer can be extended to electrical device characterisation and offers a complete spectroscopic solution for OLED research and development.
References
Acknowledgements
Thanks to Dr. Kou Youshida and Prof. Ifor Samuel of the Organic Semiconductor Optoelectronics research group at the University of St Andrews for fabricating the OLED used in this application note.
