


Polarised Raman Spectroscopy
For certain molecules and samples, ‘normal’ Raman spectroscopic data can be enhanced by controlling the polarisation of light exciting the sample, and of light scattering from it. Analysis of Raman spectra gathered using this technique can provide information about the molecular structure of a sample, including the symmetry of its vibrational modes, as well as information about highly-ordered samples, such as crystals, polymers, and carbon materials.
The RM5 Raman Microscope can be equipped with fully computer-controlled polarisation optics to allow the user to easily collect and analyse spectra and maps in multiple polarised configurations. This data can be gathered from features <1 µm, thanks to the truly confocal pinhole in the RM5.
This technical note will introduce some basic theory about polarisation of light and polarised Raman spectroscopy, before demonstrating different types of samples the RM5 can analyse using this technique.
What is Polarisation of Light?
In classical physics, light is thought of as a wave containing electric and magnetic fields. Each electromagnetic wave is composed of both an electric field and a magnetic field, which are perpendicular to each other. To simplify, consider only the electric field (EF) component: Unpolarised light consists of waves whose EFs are oriented in all different directions relative to each other (Figure 1.). Linearly polarised light consists of waves whose EFs are aligned in a single plane along the direction of travel of light. Circularly polarised light consists of waves with two EF components that are perpendicular to each other, with equal amplitudes, but have a phase difference of π/2. Elliptically polarised light consists of waves with two EF components that are perpendicular to each other, but with unequal amplitude and phase difference.
It is possible to modify these different types of light to benefit experimental use. For example, there are some materials that only allow electromagnetic waves of a specific orientation to pass through. These materials are called polarisers, and they can be used to produce different types of polarised light.
In the RM5, a half wave-plate is used to change the polarisation direction of linearly polarised light, and a quarter wave-plate is used to convert linearly polarised light into circularly polarised light.
What is Polarised Raman?
The positions of peaks in Raman spectra can be assigned to the molecular vibrations within the molecule(s) comprising the sample under analysis. While Raman spectroscopy under standard conditions tells us about the chemical composition of a sample, polarised Raman spectroscopy can provide further information, such as the symmetry of vibrational modes, and the orientation of the sample.
This information acquired using polarised Raman spectroscopy is valuable in many different industries, for example:
- electronics and optics, by determining orientations of components
- nanomaterials, by measuring alignment of single-walled carbon nanotubes
- crystallography, by assessing crystal structure
- polymers, by revealing locations of stress
- biology, by characterising the isotropic and anisotropic vibrational responses in noncancerous and cancerous human breast tissues
- theoretical studies, by providing experimental evidence and values for vibrational modes
To help understand the concepts, hardware, and notation used in polarised Raman spectroscopy, it is useful to consider two different types of samples – isotropic and anisotropic.
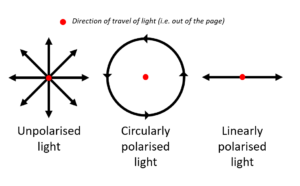
Figure 1: Types of polarisation of light (note: linearly and circularly polarised light can be thought of as special cases of elliptically polarised light)
Isotropic samples (randomly oriented samples, e.g. liquids, microcrystalline powders)
Raman scattered light comprises a combination of light with a polarisation parallel to that of the excitation light, and with a polarisation perpendicular to it. During standard Raman measurements, both of these components are measured in the same spectrum. In contrast, during polarised Raman measurements, polarising filters are used to measure the Raman spectra of each component separately.
Anisotropic samples (directionally oriented samples, e.g. crystal lattices, polymers)
In these samples, the molecules are in fixed positions, which means the bonds within them can be moved into a specific alignment with regard to the excitation polarisation. The Raman peaks and their intensity varies depending on this alignment, resulting in quite different spectra which provide useful information about the sample.
Depolarisation Ratio
For a particular peak, taking a ratio of its perpendicular intensity, against its parallel intensity, gives us the “depolarisation ratio” (ρ).
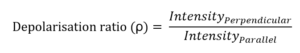
The depolarisation ratio provides information about the symmetry of the molecule, and the vibrational mode represented by that Raman peak.
It is known that for a totally symmetric vibrational mode, ρ is less than 0.75. This is called a polarised band. If ρ is greater than or equal to 0.75, then the band is called a de‑polarised band (i.e. not totally symmetric).
This information can be used to help identify vibrational modes and the structure and identity of samples.
Porto Notation
« Porto notation” is used to record polarisation conditions in a standardised manner, so that multiple sets of data can be compared accurately. Porto notation takes the following form:
A (B C) D
Where:
A is the excitation (laser) propagation direction,
B is the excitation (laser) polarisation direction,
C is the scattering (Raman) polarisation direction,
D is the scattering (Raman) propagation direction.
Figure 2. shows an example of an experimental setup and the corresponding Porto Notation, where the scattering propagation direction indicates a 180° back-scattering configuration (as is used in the RM5).
Since the Raman spectrum from an isotropic sample is not dependent on the sample orientation, two different polarised measurements can be made, with the relationship between Excitation Polarisation Direction and Scattering Polarisation Direction as follows:
Parallel,
Perpendicular, as shown in Figure 2.
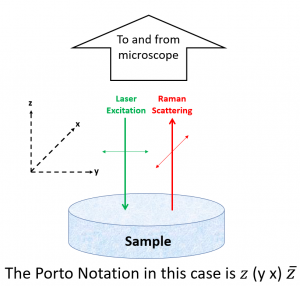
Figure 2: Porto Notation example
When working with anisotropic samples, it is necessary to make a record of how the sample is oriented in comparison to the stage / microscope. For example, this could be done by using the coordinate system from the stage, or sample (e.g. crystal structure),or if unknown then capturing a white light image of the sample. Looking at the experimental setup in Figure 2., there are four different excitation and scattering polarisation combinations possible:

Experimental and Results
To show how these techniques are applied in practice, measurements of isotropic and anisotropic samples follow. All experimental data shown was collected using the RM5 Raman Microscope (Figure 3.), fully equipped with automated polarisation turrets, easily controlled by the Ramacle software. A 532 nm excitation laser was used with a 20x air objective, and an 1800 gr/mm grating. A half wave-plate was used to change the polarisation direction of linearly polarised light. 400 µL of cyclohexane was added to a well in a 96 well plate, and the lithium niobate was mounted on a microscope slide.
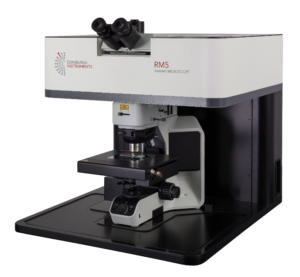
Figure 3: The RM5 Raman Microscope
Isotropic sample – Cyclohexane
In the following spectrum it is observed that vibrational modes which are totally symmetric show the largest variations in intensity between parallel and perpendicular configurations.
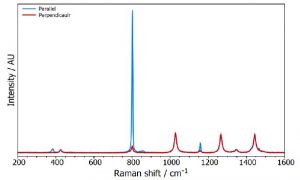
Figure 4: Cyclohexane polarised Raman spectra (532 nm, 1800 gr/mm)
The spectrum of cyclohexane (Figure 4.) contains a mixture of peaks that are both polarised and de-polarised.
Polarised peaks (ρ<0.75) can be seen at 383, 801, and 1157 cm-1 and come from totally symmetric modes. For example, the most intense peak in the spectrum, at 801 cm-1 arises from the CH2 deformation and ring modes.
De-polarised peaks (ρ≥0.75) can be seen at 425, 1028, 1266, 1345, and 1444 cm-1 and come from modes that are not totally symmetric. For example, the peak at 1444 cm-1 arises from the CH2 scissor mode.
Anisotropic samples – Lithium niobate
In the following spectra we will observe that the orientation between the crystal and the Raman spectrometer is important to consider and detail using Porto Notation.
Lithium niobate is a uniaxial ferroelectric material. It’s properties, such as large nonlinear optical coefficients, make it technologically important, especially in (nonlinear) optical applications.
The sample used here was cut down the crystal X-axis face, and this face placed perpendicular to the direction of the incident laser (parallel to the surface of the stage). This can be seen in Figure 5., as well as the orientation of the Y- and Z- axes.
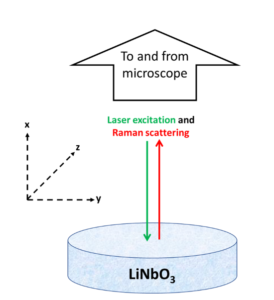
Figure 5: Lithium niobate sample orientation example
Using Figure 5. we can also obtain the Porto notation for the configuration of the Raman instrument used for each spectral measurement.
Figure 6. shows the lithium niobate spectra acquired using four different polarisation configurations. It can be seen that the modes present, as well as their intensity and position, varies significantly between the spectra. Compare this to the previous isotropic liquid sample in which peak intensity was the main variable between different polarisation configurations.
Comparing the information contained in the polarised spectra from an anisotropic sample can help to identify the material and its crystal structure and orientation.
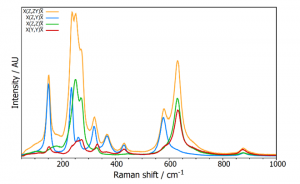
Figure 6: Lithium niobate polarised Raman spectra (532 nm, 1800 gr/mm)
Conclusion
In this technical note we demonstrated how polarisation of light can provide useful information which isn’t present in standard Raman spectroscopic studies. We discussed the depolarisation ratio and how it provides information about the symmetry of vibrational modes, and we discussed Porto notation and its use in recording the relationship between spectra, and orientation of the sample, instrumentation and light. For both isotropic (the liquid cyclohexane) and anisotropic (the crystal lithium niobate) samples, we demonstrated how to set up a polarised Raman experiment in the RM5 Raman Microscope, and analyse the resultant spectra.
