


Plastics Identification Using ATR-FTIR Spectroscopy
Introduction
Plastics are among the most used products worldwide, with global plastics production in 2020 estimated to be 367 million metric tons.1 Plastics are incredibly versatile due to their low-cost production, durability, lightweight, and design freedom. As such, they can be found in almost every sector. Their wide range of applications spans from the food industry (for packaging) to the electrical and electronics sector (for insulation) and the construction industry for sealing, cladding, etc.
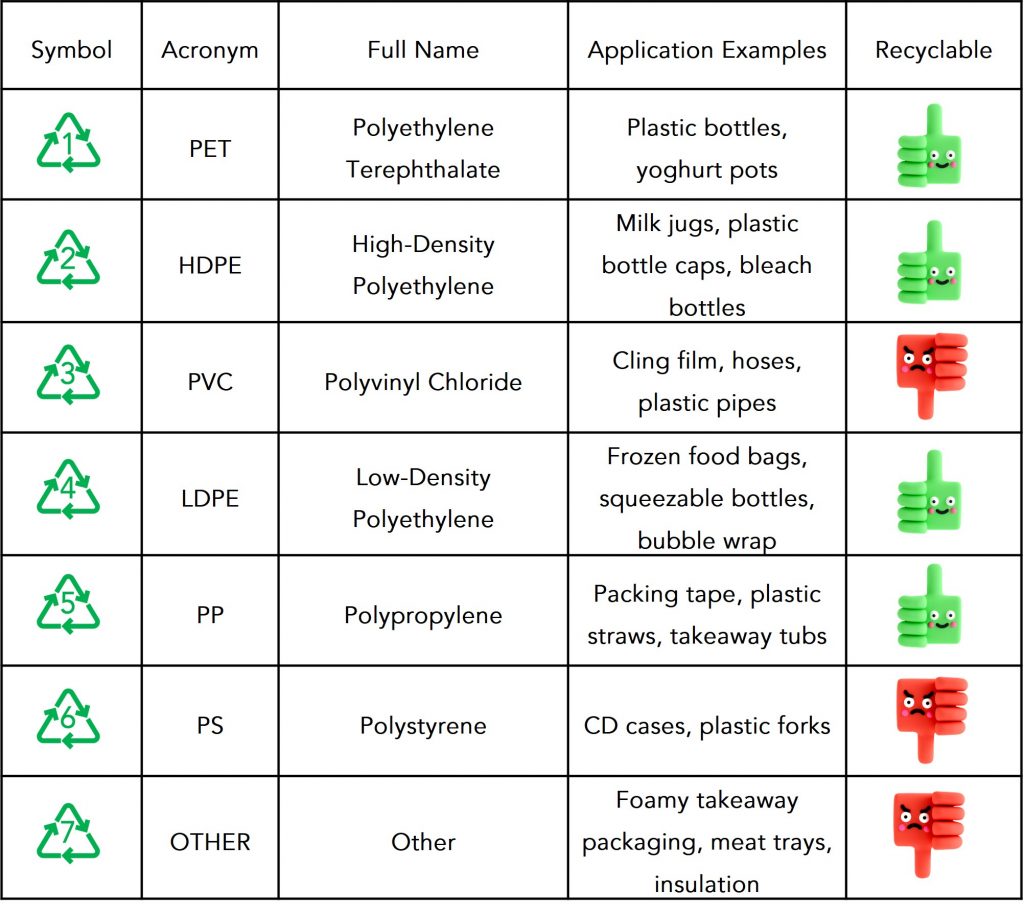
However, the massive production of plastics has led to a throw-away culture rendering plastic pollution one of the most ubiquitous environmental issues. One solution to prevent plastic pollution is improving waste management systems and recycling. As such, separating plastics based on their type is essential to ensure their suitable disposal and reuse. To facilitate plastics separation, the Society of the Plastics Industry introduced the Plastics Identification Code (PIC), which can usually be seen on the surface of plastics. Table 1 shows the PIC symbol with the acronym, full name, and application examples. When a PIC identifier is absent, spectroscopic techniques, such as Fourier Transform Infrared Spectroscopy (FTIR), can quickly identify and sort plastics for recycling.
Table 1 PIC symbol for plastics with their acronyms, full names and application examples.2
FTIR is a powerful qualitative and quantitative analysis tool. When a plastic absorbs IR radiation, the resulting signal is a spectrum that represents its molecular “fingerprint”. Different plastic samples produce different fingerprints that enable plastic identification. In this application note, an Edinburgh Instruments IR5 FTIR Spectrometer equipped with an Attenuated Total Reflection (ATR) accessory was used to identify different plastics.
Materials and Methods
Four plastic samples were analysed: a biodegradable bag, a plant-based bag for electronics packaging, a soft drink bottle, and a juice bottle. The four types were cut to roughly 2×2 cm2 in size. The samples were analysed using an Edinburgh Instruments IR5 FTIR Spectrometer equipped with an ATR accessory with a ZnSe crystal. The ATR accessory requires minimal to no sample preparation and enables the acquisition of reliable and high-quality spectra. To obtain a spectrum, the clamping arm of the ATR accessory applies pressure on the sample, ensuring consistent contact between the crystal and the sample. The plastics were identified from their IR spectra using the KnowItAll® spectral library.
Figure 1 Edinburgh Instruments IR5 FTIR Spectrometer.
Results and Discussion
Spectra of the four plastics were acquired with a resolution of 4 cm-1 averaging 5 scans with a total acquisition time of around 15 seconds for each spectrum. The spectral library identified the biodegradable bag sample (Figure 2) as high-density polyethylene (HDPE) with a 94% match. HDPE is a “pure” form of PE whose polymer chains are absent of methyl (CH3) side chains, containing only CH2 groups. In such a way, the polymer chains can be packed closer together, resulting in a denser material. The band at 1465 cm-1 is an HDPE’s characteristic peak. The bands at 2915 cm-1, 2848 cm-1, and 719 cm-1 correspond to the methylene (CH2) group vibrations attributed to the asymmetric C-H stretch, the symmetric C-H stretch, and the rocking mode, respectively.3–5 From Table 1, it is seen that the HDPE sample is a PIC 2 material and recyclable.
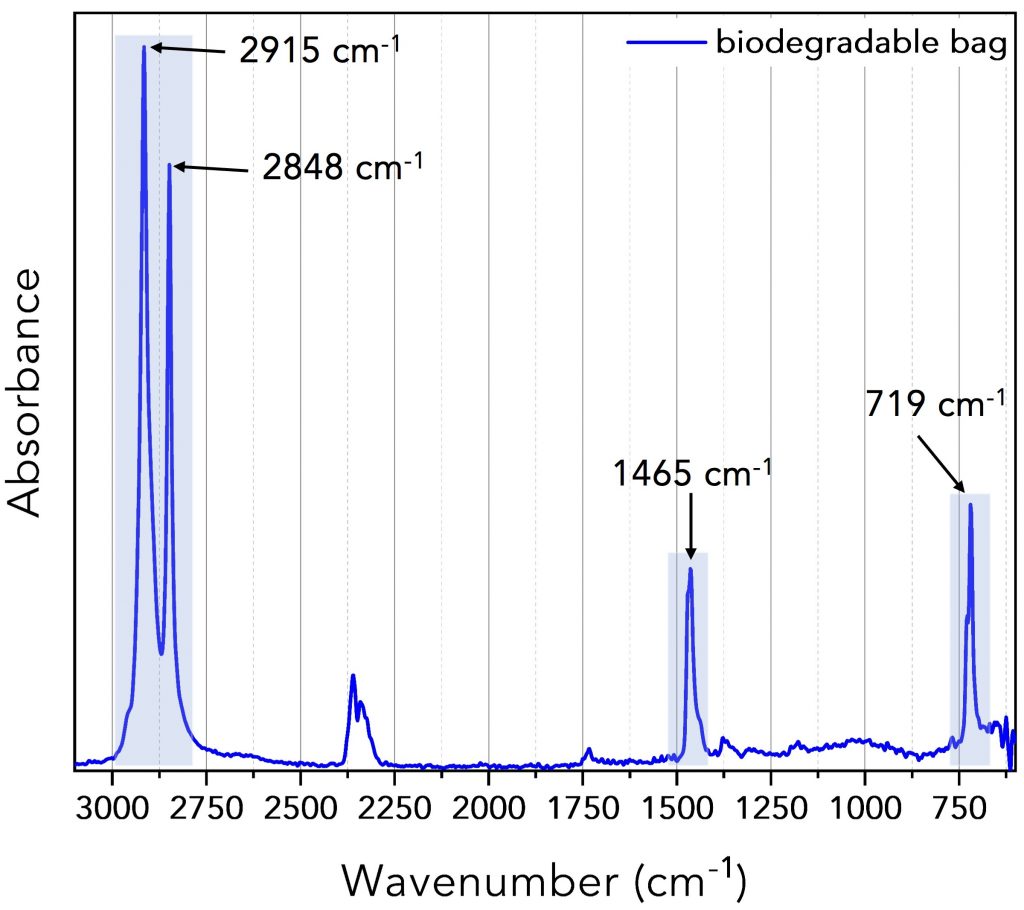
Figure 2 IR spectrum of the biodegradable bag sample.
The IR spectrum of the plant-based bag for electronics packaging is shown in Figure 3. Matching with the spectral database showed that the bag’s main compound was polybutylene terephthalate (PBT). PBT is a thermoplastic polyester similar in composition and properties to PET. It tends to crystalise faster than PET, and its applications include packaging and industrial-scale moulding in the automotive and electrical markets. The absorption bands between 3000 cm-1 – 2800 cm-1 are attributed to the O-H stretching vibration, and the narrower peaks at 1711 cm-1 and 728 cm-1 are assigned to the C=O stretching and C-H vibrations, respectively.
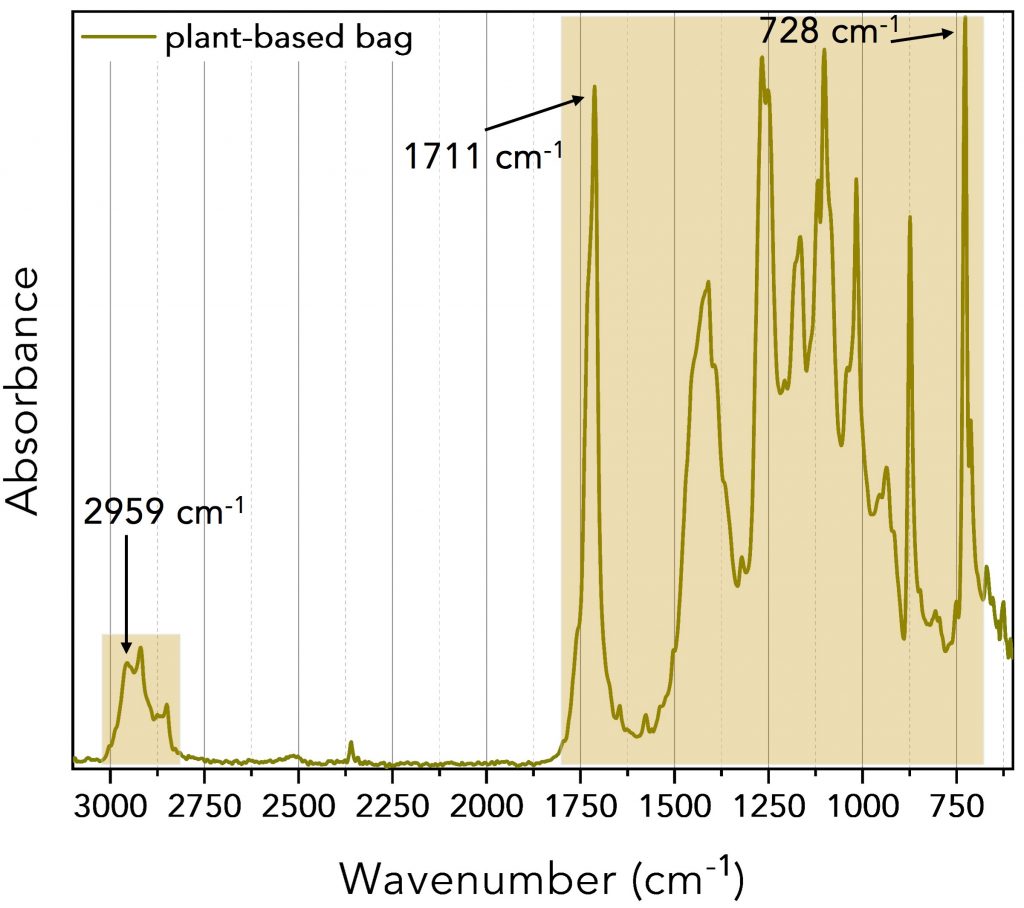
Figure 3 IR spectrum of the plant-based bag sample.
The IR spectra of the soft drink and the juice bottles can be seen in Figure 4. Both samples were identified as PET (PIC1 and safely recyclable), with a 77% spectral match for the juice bottle sample and an 85% match for the soft drink bottle sample. Characteristic PET bands that the IR5 resolved were at 1713 cm-1 due to the C=O stretch, 1241 cm-1 and 1094 cm-1 due to the C-O stretch, and 723 cm-1 attributed to the aromatic C-H out-of-plane bend.6
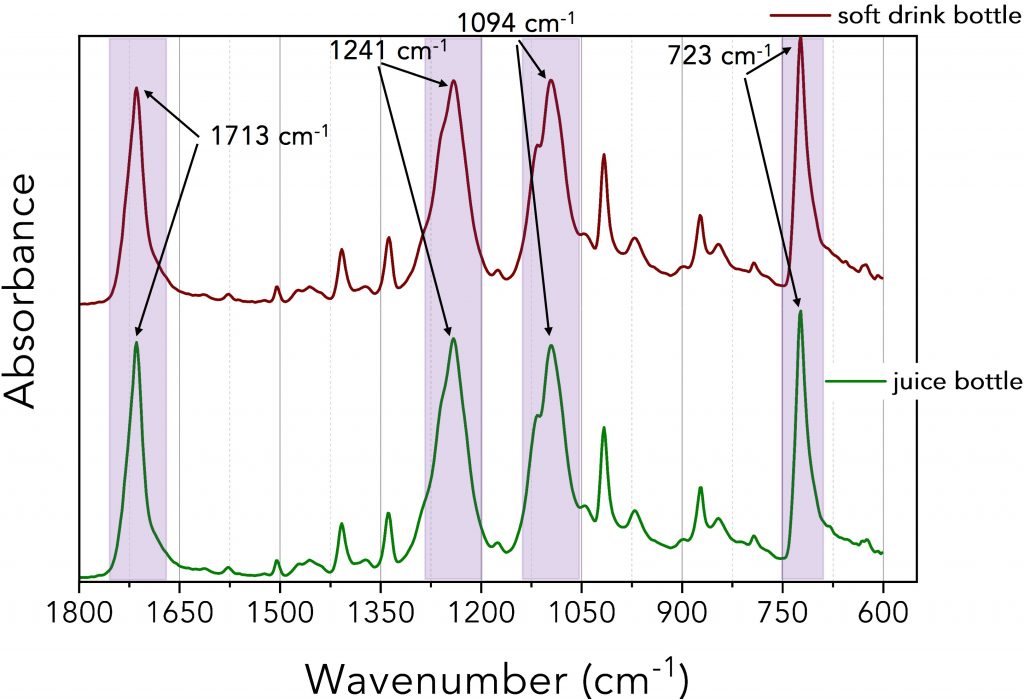
Figure 4 IR spectra of the soft drink and juice bottle samples.
Conclusion
The efficient and proper disposal and recycling of plastics are crucial for a cleaner and greener planet. ATR-FTIR is a simple technique that efficiently discriminates plastics based on their characteristic IR spectrum. An Edinburgh Instruments IR5 FTIR Spectrometer was used to rapidly identify four plastic samples that produced IR spectra of high quality.
References
- EU plastics production and demand – first estimates for 2020 • Plastics Europe.
- Plastic Recycling & Resin Identification Codes | Maxpack.
- C. Smith, Electromagnetic radiation, spectral units, and alkanes. Spectrosc. (Santa Monica) 30, (2015).
- C. Smith, The Infrared Spectra of Polymers II: Polyethylene. Spectroscopy 24–29 (2021) doi: 10.56530/spectroscopy.xp7081p7.
- C. Smith, The infrared spectra of polymers, part I: Introduction. Spectrosc. (Santa Monica) 36, 17–22 (2021).
- R. Jung et al., Validation of ATR FT-IR to identify polymers of plastic marine debris, including those ingested by marine organisms. Mar. Pollut. Bull. 127, 704–716 (2018).
