


Characterisation of SERRS Nanoparticles Using UV-Vis and Raman Spectroscopy
Introduction
Surface-enhanced resonance Raman scattering (SERRS) is a technique that offers unparalleled sensitivity and specificity in non-destructive spectroscopic detection.1 It is a combination of surface-enhanced Raman scattering (SERS) and resonance Raman spectroscopy (RRS), two techniques that are individually used to overcome the inherent weakness of Raman scattering.
SERRS occurs when an analyte, with an electronic transition frequency matching that of the excitation laser, is adsorbed on or near a roughened metal surface, such as that of a noble metal nanoparticle (NP), Figure 1. The theoretical Raman signal enhancements achievable using SERRS are orders of magnitude greater than SERS and RRS alone, meaning that analytes of interest can be detected at very low concentrations.2 The technique is becoming increasingly popular in the fields of medical diagnostics and food science and is applied primarily via labelling methods that couple resonant Raman reporters with bioconjugation moieties using optically tuneable nanoparticles. Such labelling methods can be applied to the detection of biomarkers in immunoassays, microfluidic devices, and lateral flow testing, and when coupled with Raman microscopy, they can be utilised in the tracking of novel drugs or biomarkers in mammalian cells.
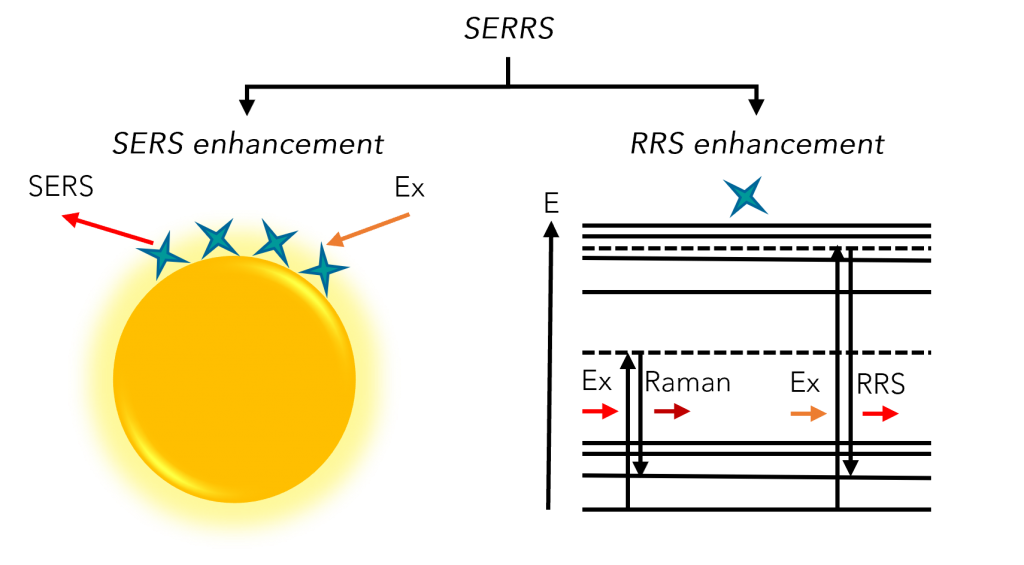
Figure 1. Schematic showing how SERS and RRS enhancements both contribute to the SERRS effect.
To optimise SERRS-active nanoparticle sensors in various types of bioanalytical assays, it is imperative to understand the optical properties of the NPs and the electronic transition frequency of adsorbed reporter molecules. These factors can then be related to the Raman intensity produced. This understanding can be achieved by using UV-Vis spectroscopy and Raman spectroscopy in tandem. In this Application Note, UV-Vis spectroscopy is first used to examine the optical properties of a sample of gold NPs (AuNPs) and Malachite Green (MG), a popular resonant Raman reporter molecule. Then, the enhanced sensitivity of SERRS over RRS and SERS is demonstrated through the Raman analysis of AuNPs functionalised with MG.3
Materials and Methods
UV-Vis and Raman spectroscopic measurements were performed on Edinburgh Instruments DS5 Dual Beam UV-Vis Spectrophotometer and RM5 Raman Microscope, Figure 2. Spherical gold nanoparticle colloid solutions were purchased from BBI Solutions, and Malachite Green oxalate salt solution was purchased from Sigma Aldrich. Subsequent dilutions for both AuNPs and the MG solution were performed in distilled water. For UV-Vis absorption measurements, a 1.5 mL aliquot of the analyte was placed in a cuvette in the sample light path and water was placed in a cuvette in the reference light path. For Raman measurements, the objective turret of an RM5 Raman Microscope was equipped with a cuvette holder that allowed for the liquid samples to be measured under 638 nm and 785 nm excitation.
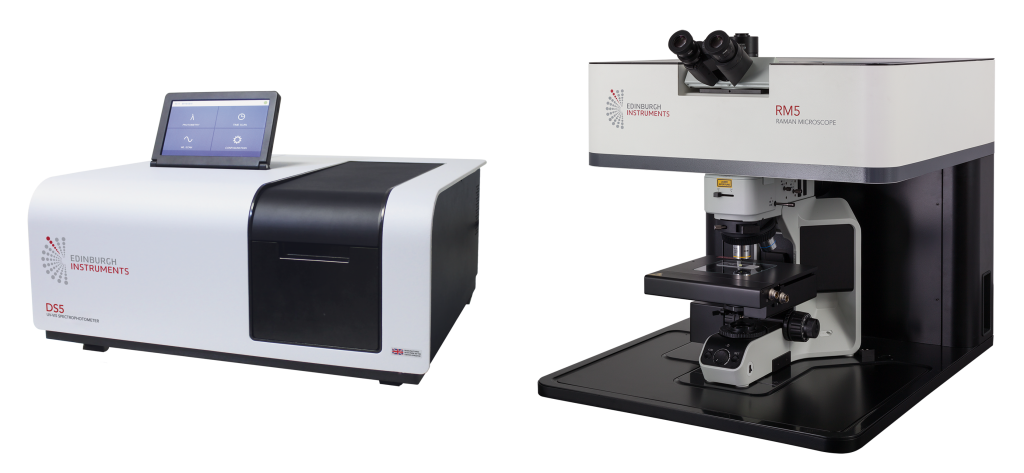
Figure 2. Edinburgh Instruments DS5 Dual Beam UV-Vis Spectrophotometer (left) and RM5 Raman Microscope (right).
UV-Vis Analysis of SERRS Nanoparticles
When metallic NPs interact with light, the free electrons at the surface of the NP are displaced and undergo a collective oscillation, the frequency of which is referred to as the localised surface plasmon resonance (LSPR). The LSPR creates a highly localised electric field at the interface between the particle surface and the surrounding dielectric medium, which is important for SERS because this electric field can enhance the polarizability of molecules close to the surface of the NP, thereby increasing their Raman scattering cross-sections. The LSPR is also a useful parameter within itself for biosensing because it depends on several factors such as NP size, NP morphology, interparticle distance, and the refractive index of the surrounding medium, which can all be engineered to change in response to a particular variable in a detection assay.4
Firstly, the LSPR of a 50 nm AuNP sample was characterised using UV-Vis spectroscopy, Figure 3A. Spherical AuNPs are easily identifiable in UV-Vis spectroscopy because they exhibit a sharp LSPR absorption band with a λmax normally between 500 nm and 600 nm, and in the sample measured the LSPR occurred at 534 nm. To make the AuNPs SERRS active, they were functionalised with the commercially available molecule MG. When MG is adsorbed onto the surface of a AuNP and excited using a 638 nm laser, it produces a very intense Raman spectrum. This is because MG has a large absorption band with a λmax at 617 nm that overlaps with the wavelength of the laser and can be observed in its absorption spectrum, Figure 3B. This means that the Raman scatter produced from the molecule, in the absence of AuNPs, is a result of RRS. When the molecule is then adsorbed onto the surface of a AuNP and interrogated with a 638 nm laser, the Raman scatter produced is a combination of RRS and SERS, i.e., SERRS.
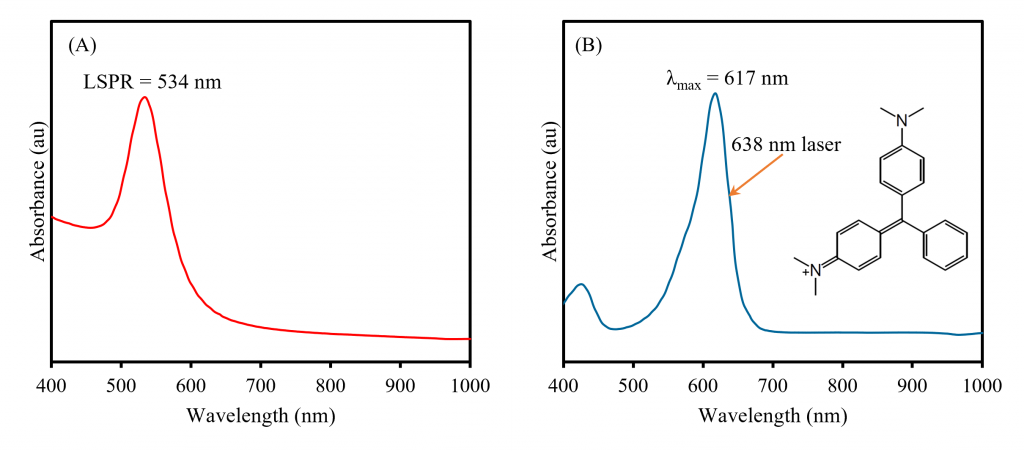
Figure 3. A) UV-Vis absorption spectra of (A) bare 50 nm AuNPs and (B) MG. The chemical structure of MG is shown in (B).
Raman Analysis of SERRS Nanoparticles
The SERRS active, MG functionalised AuNPs were analysed using Raman spectroscopy to demonstrate the enhancements that SERRS offers over RRS and SERS alone. Firstly, to ensure that the Raman spectrum produced was indeed attributable to MG, the major bands from the 638 nm spectrum of the MG functionalised AuNP sample were assigned, Figure 4. The three largest intensity bands occur at 1174 cm-1, 1369 cm-1, and 1616 cm-1, and can be assigned to in-plane ring C-H vibrations, N-phenyl stretching, and ring C-C stretching from the MG molecules, respectively.5
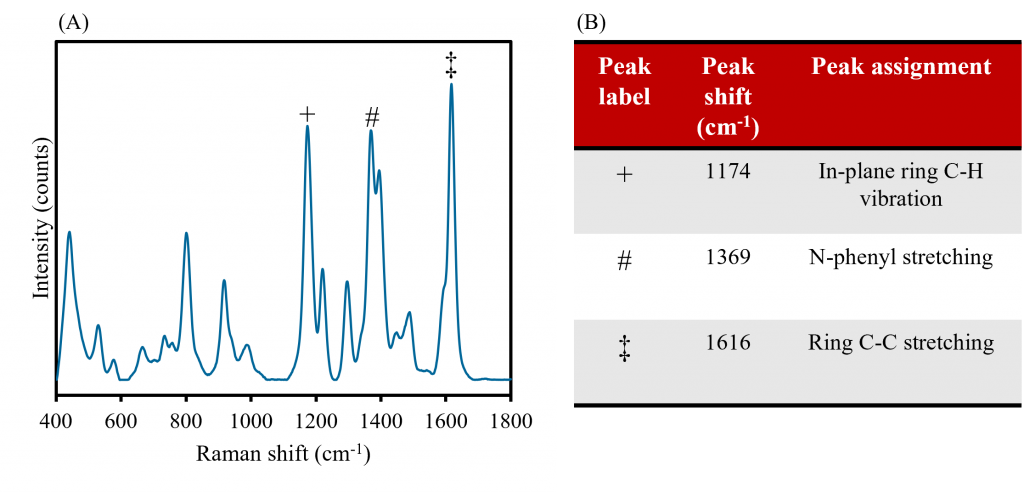
Figure 4. A) Raman analysis of MG functionalised AuNPs and B) corresponding major band assignments.
The enhancement offered by SERRS was then compared with RRS by measuring the response of MG functionalised AuNPs against an equivalent concentration of MG dissolved in water with a 638 nm laser, Figure 5. The resulting spectra in the stack plot indicate that the SERRS response, determined by the Raman intensity of characteristic MG peaks, is significantly greater than the RRS response.
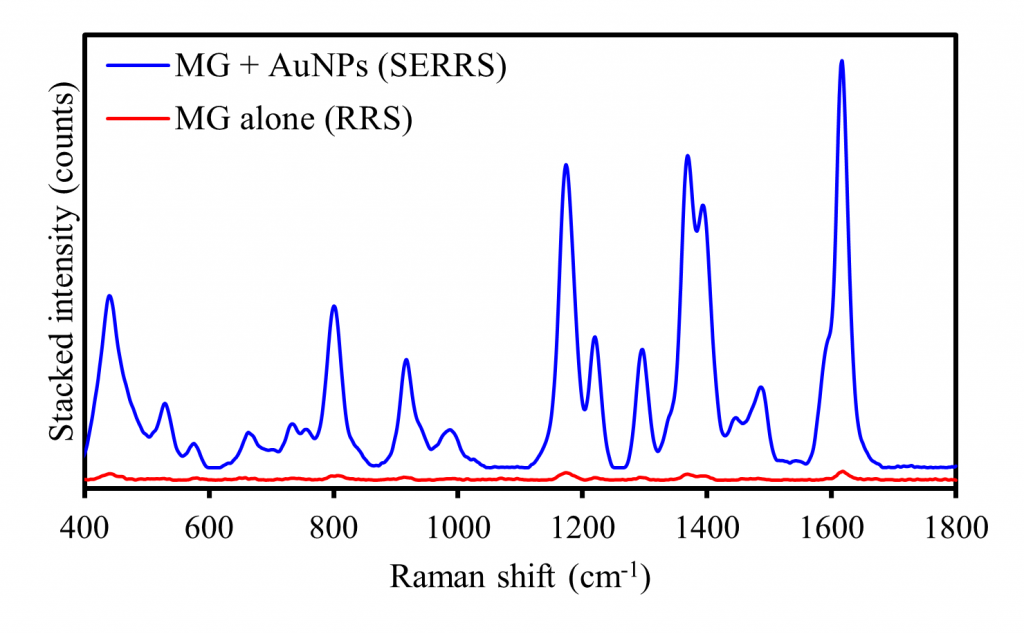
Figure 5. SERRS analysis of MG functionalised AuNPs (blue) and RRS analysis of an equivalent concentration of MG (red).
Finally, to demonstrate the enhanced Raman response and detection sensitivity of SERRS over SERS, the limit of detection (LOD) of the same sample of MG functionalised AuNPs was compared using resonant 638 nm and off-resonance 785 nm lasers, Figure 6. The functionalised NPs were diluted incrementally from a starting concentration of 38 pM, and the Raman spectrum was recorded in triplicate at both wavelengths for each concentration until the MG vibrational signatures were no longer observable above the spectrum of a control consisting solely of water. The theoretical LOD of the MG functionalised AuNPs was then calculated at the resonant and off-resonance wavelengths using the following equation:
LOD = (3.3 x σ)/S
In this equation, σ represents the standard deviation of the water control and S represents the slope of a linear calibration plot of the averaged Raman intensity of the largest MG band at 1616 cm-1 against the concentration of AuNPs, shown in Figure 6 for both wavelengths. This analysis showed that at all concentrations, the intensity of the MG band at 638 nm was much larger than at 785 nm, which is consistent with SERRS outperforming SERS in terms of signal enhancements. Furthermore, the LOD metric shows that SERRS outperformed SERS in detection sensitivity because the 19.97 fM LOD calculated at 638 nm, Figure 6A, is 73.61 times lower than the 1.47 pM LOD calculated at 785 nm, Figure 6B.
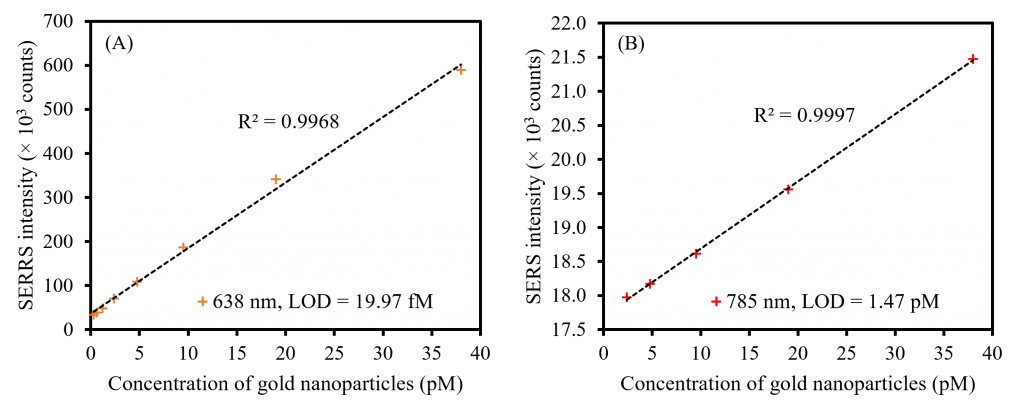
Figure 6. LOD study for MG functionalised AuNPs collected using (A) 638 nm and (B) 785 nm lasers.
Conclusion
This application note has shown how the DS5 Dual Beam UV-Vis Spectrophotometer and the RM5 Microscope can be used together for the characterisation of nanosensors that produce an optically bright SERRS response. UV-Vis spectroscopy was used to examine the separate optical properties of AuNPs and MG that contribute to the SERRS effect; namely, the AuNP LSPR that contributes to SERS and the absorption profile of MG that induces RRS when a resonant laser is used. Using Raman spectroscopy, it was shown that SERRS outperformed RRS and SERS in terms of the intensity produced and LOD achieved, respectively.
References
- A. Stacy et al., Surface-enhanced Raman and resonance Raman spectroscopy in a non-aqueous electrochemical environment: Tris(2,2’-bipyridine)ruthenium(II) adsorbed on silver from acetonitrile, Chem. Phys. Lett., 1983, 102, 365-370, DOI: 10.1016/0009-2614(83)87057-2.
- G. McNay et al., Surface-enhanced Raman scattering (SERS) and surface-enhanced resonance Raman scattering (SERRS): a review of applications, Appl. Spectrosc., 2011, 65, 825-837, DOI: 10.1366/11-06365
- G. -N. Xiao et al., Rapid and Sensitive Detection of Malachite Green and Melamine with Silver Film over Nanospheres by Surface-Enhanced Raman Scattering, Plasmonics, 2017, 12, 1169-1175, DOI: 10.1007/s11468-016-0372-5
- L. Nehl et al., Shape-dependent plasmon resonances of gold nanoparticles, J. Mater. Chem., 2008, 18, 2415-2419, DOI: 10.1039/B714950F
- L. He et al., Use of a Fractal-like Gold Nanostructure in Surface-Enhanced Raman Spectroscopy for Detection of Selected Food Contaminants, J. Agric. Food Chem., 2008, 56, 9843-9847, DOI: 10.1021/jf801969v
