


Kinetics of Persistent Luminescence Phosphors
Persistent luminescence, commonly called afterglow, is characterised by long-lasting visible emission over several hours after ultraviolet excitation. This finds wide applications in glow-in-the-dark signage and in-vivo imaging for disease diagnosis and treatment. However, biological tissue allows transmission of near-infrared (NIR) light shorter than 1400 nm due to absorption by water and lipids.¹ The majority of bio-imaging applications utilises the 700 nm-950 nm window.²-⁴
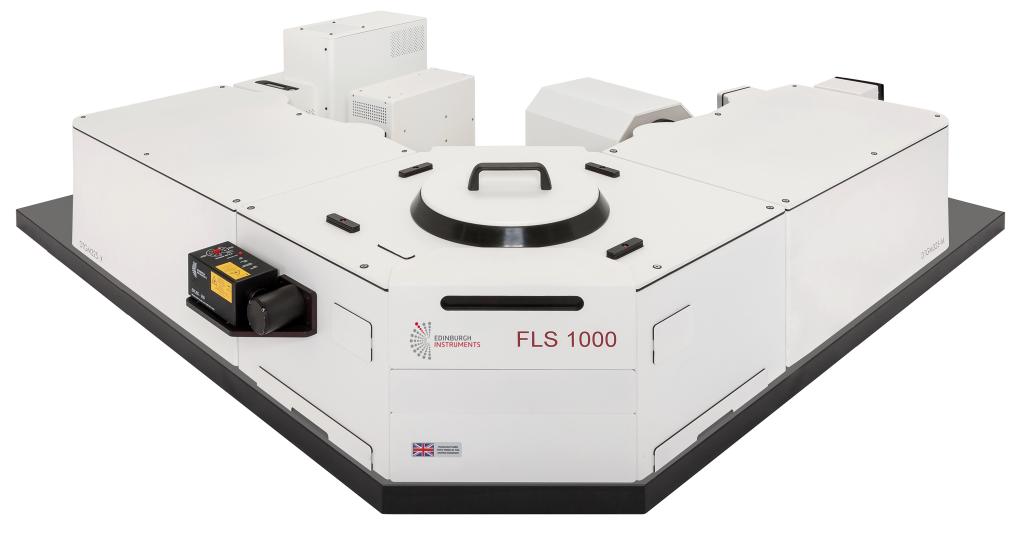
FLS1000 Photoluminescence Spectrometer
Moreover, with persistent luminescence, auto-fluorescence of the tissue is circumvented under continuous illumination. Lanthanides and transition metals such as Eu/Dy/Mn5, Eu/Pr/Dy6, Mn/Cr/Pr7,8 have been used as the active centres in silicate, diopside6, gallate and germanate7,8 hosts. However, silicate and aluminate hosts have seen wider application with Eu9 and non-Eu ions10. In this note, the persistent luminescence kinetics of SrAl2O4: Eu2+, Dy3+ are characterised by optical spectroscopy.
Methods and Materials
Excitation and emission spectra, as well as decays were measured in a FLS1000 Photoluminescence Spectrometer equipped with a 450 W Xe source and double monochromators. A 250 nm blazed grating was used at the excitation and a 400 nm blazed grating at the emission arm.
Luminescence was detected with a photomultiplier tube detector (PMT-900), while higher diffraction orders were filtered by integrated long wave-pass filters in the FLS1000.
SrAl2O4: Eu2+, Dy3+ micro-crystalline powder phosphor (Glotech International) was used for all measurements as received. To obtain the persistent luminescence decay of the phosphor, the sample was illuminated for 5 min by a Xe source with the monochromator set between 300 nm – 350 nm. Consequently, illumination was blocked via software-controlled shutters and the luminescence decay was monitored for 1 h with 1 s resolution.
This resolution was adequate to monitor the persistent luminescence kinetics of this phosphor, however, for more complex kinetics and decays as long as 277 h, a resolution of 100 s can be used.
The decays (results not shown) were also acquired in an FS5 Spectrofluorometer equipped with a 150 W Xe source and resulting in similar kinetics.
Results-Discussion
SrAl2O4: Eu2+, Dy3+ is one of the first and most widely studied persistent luminescence phosphors. It’s been widely applied mainly due its long duration, despite some degradation that has been reported after two years in water11,12.
The excitation and emission spectra of SrAl2O4: Eu2+, Dy3+ are shown in Figure 1. The emission peak around 520 nm is a 4f65d1 to 4f7 Eu transition13 leading to the phosphor’s persistent luminescence. It can be excited in the ultraviolet between 300 nm – 500 nm, however, vacuum ultraviolet studies of doped and pure SrAl2O4 have shown that the excitation onset starts at 200 nm matching the peak of the afterglow excitation spectrum14.
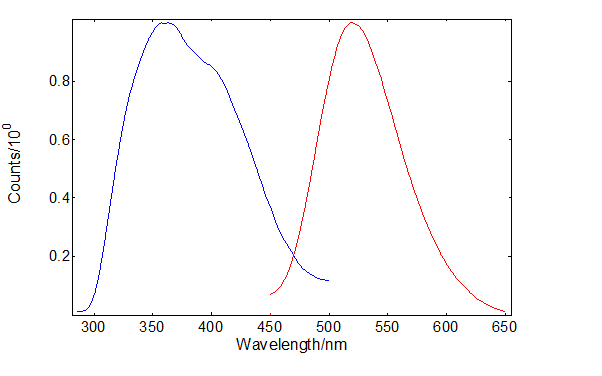
Figure 1: Excitation and emission spectra of SrAl2O4:Eu2+, Dy3+
The kinetics of the afterglow have been further monitored for 1 h after 5 min excitation. Figure 2 shows characteristic evidence of competition between photoluminescence and energy storage in trap states. Several trap states placed as low as 0.19 eV15 and up to 1.47 eV16 were reported, while the optimum energy value has been found around 0.65 eV17.
It can be seen that the initial charging phase is excitation dependence. However, this is reduced after correcting for the excitation intensity as shown in a logarithmic scale in the inset and agreeing with normalised excitation and afterglow studies18. A similar behaviour is observed for the decay phase, which has been reported previously19 and correlated with the behaviour of thermo-luminescence. In fact a good agreement of the integrated intensity was reported between the persistent luminescence and the thermo-luminescence curves, exposing the application of the phosphor to radiation dosimetry.
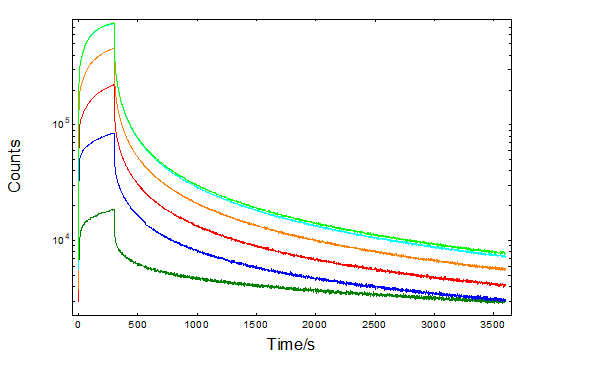
Figure 2: Persistent luminescence decays of SrAl2O4: Eu2+, Dy3+ at 520 nm, excited for 5 min between 300 nm – 350 nm. The decays corrected for the excitation intensity are shown in the inset in logarithmic scales.
The decays have been fitted into four exponential models of the form:
Σ[A+Bie(-t/τi)], i=1…4.
The derived lifetimes are presented in Table 1 along with the corresponding χ2 and average lifetimes. Several models such as the stretched exponential20 or even the stretched or compressed hyperbola21 were reported for the afterglow kinetics of persistent luminescence phosphors. A good fit has been obtained with the aforementioned equation and four exponentials. The three exponential models result in χ2 higher than 3, however the lifetimes are similar to these previously reported at 400 nm excitation16.
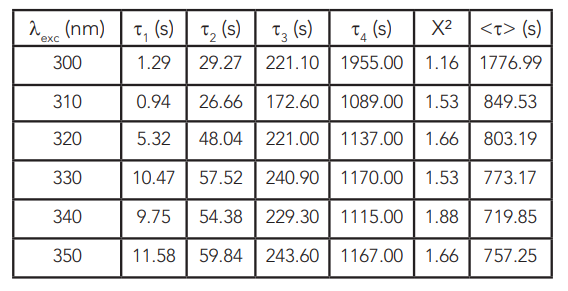
Table 1: Lifetimes of the persistent luminescence kinetics in SrAl2O4:Eu2+, Dy3+ excited from 300 nm to 350 nm.
Several models have been proposed for the mechanism of persistent luminescence including traps close to the valence band17. However, electronic band calculations place the Eu2+ levels below the conduction band in agreement with XPS measurements placing it 3 eV above the valence band22. Moreover, combined radio-luminescence and x-ray absorption spectroscopy confirmed the ionisation of Eu2+ to Eu3+, albeit ionisation of Dy2+ to Dy3+ was not detected23, which indicates a low probability of existing trap states just above the valence band. The depth of traps can be further studied via thermo-luminescence emission24,25 as well as excitation mapping10,18 to obtain direct information about trap filling states.
Conclusion
The persistent luminescence kinetics of SrAl2O4: Eu2+, Dy3+, were presented in this application note. Standard configuration FLS1000 and FS5 Fluorescence Spectrometers were used to characterise excitation spectra in the UV, emission spectra, as well as the persistent luminescence decays of the phosphor. The afterglow peak at 520 nm was monitored for 1 h after 5 min excitation between 300 nm – 350 nm. The afterglow decays showed a limited excitation-dependence and after fitting into four exponential models, average lifetimes ranging from 750 s to 1780 s were obtained, depending on the excitation wavelength.
References
- Smith, A. M., Mancini, M. C. & Nie, S. Nat. Nanotechnol. 4, 710–711 (2009).
- Rice, B. W., Cable, M. D. & Nelson, M. B. J. Biomed. Opt. 6, 432–440 (2001).
- Stroh, M. et al. Nat. Med. 11, 678–682 (2005).
- So, M.-K., Xu, C., Loening, A. M., Gambhir, S. S. & Rao, J. Nat. Biotechnol. 24, 339–343 (2006).
- Chermont, Q. le M. de et al. Proc. Natl. Acad. Sci. 104, 9266–9271 (2007).
- Maldiney, T. et al. J. Am. Chem. Soc. 133, 11810–11815 (2011).
- Abdukayum, A., Chen, J.-T., Zhao, Q. & Yan, X.-P. J. Am. Chem. Soc. 135, 14125–14133 (2013).
- Singh, S. K. RSC Adv. 4, 58674–58698 (2014).
- Van den Eeckhout, K., Smet, P. F. & Poelman, D. Materials 3, 2536–2566 (2010).
- Van den Eeckhout, K., Poelman, D. & Smet, P. F. Materials 6, 2789–2818 (2013).
- Guo, C., Luan, L., Huang, D., Su, Q. & Lv, Y. Mater. Chem. Phys. 106, 268–272 (2007).
- Botterman, J. & Smet, P. F. Opt. Express 23, A868–A881 (2015).
- Clabau, F. et al. Solid State Sci. 9, 608–612 (2007).
- Kamada, M., Murakami, J. & Ohno, N. J. Lumin. 87, 1042–1044 (2000).
- Jia, D. Opt. Mater. 22, 65–69 (2003).
- Arellano-Tánori, O. et al. J. Lumin. 128, 173–184 (2008).
- Matsuzawa, T., Aoki, Y., Takeuchi, N. & Murayama, Y. J. Electrochem. Soc. 143, 2670–2673 (1996).
- Hagemann, H. et al. J. Lumin. 170, Part 1, 299–304 (2016
- Pereyda-Pierre, C., Meléndrez, R., García, R., Pedroza-Montero, M. & Barboza- Flores, M. Radiat. Meas. 46, 1417–1420 (2011).
- Kohlrausch, R. Theorie des elektrischen Rückstandes in der Leidener Flasche. Ann. Phys. 167, 179–214 (1854).
- Whitehead, L., Whitehead, R., Valeur, B. & Berberan-Santos, M. Am. J. Phys. (2009).
- Clabau, F. et al. Chem. Mater. 17, 3904–3912 (2005).
- Korthout, K. et al. Phys. Rev. B 84, 085140 (2011).
- Arnaoutakis, G. Temperature Dependence of Phosphors via Photo- and Thermoluminescence. (Edinburgh Instruments, 2017).
- Kamiyanagi, Y., Kitaura, M. & Kaneyoshi, M. J. Lumin. 122, 509–511 (2007).
Download Persistent Luminescence Application Note
Download the complete application note: Kinetics of Persistent Luminescence Phosphors
FLS 1000 & FS5 Photoluminescence Spectrometer
For further information on the FLS1000 or FS5 Photoluminescence Spectrometers why not contact one of our sales team today email us at sales@edinst.com or give us a call on +44 (0) 1506 425300
Sign-Up for our Application and Technical Notes
If you have enjoyed reading our Application Note, why note sign-up to our infrequent newsletter via our red Sign-up button below.