


Comparing Hole Extraction Efficiencies in Perovskite Solar Cells using Photoluminescence Quantum Yield
Introduction
Efficient extraction of charge carriers is critical for the creation of high-efficiency solar cells. To improve charge extraction, electron and hole extraction layers are routinely incorporated into the solar cell stack. To optimise cell performance, the extraction efficiency of different extraction layers must be investigated and compared. Photoluminescence (PL) spectroscopy is an ideal technique for this comparison as PL is proportional to the number of charge carriers in the perovskite.
For PL to occur, the photogenerated electrons and holes in the perovskite layer must recombine. The transfer of electrons or holes into adjacent layers will inhibit radiative electron-hole recombination within the perovskite layer and decrease the PL response (Figure 1). By monitoring the intensity of the PL, the efficiency that electrons or holes are extracted out of the perovskite layer can be studied.
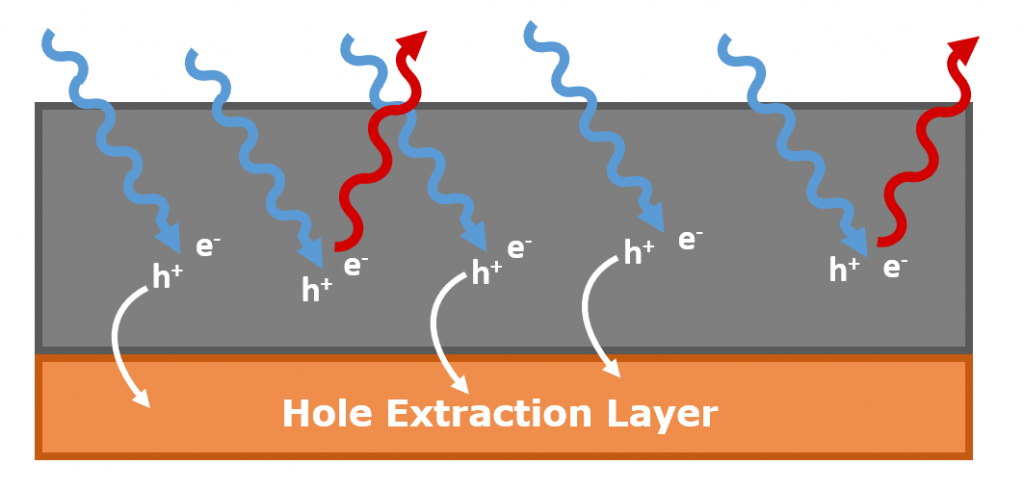
Figure 1: Interplay between excitation (blue arrows), photoluminescence (red arrows) and charge extraction (white arrows) in a perovskite layer.
One promising material under investigation as a hole extraction layer in perovskite solar cells are vertically aligned carbon nanotubes (VACNTs). In this application note, the extraction efficiency of a VACNT hole extraction layer is investigated using PL spectroscopy with an Edinburgh Instruments FLS1000 Photoluminescence Spectrometer.
Experimental Setup
A layer of mixed halide Cs0.05FA0.79MA0.16PbI2.4Br0.6 perovskite was spin-coated atop a Glass/ITO and a Glass/ITO/VACNT substrate. Full details of the sample fabrication can be found in the accompanying publication.1 The PL of the two perovskite samples was characterised using the Edinburgh Instruments FLS1000 Photoluminescence spectrometer. The FLS1000 was equipped with a 450 W Xenon Lamp, double excitation and double emission monochromators and a PMT-980 detector. For the relative PL intensity comparison, the samples were held using the N-J03 Front Face Sample Holder and for determination of the PL quantum yields, they were placed in the N-M01 Integrating Sphere.
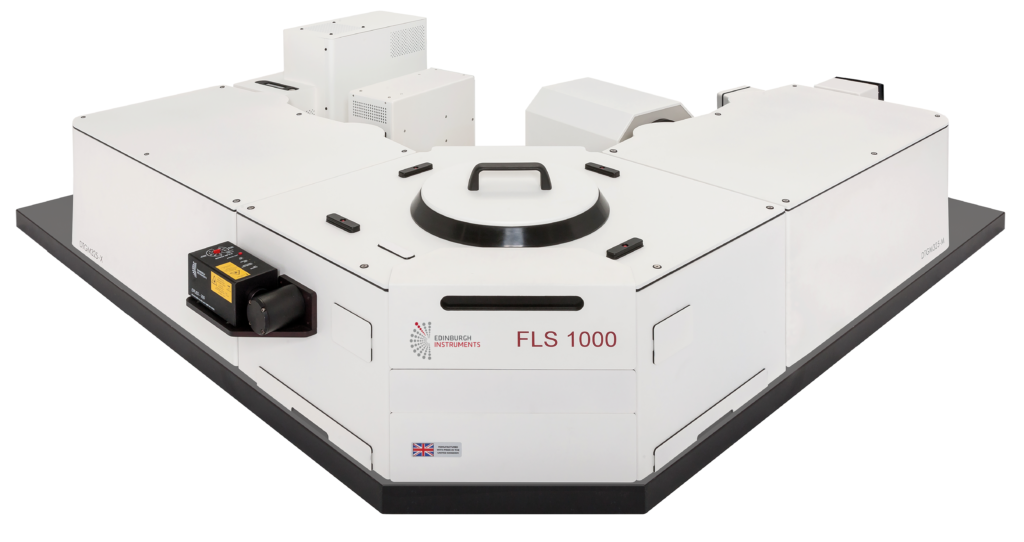
Figure 2: FLS1000 Photoluminescence Spectrometer.
Relative PL Intensity Comparison
The simplest method to investigate the impact of the VACNT layer on the hole extraction efficiency is by measuring the PL spectra of the Glass/ITO/Perovskite and Glass/ITO/VACNT/Perovskite and comparing their integrated PL intensities. If the addition of the VACNT layer enhances hole extraction the PL intensity from the VACNT layer sample will be lower than the sample without the layer (Figure 3).

Figure 3: Principle of the relative PL intensity comparison.
For the relative PL intensity comparison, the perovskite samples were held in turn using N‑J03 Front Face Sample Holder of the FLS1000 and their PL spectra measured under identical conditions (integration time, sample position and angle, excitation wavelength, and excitation and emission bandwidths) and are shown in Figure 4. It can be seen that the perovskite sample containing the VACNT layer has a significantly reduced PL contribution. Integrating the PL spectra using the Fluoracle® software of the FLS1000 reveals that the integrated PL intensity of the Glass/ITO/VACNT/Perovskite is 0.15x that of the Glass/ITO/Perovskite, indicating that hole extraction efficiency is significantly improved by the addition of the VACNT layer. This method of comparing the relative PL intensity can be applied generally when optimising perovskite solar cells and the effect of different electron and hole extraction layers, annealing temperatures, chemical compositions, post-processing treatments etc. on the fraction of carriers that radiatively recombine can be studied and used to optimise solar cell designs.
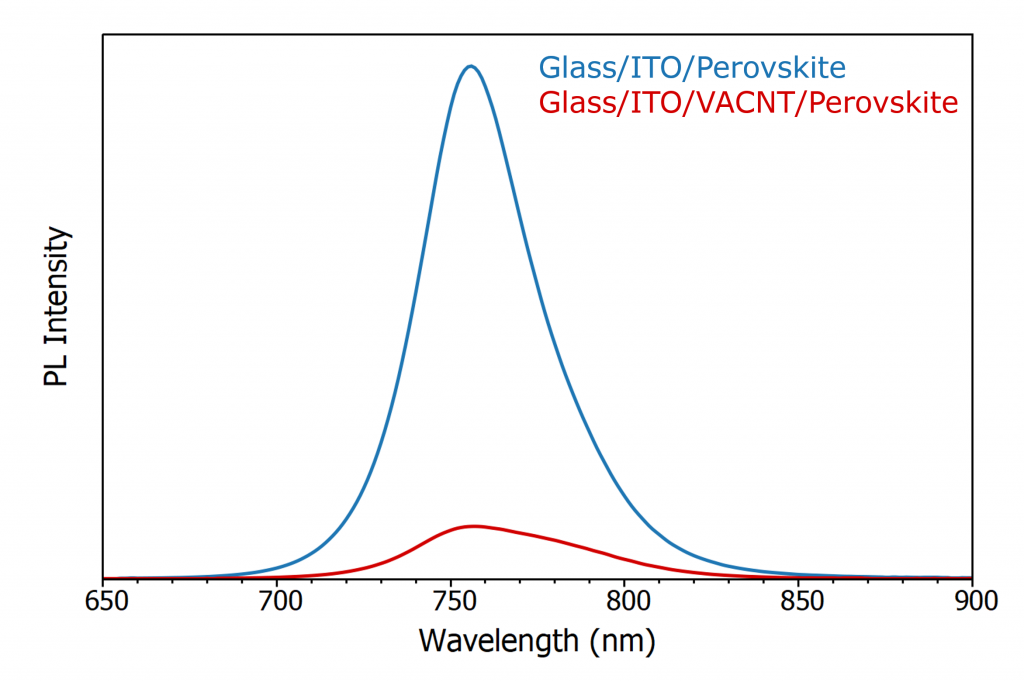
Figure 4: PL spectra of the perovskite samples with and without a VACNT layer.
However, care should be taken with this approach. The intensity comparison assumes that the fraction of excitation light absorbed by the sample and the fraction of photoluminescence that is collected by the spectrometer is the same for all samples in the comparison. Under these assumptions and provided identical experimental parameters are used to measure the spectra, the ratio of spectra integrated intensities is equal to the ratio of the photoluminescence quantum yields and the comparison is meaningful.
For solid samples, such as a perovskite spin-coated on a substrate, the fraction of photoluminescence collected by the spectrometer can change vastly depending on the exact position and angle of the sample in the spectrometer. It is therefore essential that the samples to be compared are positioned as similarly as possible in the spectrometer so that the same fraction of photoluminescence is collected. In the FLS1000 the primary solid sample holder is the N-J03 which has a linear position adjustment to allow the user to optimise the PL collected. For relative intensity PL measurements, the position of N-J03 should be optimised for the first sample and then all other samples measured with the same position. The substrate size and shape should be identical for all samples to enable this reproducible positioning. Provided that care is taken with positioning and the absorption properties of the samples are approximately equal; the relative approach provides a fast and powerful method for qualitatively investigating the impact of cell design and processing conditions on charge carrier extraction and recombination.
PLQY with an Integrating Sphere
A more robust method to investigate the hole extraction efficiency is using an integrating sphere and calculating the photoluminescence quantum yield (PLQY) of each sample. An integrating sphere is a hollow sphere constructed from highly reflective spectral grade PTFE that collects all photoluminescence and scattered excitation light for detection (Figure 5). By using an integrating sphere and calculating the PLQY, the potential error due to sample positioning is removed and any differences in the absorption and reflection properties of the samples are accounted for, resulting in a more accurate comparison.
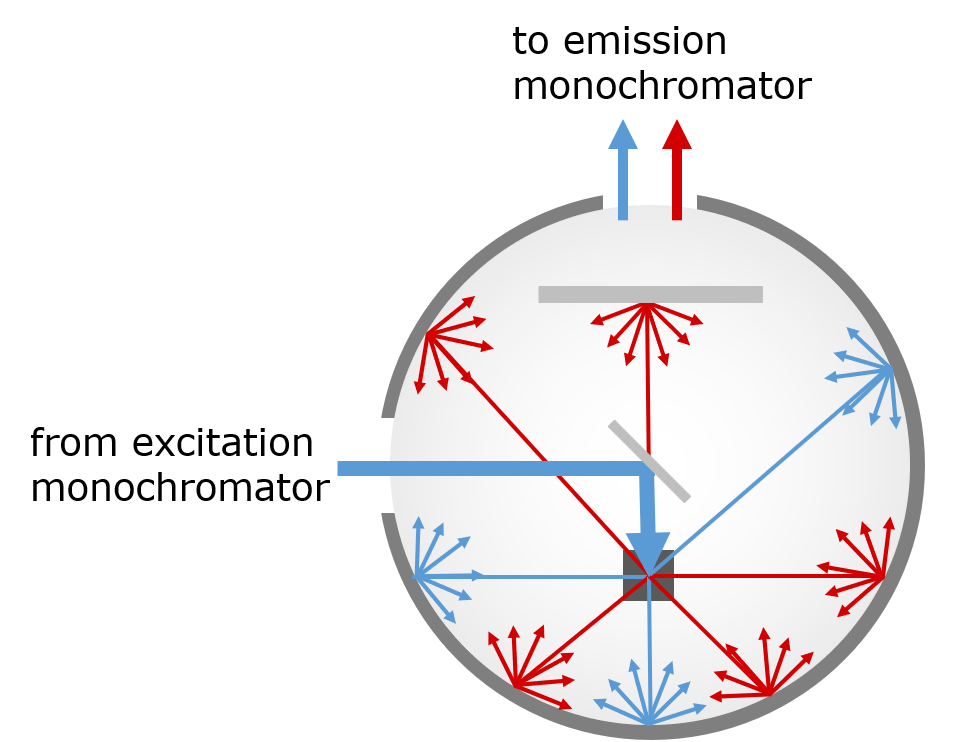
Figure 5: Operating principle of an integrating sphere for photoluminescence quantum yield. Excitation light is shown in blue and photoluminescence in red.
To measure the PLQY of the two perovskite samples the FLS1000 was equipped with the N‑M01 Integrating Sphere which sits inside the sample chamber without the need for any fibre coupling or alignment. The samples were placed in turn on a PTFE scattering plug, excited at 430 nm and the emission monochromator scanned over the scattering peak and photoluminescence peak as shown in Figure 6. A reference measurement where only the PTFE scattering plug was in the sphere was also measured. The Fluoracle Quantum Yield wizard was then used to calculate the PLQY from the spectra. In the wizard, the desired scattering and emission integration ranges are defined, and Fluoracle then integrates over the reference and sample spectra and calculates the PLQY using:
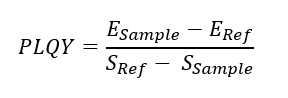
where SSample and SRef are the integrated intensities of the scattering peaks of the sample and reference, and ESample and ERef are the integrated intensities of the sample and reference emission.
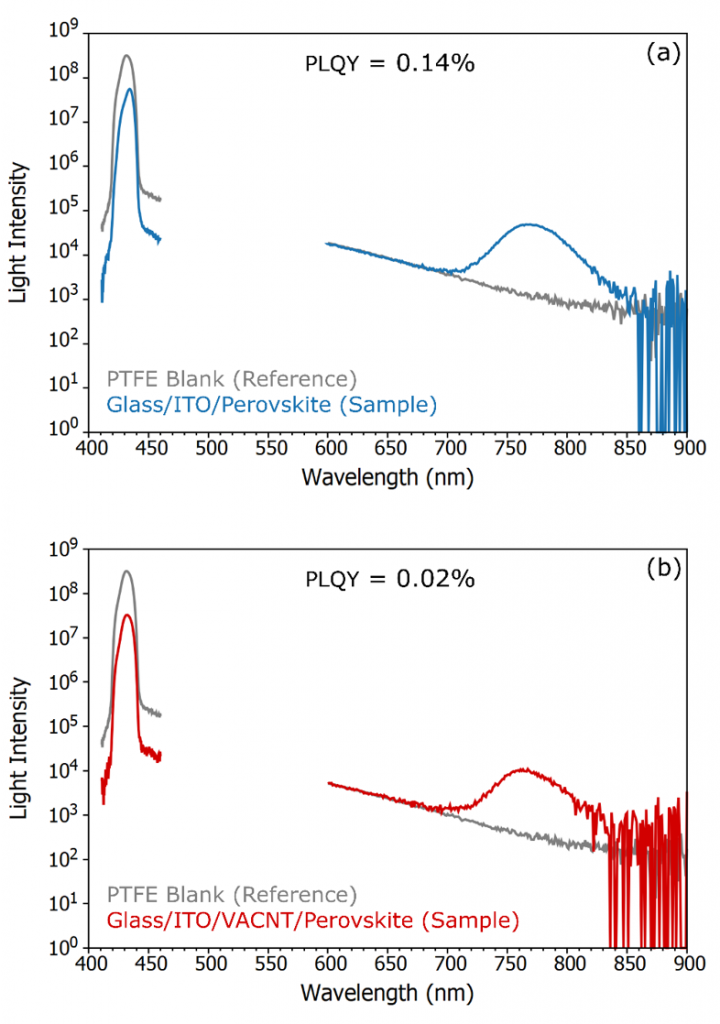
Figure 6: Spectra for the calculation of the photoluminescence quantum yield of the perovskite samples without (a) and with (b) a VACNT layer. Negative and zero values are displayed as 1 on the logarithmic plot. During measurement of the scattering peaks, an OD 2 neutral density filter was placed on the excitation side to attenuate the excitation intensity and the scattering peaks were re-scaled by the filter transmission ratio prior to calculation. The 600-900 nm PTFE blank spectra have been scaled by the ratio of the sample and reference scattering peaks to account for the lower sphere background when an absorbing sample is present.
The PLQY of the Glass/ITO/Perovskite was calculated to be 0.14% compared to 0.02% for the Glass/ITO/VACNT/Perovskite which confirms that the VACNT layer is suppressing radiative recombination in the perovskite layer due to improved hole extraction. The ratio of the PLQY values is 0.14, which is close to the PL intensity ratio of 0.15 obtained from the relative intensity method. The close agreement can be attributed to the perovskite samples having identical substrates, positioned as alike as possible, and the VACNT layer not appreciably changing the reflection and absorption properties of the sample. This result shows that the relative method is representative when these conditions are met but the sphere method will always give a more accurate comparison, provide greater flexibility, and importantly allow the PLQY of each sample to be calculated where the relative approach gives only the ratio.
From the PLQY values, the hole transfer efficiency into the VACNT layer can be calculated using,1,2
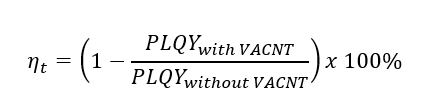
which gives a transfer efficiency of 86% using the PLQY values of 0.14% and 0.02%. For an accurate calculation of the transfer efficiency, the PLQY of the sample without the transfer layer should be measured on an inert substrate such as SiO2 where no transfer can be assumed to occur. Here, PLQYwithout VACNT was measured on an ITO coated substrate into which some hole transfer will occur, and the 86% is therefore the lower bound of the transfer efficiency.
Conclusion
The charge extraction properties of a VACNT hole extraction layer for perovskite solar cells were investigated using the FLS1000 Photoluminescence Spectrometer. The hole extraction performance was investigated using both a relative intensity comparison method and an absolute method using the FLS1000 integrating sphere. The application note demonstrates that the FLS1000 is a powerful research tool for comparing the charge extraction properties in perovskite solar cells.
Acknowledgements
We are grateful to Dr. Victoria Ferguson from the University of Surrey Nanoelectronics group for providing the perovskite sample used in this application note.
References
- V. Ferguson, B. Li, M. O. Tas, T. Webb, M. T. Sajjad, S. A. J. Thomson, Z. Wu, Y. Shen, G. Shao, J. V. Anguita, S. R. P. Silva, W. Zhang, Direct Growth of Vertically Aligned Carbon Nanotubes onto Transparent Conductive Oxide Glass for Enhanced Charge Extraction in Perovskite Solar Cells, Adv. Mater. Interfaces 7 2020, 2001121
- D. Aldakov, M. T. Sajjad, V. Ivanova, A. K. Bansal, J. Park, P. Reiss, I. D. W. Samuel, Mercaptophosphonic acids as efficient linkers in quantum dot sensitized solar cells, J. Mater. Chem. A 2015, 3, 19050
Further Reading
This application note has an accompanying paper published in Advanced Materials Interfaces in collaboration with the University of Surrey, London South Bank University, and Zhengzhou University where more information on the fabrication and characterisation and performance of the VACNT perovskite solar cells can be found.
Discover the FLS1000 Photoluminescence Spectrometer
Find out more about the FLS1000 Photoluminescence Spectrometer. If your research is into solar cells and you would like to talk to one of our sales team to find out how the FLS1000 can be used within your solar research, please contact us.
