


CCD Spectrometers for Excitation-Emission Spectroscopy
A CCD Spectrometer (Charge Coupled Device) can significantly reduce the acquisition time of excitation-emission maps, particularly those with narrow emission linewidths.
Excitation-emission spectroscopy becomes increasingly useful in the study of photo-luminescent materials. The spectral selectivity of the technique enables the quantification of multiple emitting sites in rare-earth doped crystals,1–3 as well as the rapid acquisition of polycyclic aromatic hydrocarbons (PAH) in contaminated water.4,5 In order to obtain a complete spectral fingerprint via excitation-emission spectroscopy, scans at multiple excitation wavelengths over the emission spectra are required. Especially in the case of rare-earth materials with narrow emission linewidths, this is extremely demanding in terms of resolution. The acquisition time of such excitation-emission maps (EEM) can be significantly reduced by using Charge Coupled Device (CCD) detectors.

A CCD detector contains an array of photo-sensors which enables the detection of light with spatial resolution. CCD detectors for the visible and NIR range can be integrated into the Edinburgh Instruments range of fluorescence spectrometers. Consequently, multiple wavelengths are recorded simultaneously with this approach, so that an entire emission spectrum can be acquired in a single shot. Measurements such as excitation-emission maps are therefore much faster with a CCD compared to standard photomultiplier tube (PMT) detectors. In addition, this enables the acquisition of highly resolved excitation emission maps in a rapid manner compared to traditional PMT detectors used in spectroscopy, as will be outlined in this application note.
Experimental Setup of CCD Spectrometer
In an FLS980 Fluorescence Spectrometer configured for CCD detection, a single emission monochromator is used as a spectrograph that directs the emission from the sample to the input window of the CCD camera. The monochromator has one port with a computer-controlled slit for PMT detection, and a second imaging port with a wide aperture for the CCD (Figure 1). When acquiring
spectral data with the CCD camera, the monochromator is set to the centre wavelength of the emission spectrum.
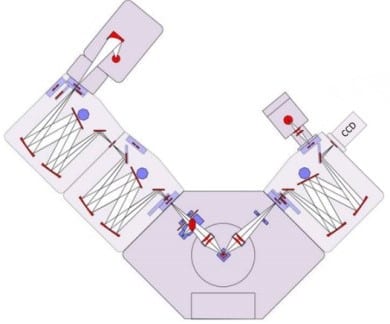
Figure 1: FLS980 Fluorescence Spectrometer configured with CCD detection. The instrument incorporates an Xe excitation lamp, double excitation monochromator, and single emission monochromator with a PMT and CCD detector.
Results and Discussion
In the following Figures 2-4, excitation-emission maps acquired with CCD detectors are shown. Both visible and near-infrared (NIR) detectors based on InGaAs arrays are fully controlled from the spectrometer’s software, F980. The software allows the user to display the data as 2D, contour maps and 3D plots.
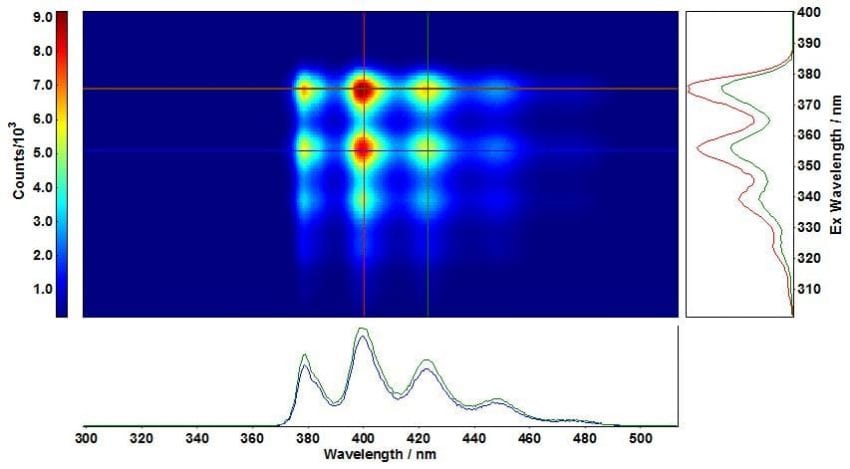
Figure 2: Excitation-emission map of anthracene in cyclohexane acquired with an iDus DU420A camera cooled down to -40 °C. Measurement conditions: Δλex=5 nm, stepexc=1.00 nm, λem=500 nm, Δλem=1 nm stepem=0.553 nm, tint=0.5s, tacq=15min. The cross sections correspond to blue: λexc/λem=355 nm/400 nm, red: λexc/λem=375 nm/400 nm and green: λexc/λem=375 nm/423 nm.
Room temperature emission from the 5D4 level to 7F5 and 7F3 levels of Tb3+ resulting in strong green emission are displayed in the EEM of LaPO4: Ce, Tb of Figure 3. To obtain a map with this resolution an acquisition time of 58 min was required, compared to 90 h needed when a PMT is used. Estimated acquisition times for EEM of anthracene and Nd:YAG with a PMT were 15 h and 2 h, respectively.
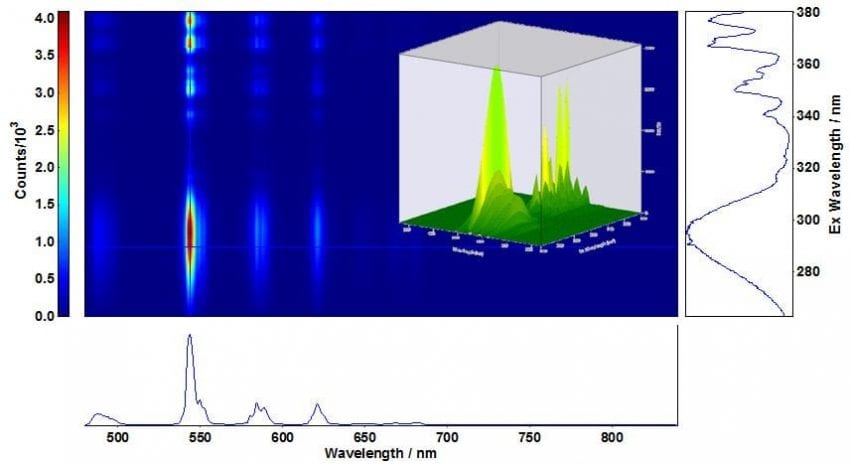
Figure 3: Excitation-emission map of LaPO4: Ce,Tb acquired with an iDus DU420A camera cooled down to -70°C. Measurement conditions: Δλex=0.50 nm, stepexc=0.20 nm, λem=550 nm, Δλm=0.3 nm, stepem =0.568 nm,tint=0.5s. tacq=58 min. The cross section is at λexc/λem=290 nm/544 nm and a 3D map is shown in the inset.
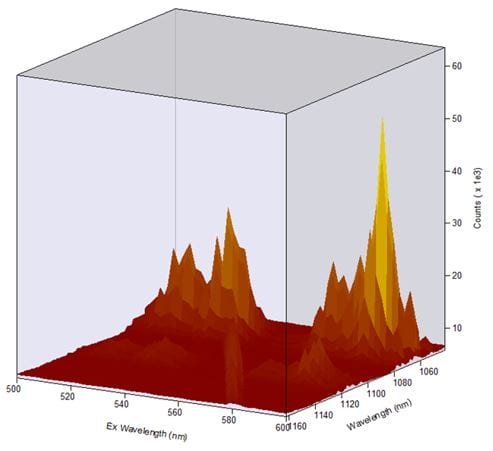
Figure 4: Excitation-emission 3D map of Nd:YAG acquired with an iDus DU491-A 1.7 camera cooled down to -70 °C. Measurement conditions: Δλex=0.50 nm, stepexc=2 nm, λem=1100 nm, Δλem=0.5 nm, stepem=0.118 nm, tint =0.5 s, tacq=10 min.
References
1. Dierolf, V., Kutsenko, A. B., Sandmann, C., Tröster, T. & Corradi, G. High-resolution site selective optical spectroscopy of rare earth and transition metal defects in insulators. J. Lumin. 87–89, 989–991 (2000).
2. Dierolf, V. & Sandmann, C. Combined excitation emission spectroscopy of defects for site-selective probing of ferroelectric domain inversion in lithium niobate. J. Lumin. 125, 67–79 (2007).
3. C. Renero-Lecuna, R. Martín-Rodríguez & R. Valiente. Origin of the High Upconversion Green Luminescence Efficiency in β-NaYF4:2%Er3+,20%Yb3+ – Chemistry of Materials (ACS Publications). Chem Mater 23, pp 3442–3448 (2011).
4. Nahorniak, M. L. & Booksh, K. S. Excitation-emission matrix fluorescence spectroscopy in conjunction with multiway analysis for PAH detection in complex matrices. Analyst 131, 1308–1315 (2006).
5. Andrade-Eiroa, Á., Canle, M. & Cerdá, V. Environmental Applications of Excitation-Emission Spectrofluorimetry: An In-Depth Review II. Appl. Spectrosc. Rev. (2012).
Download the full CCD Spectrometer Technical Note
Excitation-Emission Spectroscopy with Charge Coupled Detectors
CCD Spectrometer for Excitation-Emission Spectroscopy
Emission spectra were measured using an FLS980 Fluorescence Spectrometer. Our FLS980 has now been discontinued but we are still able to offer upgrades to those with existing systems. Our FLS1000 Photoluminescence Spectrometer has replaced the FLS980, and sets the standard in both steady state and time-resolved photoluminescence spectroscopy for fundamental research and routine laboratory applications. To find out about upgrades for an existing FLS980 CCD spectrometer, or to enquire about our FLS1000, contact a member of our sales team at sales@edinst.com.
Keep in Touch
If you have enjoyed reading this Technical Note, and want to be the first to see the latest news, application, and product information from Edinburgh Instruments, sign-up to our infrequent newsletter via the red sign-up button below, and follow us on social media.