


3D Raman Mapping of a Transdermal Patch
Introduction
A transdermal patch is a method of drug delivery through the skin into the bloodstream. The patch contains a drug which absorbs into your skin when attached to you and it releases a consistent and controlled amount of medication into the body over long periods time. This method of delivery is preferred in cases where the drug can have negative side effects on the gastrointestinal tract, for prolonged drug release, or an option for people with a fear of needles looking to avoid medication delivered via injection.
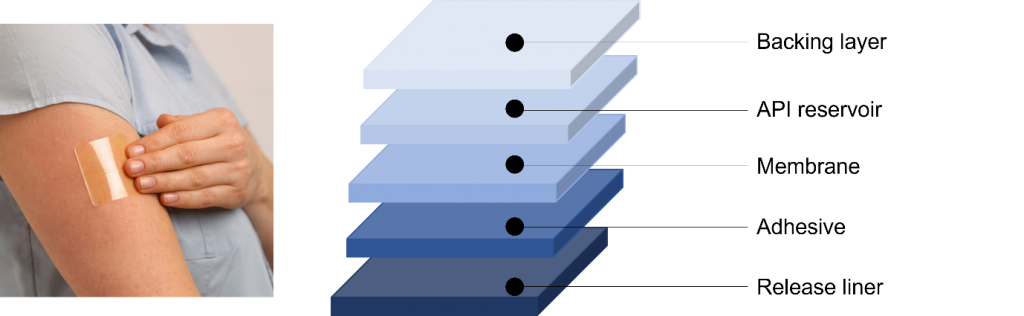
Figure 1: Typical transdermal patch and its layer composition.
One of the most common uses for transdermal patches is to help combat nicotine addiction. Nicotine transdermal patches were first developed as a method to aid smokers quitting in the 1980s after several studies proved the absorption of nicotine into the body reduced cravings. Nicotine replacement therapy (NRT) releases small amounts of nicotine throughout the day, without the additional harmful components of cigarettes, such as tar. A recent review of data from the public and from clinical trials revealed using an NRT can increase the chance of successfully quitting by up to 60%.1
In this application note we study a nicotine patch to reveal the active pharmaceutical ingredient (API) as well as the polymer layers encapsulating it via confocal Raman microscopy. Using an RMS1000 Raman Microscope we analysed a nicotine patch in the X, Y, and Z dimensions. This can provide manufacturers and researchers with important information on the quality of their product, validating the amount and distribution of API within the patch, as well as identifying any contaminants without causing damage to the sample.
Materials and Methods
An RMS1000 Raman Microscope was used for the 3D measurement of the transdermal nicotine patch. The nicotine patch was a commercially available NRT purchased from a pharmacy. The RMS1000 can take 3D Raman maps thanks to its confocal pinhole. The pinhole acts as a spatial filter in the axial (Z) direction by blocking the Raman scatter from above and below the focal plane and is essential for 3D mapping. Without the pinhole, there is no axial spatial filtering and Raman scatter from the entire axial volume of the sample would be collected with no axial resolution.
Figure 2: RMS1000 Raman Microscope.
The RMS1000 has several confocal pinhole positions available, from 25 µm to 2 mm, the smaller the confocal pinhole the better the resolution in X, Y, and Z. However, as you decrease the pinhole you will decrease the Raman intensity, therefore, by offering many pinhole positions the RMS1000 allows the user to find the perfect balance of spatial resolution and Raman intensity for their sample.
The 3D Raman map of the patch was taken with a 785 nm laser at 100% power and the pinhole set to 300 µm. A slit width of 70 µm was used along with a 600 gr/mm grating and a back illuminated CCD.
Results
The transdermal patch analysed contained nicotine as they active ingredient surrounded by polymers. By carrying out a Raman 3D map we can visualise the different material layers present in patch, shown below in Figure 3 as a 3D render. Spectra were collected at 10 µm steps in the X and Y axis, and 1 µm steps in the Z axis.
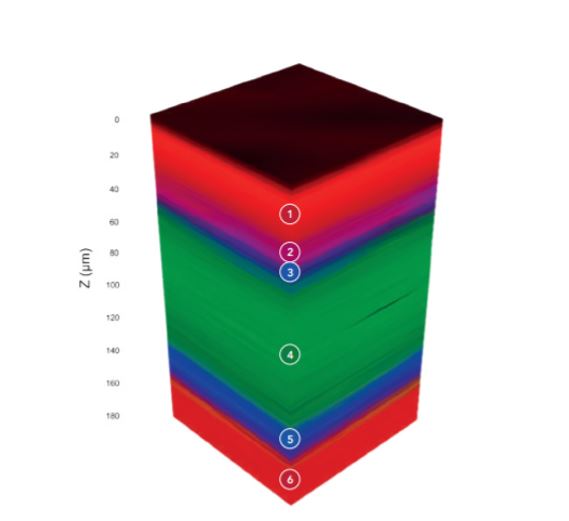
Figure 3: 3D Raman map of a nicotine transdermal patch.
The 3D Raman map, Figures 3 & 4, reveals the patch contains 6 layers, the spectrum of each layer can be extracted and analysed for identification. The outer layers of the patch, layers 1 and 6, shown in red, can be identified as poly (ethylene terephthalate) (PET) using the KnowItAll Raman Database. The 3D map is coloured based on peaks specific to the material identified, for example for the layers of PET the peak at 1293 cm-1 was selected. Layer 2 can be identified as PET/polyisobutylene, labelled in pink, based on the 1233 cm-1 peak and layers 3 and 5 which surround the API were determined to be polyethylene (PE), highlighted in blue from its peak at 1442 cm-1. Finally, in the middle of the polymers is a thick layer of the API, nicotine, embedded in polymer reservoir (ethylene). This is shown in green and is attributed to peaks at 1045 cm-1 and 1030 cm-1. Layer 1 is the release liner of the patch; this is removed before application and is responsible for protecting the medication and adhesive. Layer 2 is the adhesive part of the nicotine patch, layers 3 and 5 are microporous PE which control the release of the API in layer 4. Layer 6 is the backing which provides protection to the medication whist the patch is being worn.
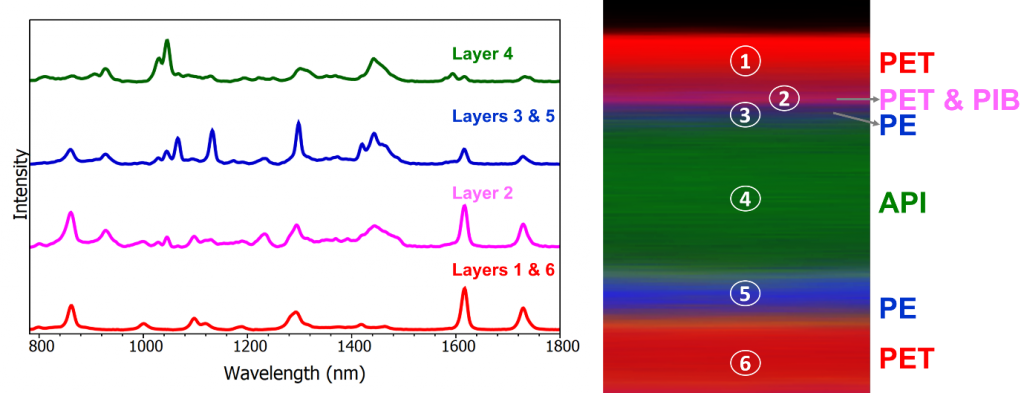
Figure 4: Left- Raman spectra from each component. Right – XZ cross section of the sample.
Conclusion
This application note demonstrated how the RMS1000 Raman Microscope can be used for 3D mapping of a nicotine transdermal patch. The API can be visualised, in this case nicotine, as can the surrounding polymers responsible for protecting and ensuring the release of the API. Thanks to the fingerprint like chemical identification offered by Raman spectroscopy the different polymers can be differentiated, and their thickness assessed. In this way confocal Raman Microscopy is a useful technique for pharmaceutical laboratories to quality control their products ensuring they have been produced correctly without contaminants and help monitor the stability of adhesive layers.
