


Detection of Singlet Oxygen by Photoluminescence Spectroscopy
Key Points
- Photoluminescence spectroscopy is an excellent technique for the direct detection of singlet oxygen (1O2).
- 1O2 measurements require a combination of sensitive instrumentation, high-intensity excitation sources and photon-counting detectors.
- Time-resolved photoluminescence gives the radiative lifetime of 1O2 giving an insight into its reaction dynamics.
Introduction
Singlet oxygen (1O2) is the lowest excited state of molecular oxygen. It is an unstable species which reacts quickly with its environment generating oxidised products. The high reactivity of 1O2 means that it has many applications such as photodynamic treatment of cancer, fine chemical synthesis, and treatment of wastewater.1 In these applications, 1O2 is produced using a photosensitiser (PS), a photoactive dye that is excited into a singlet state by UV or visible light, and then transitions into a triplet state via intersystem crossing. The PS triplet state reacts with triplet oxygen (3O2) in solution to produce 1O2 which can be quenched by other species or emit luminescence (Figure 1).
There are many parameters affecting the yield of 1O2: the choice of PS, solvent, concentration, and photoexcitation energy. Each must be optimised for the application, and a method to directly measure 1O2 is extremely useful during this optimisation process.
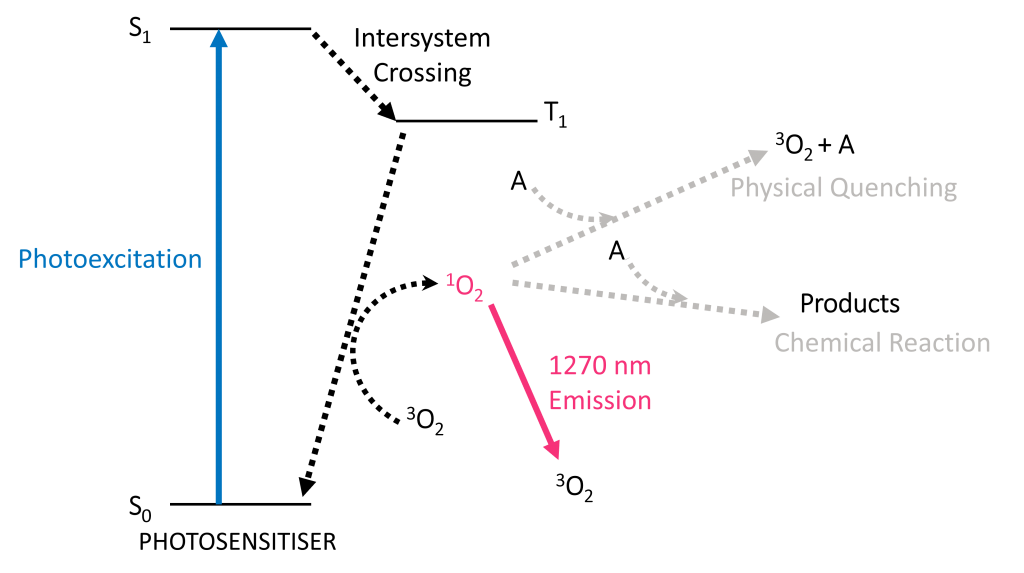
Figure 1. Production of 1O2 using a photosensitiser and deactivation pathways in solution. A is any species that can deactivate 1O2 by collision (physical quenching) or reaction (chemical quenching).
1O2 has a weak photoluminescence (PL) emission band at ~1270 nm with a natural bandwidth of ~18 nm. As the signal at 1270 nm is weak, detection of 1O2 emission requires sensitive near infrared (NIR) detectors. Lifetime measurements are only possible if the detector provides sub-microsecond resolution (the radiative lifetime of 1O2 is commonly 1 µs – 100 µs in solution).
Even with suitable detectors, a powerful excitation source and an efficient optical system are essential. In this application note, an Edinburgh Instruments FLS1000 Photoluminescence Spectrometer is used to characterise the PL spectrum and lifetime of 1O2 in solution. Different excitation sources and detectors are compared to determine the best FLS1000 configuration for 1O2 detection.
Methods and Materials
A 1O2 sample was prepared by dissolving the photosensitiser rose bengal in acetonitrile to an optical density of 0.1 at 510 nm and ~0.5 at 560 nm and loaded into a quartz cuvette. The solution was saturated with air prior to measurements.
Emission spectra were measured in an FLS1000 Photoluminescence Spectrometer (Figure 2) equipped with a 450 W Xe lamp, 60 W microsecond flashlamp, VPL-510 variable pulse laser diode, cuvette holder, double excitation monochromator, single emission monochromator, NIR PMT detector, and an InGaAs detector. An additional long-pass filter with a cutoff wavelength of 1200 nm was placed between the sample and the emission monochromator. In addition a frequency-doubled Nd:YAG laser (Litron Nano S 130-10) was coupled to the sample chamber of the FLS1000. The laser provided 532 nm pulses of 5 – 7 ns with a frequency of 10 Hz.
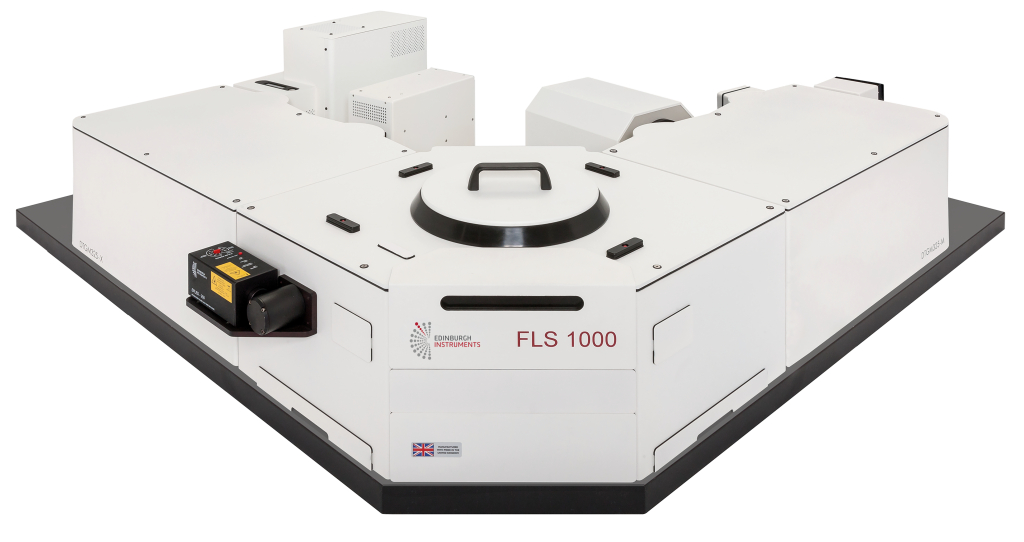
Figure 2. FLS1000 Photoluminescence Spectrometer.
Singlet Oxygen Emission Spectrum
Detector Sensitivity Comparison
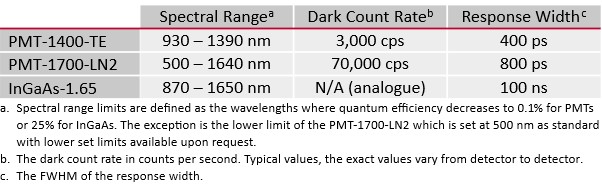
The FLS1000 Spectrometer has several NIR detector options for measuring the spectrum of 1O2. The three detectors compared in this technical note are: a thermoelectric (TE) cooled PMT-1400-TE, a liquid nitrogen-cooled PMT-1700-LN, and an InGaAs-1.65 analogue detector.
Table 1. Specifications of the NIR PMT and InGaAs detectors.
The intensity of 1O2 luminescence is directly proportional to the efficiency of the PS. The lower the yield of 1O2, the more sensitive the instrumentation required to detect it. In the case of rose bengal in acetonitrile, a narrow emission band near 1270 nm from 1O2 is easily identified with all three detectors but with different signal-to-noise ratios (SNR). Figure 3 shows the peak-normalised emission spectra acquired under identical conditions.
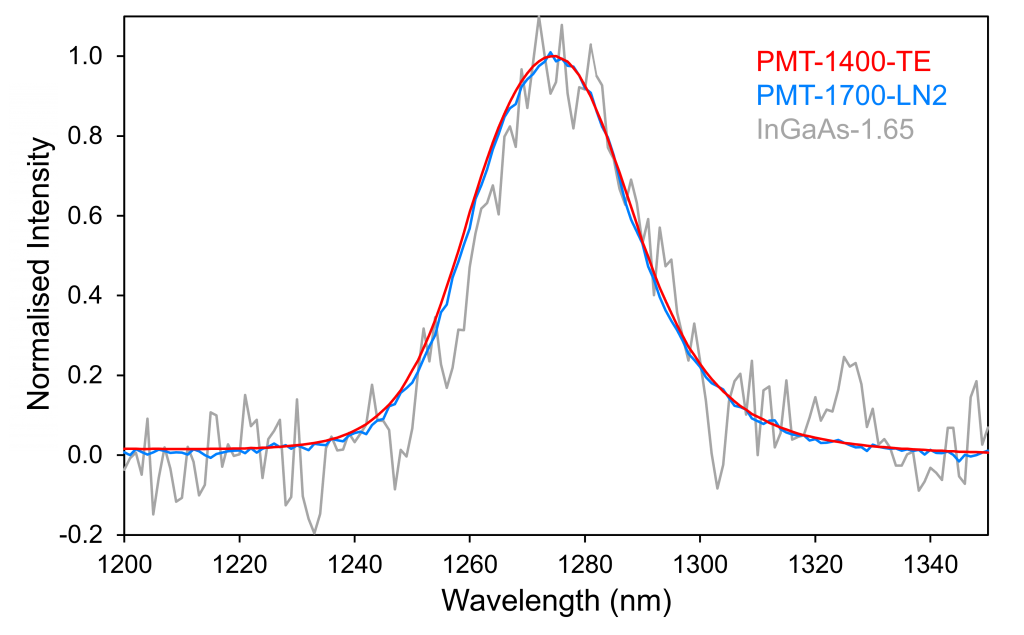
Figure 3. Peak-normalised emission spectra of 1O2 produced by excitation of rose bengal in acetonitrile. Excitation with a VPL-510 laser operating in CW mode at 510 nm and detection with PMT-1400-TE, PMT-1700-TE, and InGaAs-1.65 detectors. The experimental conditions were Δλem=30 nm, integration time 2 s/step and step of 1 nm for all traces.
Comparing the normalised spectra in Figure 3, the photon-counting PMTs have a clear advantage over the InGaAs detector. The principal reason is their lower noise: photon-counting detectors are only affected by Poisson noise so the background in the SNR calculation is the square root of the dark counts. In contrast, the InGaAs is a non-photon counting detector and therefore has a higher noise floor and lower SNR than the PMTs.
The TE and LN-cooled NIR PMTs are compared in detail in a separate Technical Note2 To achieve the same SNR as with PMT-1400-TE, the PMT-1700-LN detector requires measurement times 20 times longer and the InGaAs-1.65 requires over 100 times longer.
Excitation Source Comparison
The choice of excitation source is just as important as the detector. The traditional source for PL excitation is a Xe lamp coupled to a monochromator giving tunable wavelength excitation. When variable wavelength is not required, a CW laser can be used for excitation. Lasers can be of higher power than the Xe lamp and, depending on the model, can also be pulsed for PL lifetime measurements.
Figure 4 compares the intensities of 1O2 luminescence generated with a Xe lamp and a VPL-510 laser, both fitted to the FLS1000 Spectrometer. The lamp-excited spectrum was acquired with an excitation wavelength of 560 nm (absorption maximum of rose bengal). The VPL-510 source excites rose bengal at 510 nm, away from the maximum. Despite this, the VPL-excited spectrum is more intense.
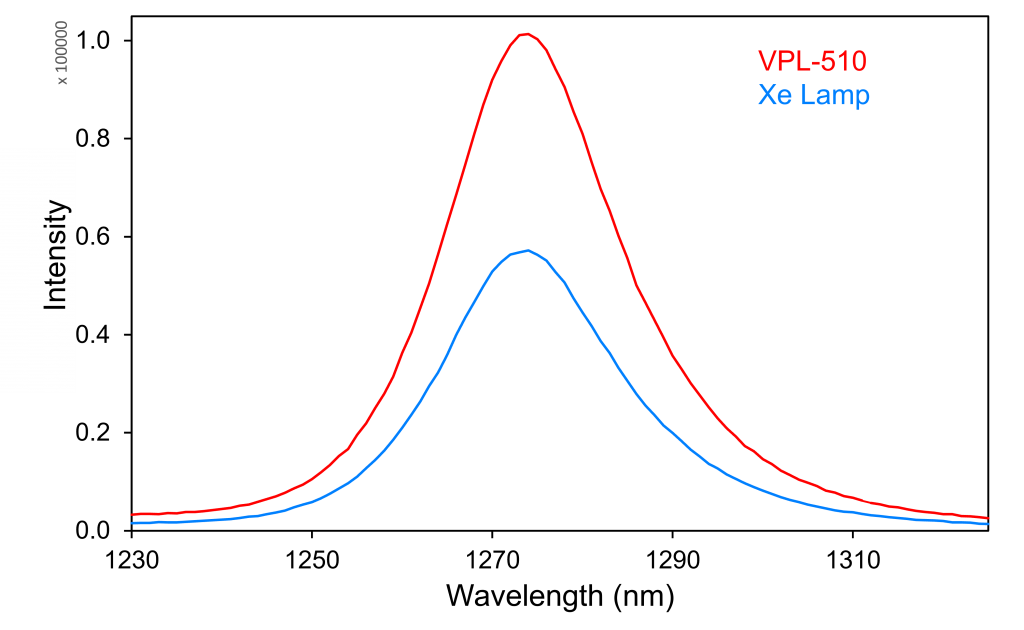
Figure 4. Raw emission spectra of 1O2 produced by excitation of rose bengal in acetonitrile. Excitation with a CW VPL-510 laser at 510 nm and a Xe lamp on the FLS1000 double monochromator (λex=560 nm, Δλex=10 nm). Detection with PMT-1400-TE. The experimental conditions were Δλem=10 nm, integration time 2 s/step and step of 1 nm for both traces.
Based on the above comparison, the ideal configuration for spectral 1O2 measurements would be:
- A PMT-1400-TE for the best sensitivity.
- An excitation monochromator and Xe lamp for flexibility.
- A double monochromator is recommended for improved stray light rejection.
- If studying known photosensitisers, at least one CW laser near the absorption peak of the PS for maximising the yield of 1O2.
Singlet Oxygen Emission Lifetime
The lifetime of 1O2 in solution depends on its chemical environment. Many reactions, as well as non-reactive quenching, can occur in parallel making it difficult to predict its lifetime. The most reliable method is to directly measure its radiative lifetime using a time-resolved PL spectrometer equipped with a photon-counting detector. 1O2 decays in this section were measured with a PMT-1400-TE detector in the FLS1000.
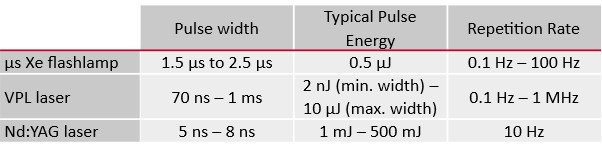
1O2 luminescence decays over a few microseconds and can be measured using multi-channel scaling (MCS). The FLS1000 can be equipped with a range of MCS sources such as a µs Xe flashlamp, Nd:YAG lasers with high-energy nanosecond pulses, and diode lasers with variable pulse widths (VPL series). A comparison between the Xe flashlamp, VPL, and Nd:YAG lasers is shown in Table 2. Higher pulse energies and repetition rates mean faster measurements. Wider pulses mean higher energy and therefore faster acquisition, but at the expense of time resolution.
Table 2. MCS source options in FLS1000 and typical performance.
The radiative lifetime of 1O2 was characterised with two sources: a 60 W Xe flashlamp on the excitation monochromator and a VPL-510 variable pulse laser diode mounted on the sample chamber. The Xe flashlamp offers the advantage of tunable wavelength and excitation bandwidth, while the VPL source has a fixed wavelength but allows varying the pulse width between 70 ns and 1 ms. In this case, VPL-510 and Xe flashlamp yield comparable 1O2 decays, as seen in Figure 5(a) and (b), respectively. Figure 5(c) shows how the VPL-510 pulse width can be adjusted to increase the signal intensity.
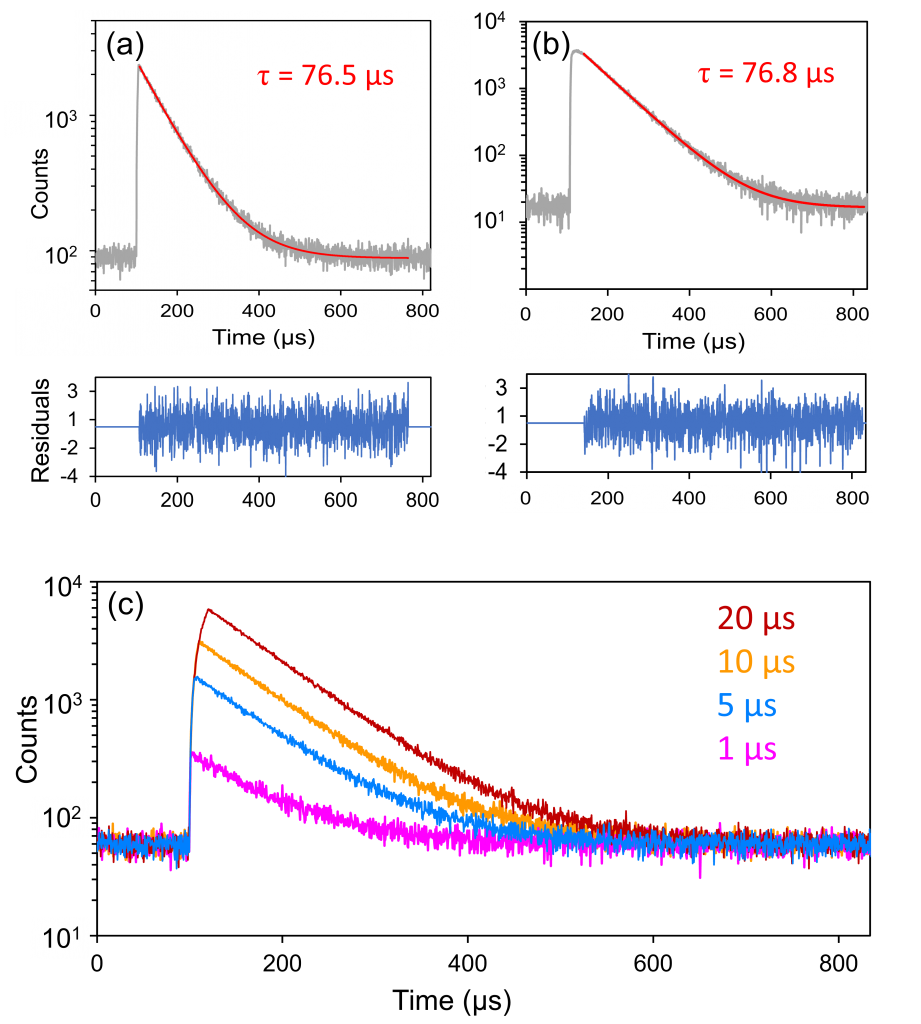
Figure 5. MCS decays of 1O2 acquired in FLS1000 with (a) a VPL-510 and (b) a Xe flashlamp for excitation. Exponential fit results are shown in the graphs. The effect of varying VPL-510 pulse width is shown in (c) with PL decays acquired for the same amount of time, pulse widths indicated in the graph. Measurement conditions: (a) λex = 510 nm, λem = 1275 nm, Δλem = 30 nm, repetition rate = 1 kHz, 15 minutes acquisition. (b) λex = 560 nm, Δλex = 5 nm, λem = 1275 nm, Δλem = 30 nm, repetition rate = 100 Hz, 15 minutes acquisition. (c) λex = 510 nm, λem = 1275 nm, Δλem = 30 nm, repetition rate = 1 kHz, 10 minutes acquisition per decay.
Samples with a low yield of 1O2 need higher excitation energies to detect PL. In these cases, a pulsed Nd:YAG laser or optical parametric oscillator (OPO) may be coupled to an FLS1000 Spectrometer for short, high-energy excitation pulses. Figure 6 shows an MCS decay of 1O2 obtained with a Nd:YAG laser and a PMT-1400-TE. The laser energy was attenuated to 5 mJ and the emission bandwidth was set to 3 nm to avoid saturating the MCS electronics. The result is a decay with comparable intensity to Figure 5. As the sample is relatively bright, the acquisition speed is restricted by the 10 Hz rate of the laser and the saturation limit of the MCS electronics.
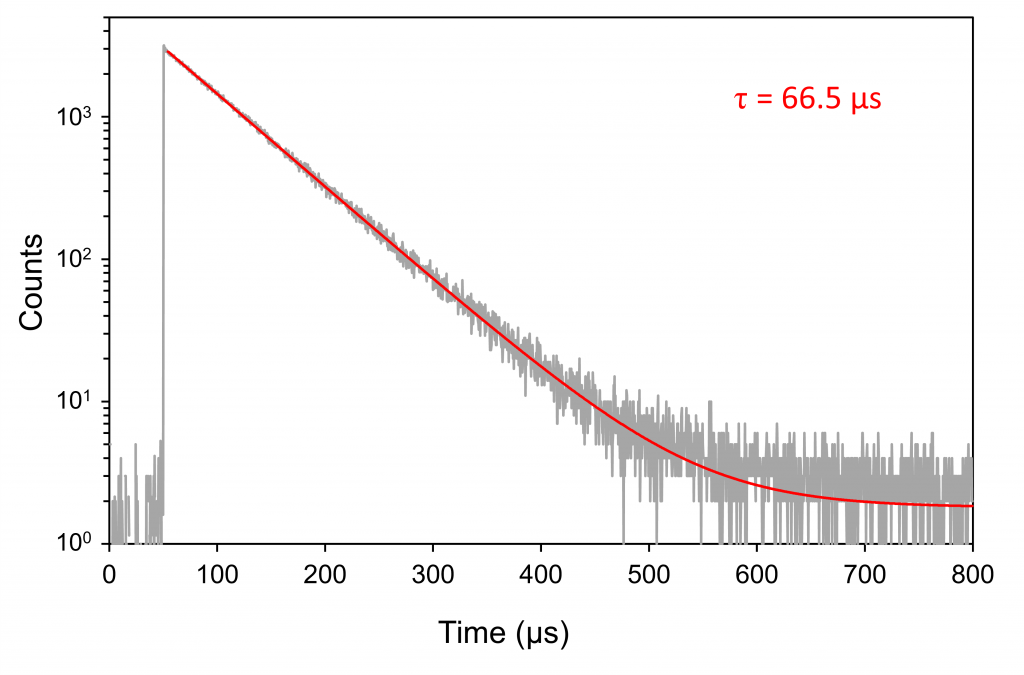
Figure 6. MCS decay from 1O2 acquired in FLS1000 exciting with 532 nm Nd:YAG laser pulses (laser scatter subtracted from the data). The data was acquired with a different sample from Figure 5 (1O2 lifetime depends on the degree of air saturation and PS concentration). The exponential fit result is shown in the graph. Measurement conditions: laser energy = 5 mJ/pulse, repetition rate = 10 Hz, λem = 1275 nm, Δλem = 3 nm, 20 minutes acquisition.
As shown in this section the optimal FLS1000 configuration for time-resolved 1O2 luminesce
- Samples with a low yield of 1O2 benefit from a high-energy excitation source such as a Nd:YAG laser or OPO. For relatively high yields of 1O2, a µs Xe flashlamp or VPL laser is the best choice.
- The combination of flashlamp and monochromator offers wavelength and bandwidth tunability and is best for studying many samples with the same configuration.
- A VPL laser gives the benefit of higher repetition rate and longer pulses at a single wavelength.
Conclusion
Singlet oxygen detection requires a high-performance PL spectrometer such as the Edinburgh Instruments FLS1000 configured with lasers and sensitive detectors. Analogue InGaAs detectors can be used for spectral measurements but photon-counting PMTs are recommended. Pulsed light sources and PMTs are essential for time-resolved luminescence of 1O2.
References
- DeRosa, Maria C., and Robert J. Crutchley. Photosensitized singlet oxygen and its applications, Coordination Chemistry Reviews 233 351-371 (2002)
- Thomson, Stuart. Near Infrared PMT Options for the FLS1000 Photoluminescence Spectrometer, Edinburgh Instruments Technical Note AN_P82 (2023)
