


Temperature-Dependent Absolute Photoluminescence Quantum Yield (PLQY) Measurements of a Halide Perovskite
Introduction
Metal halide perovskites are a promising class of materials for a wide variety of optoelectronic applications such as photovoltaics, light emitting diodes (LEDs), lasers and optical sensing.1 They have received widespread attention due to their many attractive synthetic and photophysical properties, namely: solution processability, high tunability, long charge carrier lifetimes and high charge carrier mobilities. Perovskite photovoltaic cells have reached an efficiency of 21% in a remarkably short period of time and are beginning to challenge the dominance of silicon.2 For light emission, perovskite nanocrystals have been shown to possess excellent wavelength tunability and high PLQY,3 while two dimensional perovskite structures have been shown to be promising single component white light emitters.4 One of the most important photophysical parameters of perovskites for optoelectronic applications is the photoluminescence quantum yield (PLQY), which is investigated using the FLS1000 Photoluminescence Spectrometer equipped with the Cryosphere accessory in this application note.
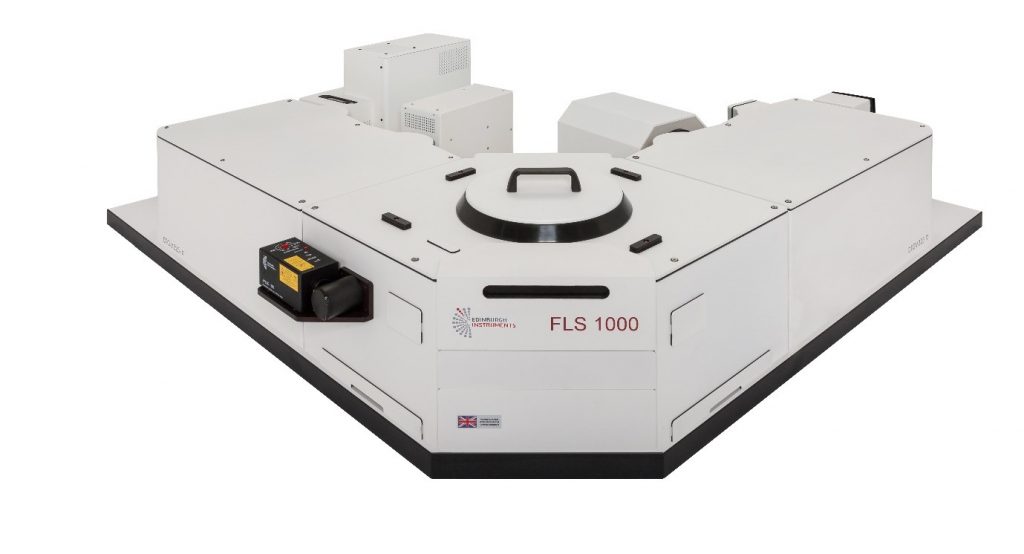
Figure 1. FLS1000 Photoluminescence Spectrometer with double excitation and emission monochromators.
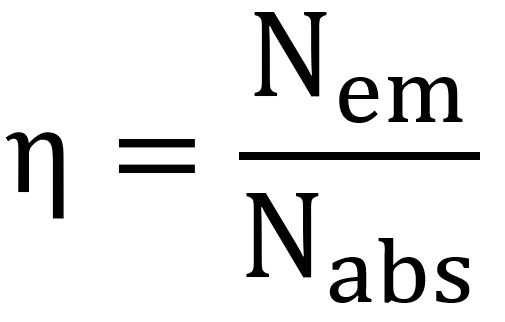
The PLQY of a material is the ratio of the number of photons emitted by that material (Nem), to the number of photons that were absorbed (Nabs), and is denoted by ,
 |
(1) |
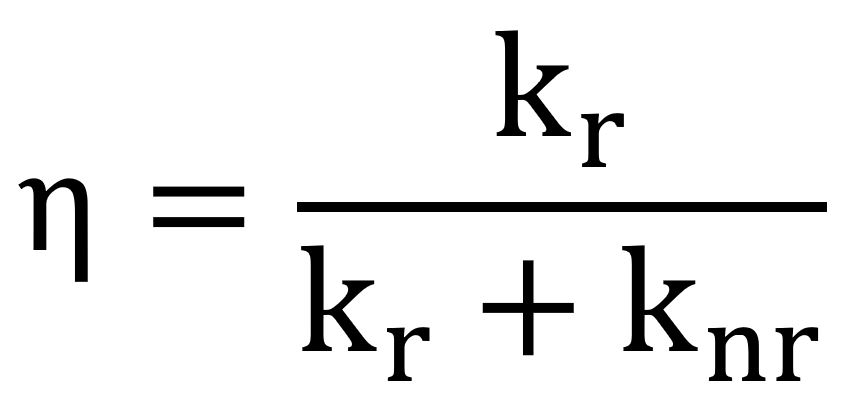
The PLQY is a measure of the competition between the radiative and non-radiative pathways in the material after photoexcitation and the PLQY can therefore also be expressed as,
 |
(2) |
where and knr are the radiative recombination and non-radiative recombination rates respectively.
The PLQY is a critical material parameter for the successful operation of optoelectronic devices. Emitter materials for use in light emitting diodes should have a high PLQY, as minimisation of the non-radiative recombination rate will enable the creation of devices with higher electroluminescence external quantum efficiency. PLQY measurements are therefore an effective method of screening and optimising new potential emitters for LEDs, as materials with low PLQY will result in inefficient LEDs and can be discarded.
PLQY is also an important parameter for creating efficient photovoltaic cells. The maximum open circuit voltage (VOC) of a photovoltaic cell can only be achieved when all recombination inside the cell is radiative. The theoretical maximum VOC of the widely studied methylammonium lead iodide (MAPI) photovoltaic cell is 1.32 V under 1 sun illumination.5 However, at present the VOC of MAPI cells remains below 1.1 V, corresponding to a loss of 200 mV due to non-radiative recombination.5,6 PLQY measurements can provide insight into these non-radiative losses and aid in material optimisation.
To measure the PLQY at room temperature, an integrating sphere is the most accurate option. However, working optoelectronic devices are exposed to a wide range of temperatures that can depart substantially from the ambient temperature of a laboratory. Photovoltaic cells in particular are exposed to extremes in temperature, with ambient temperatures ranging from -20°C to 40°C. In addition, the working temperature inside the cell can greatly exceed the ambient temperature due to heating from solar irradiation, and has been shown to be as high as 70°C in some cases.7 It is therefore important to understand the influence that temperature has on the PLQY of optoelectronic devices.
To measure the temperature dependence of PLQY, Edinburgh Instruments has developed a variable temperature integrating sphere, the Cryosphere, which is capable of measuring the PLQY of solid samples over a temperature range of 77 K to 500 K. By using an integrating sphere, both the change in absorption coefficient and change in PL intensity with temperature are accounted for. In this application note the temperature dependence of the PLQY of the perovskite emitter CsPbBr3 is measured using the FLS1000 with the Cryosphere accessory.
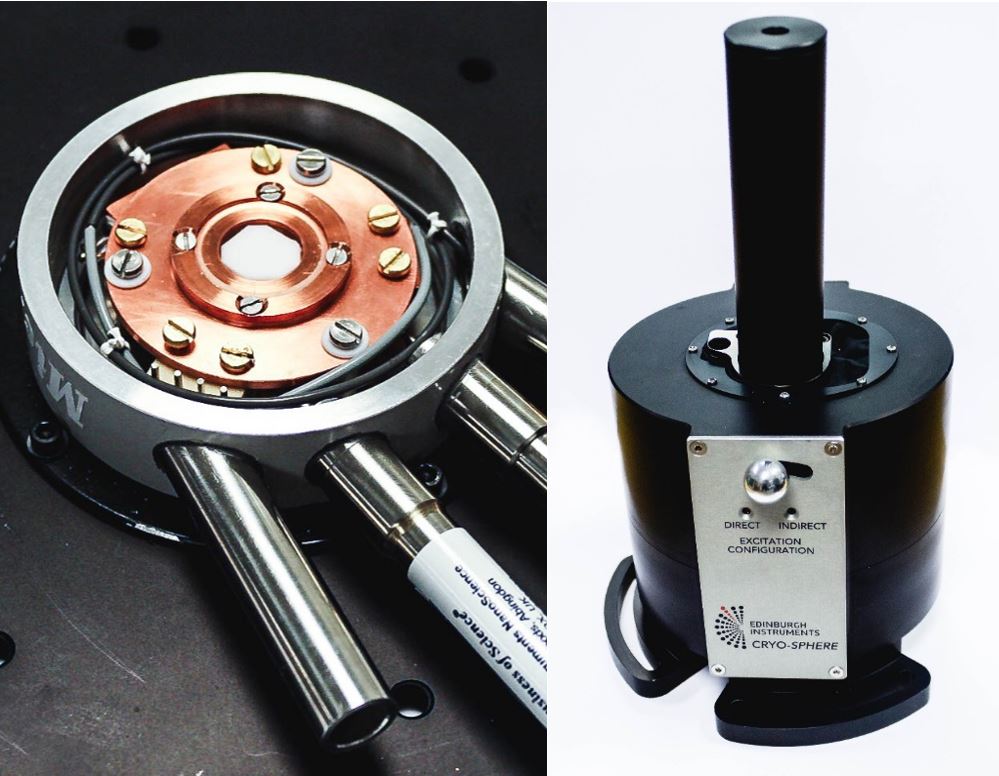
Figure 2. Sample holder (left) and integrating sphere (right) of the Cryosphere.
Methods & Materials
A single crystal of CsPbBr3 was synthesised using the route described in Stoumpos et al.8 The PLQY was measured using a Cryosphere that was fibre optically coupled to an FLS1000 Photoluminescence Spectrometer. The FLS1000 was equipped with double monochromators, a 450 W Xenon lamp and a PMT-900 detector. The sample space was evacuated using a turbomolecular pump and temperature control provided by a continuous flow liquid nitrogen cryostat.
Results & Discussion
CsPbBr3 was excited at 430 nm and the emission and scattering peaks measured in the Cryosphere over a temperature range of 80 K to 250 K. In addition, the scattering and emission peaks of a PTFE plug were measured to serve as a reference. The change in CsPbBr3 emission with temperature is shown in Figure 3. It can be seen that the PL has a maxima at 530 nm with a shoulder peak at 545 nm which is consistent with previous reports.8 As the temperature is decreased the intensity of the PL increases, indicating a change in the PLQY of the material with temperature.
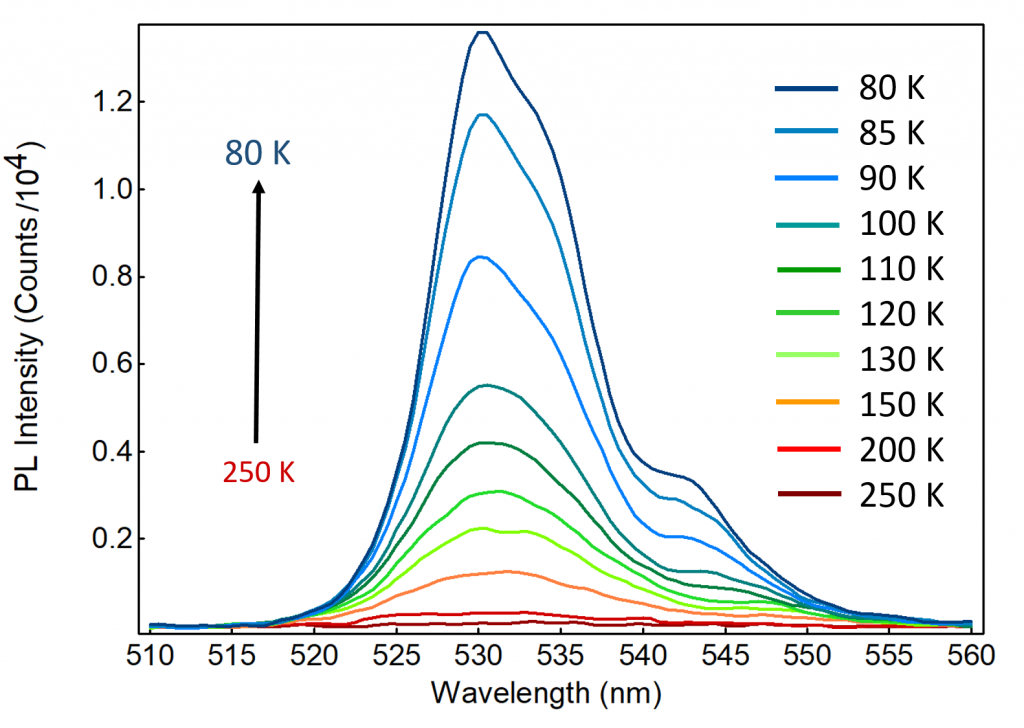
Figure 3. Variation of the photoluminescence emission spectrum of CsPbBr3 with temperature. The emission spectra were measured using the Cryosphere accessory for the FLS1000. Excitation source = 450 W Xenon Lamp, λex = 430 nm, Δλex = 7 nm, Δλem = 2 nm.
The PLQY of the sample was calculated at each temperature using the quantum yield wizard of the FLS1000’s Fluoracle® operating software. The user selects the desired emission and scattering spectra and sets the integration ranges, and Fluoracle then integrates over the spectra to determine the quantum yield. The interface of the quantum yield wizard is shown in Figure 4 for the measurement taken at 80 K. The scatter from the reference (black), scatter from the sample (blue), background emission from reference (orange), and emission from sample (red) were measured as four separate scans and combined in the quantum yield wizard.
The emission and scattering peaks were recorded separately to allow an OD1.5 neutral density filter to be placed in the excitation light path when measuring the scattering peaks. By placing a neutral density filter in the excitation light path the monochromator bandwidths can be increased, which improves the signal-to-noise of the emission peak measurements, without the scattering peaks saturating the detector. The intensities of the scattering peaks are then scaled by the transmission coefficient of the neutral density filter during post processing. This approach is recommended when measuring the PLQY of weakly emitting samples.
The background emission from the reference must be scaled to take into account the higher intensity of scattered light in the sphere when the reference is present, which causes a higher background emission signal. Fluoracle therefore contains the option to automatically scale the background emission by the ratio of sample and reference scattering peak heights, which results in the scaled reference background shown in green, and allows accurate background subtraction during the PLQY calculation.
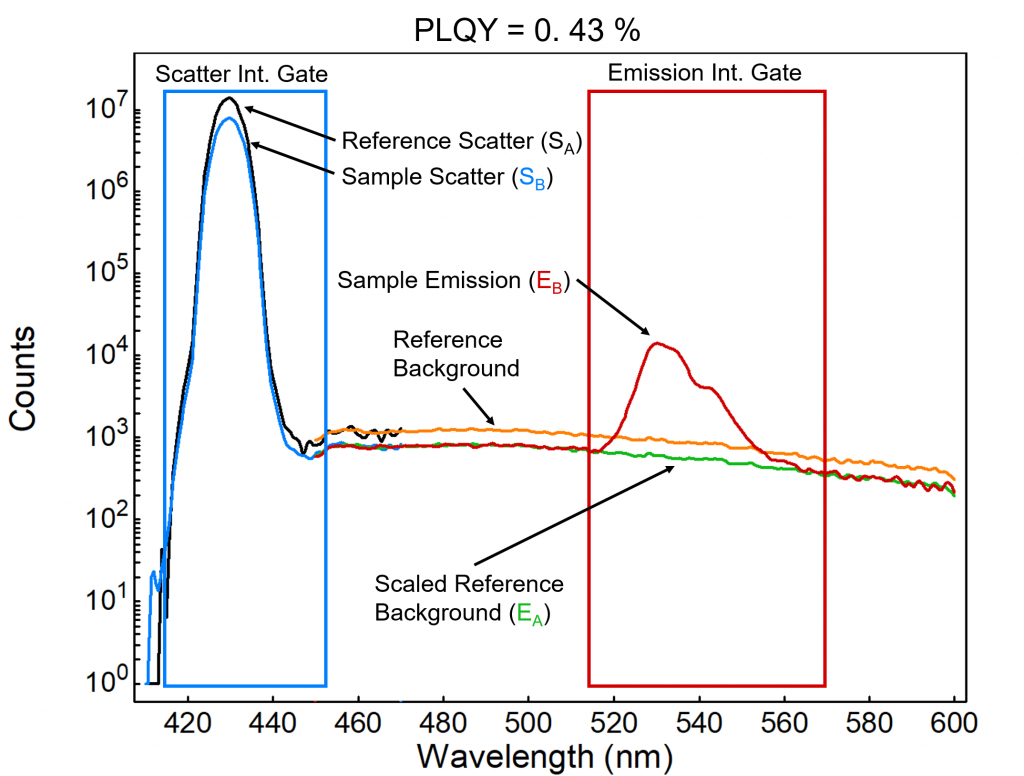
Figure 4. Scattering and emission peaks of the reference and the CsPbBr3 sample at 80 K, analysed using the Fluoracle quantum yield wizard. Excitation source = 450 W Xenon Lamp, λex = 430 nm, Δλex = 7 nm, Δλem = 2 nm. The scattering peaks were recorded with an OD1.5 neutral density filter in the excitation light path and then scaled by the transmission coefficient of the filter during post processing.
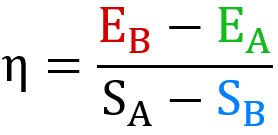
The PLQY of the sample is calculated automatically by Fluoracle using,
 |
(3) |
where , , , are the integrated intensities of the emission and scattering peaks of the reference and sample respectively. The ratio of the CsPbBr3 and reference scattering peaks were found to be approximately constant with temperature which indicates that the absorbance of the sample does not appreciably change over the temperature range studied. The increase in photoluminescence intensity observed in Figure 3 when the sample is cooled must therefore be due to an increase in PLQY.
The PLQY calculation was repeated for all temperatures, using the same integration gates as shown in Figure 4, to give the variation in PLQY with temperature which is shown in Figure 5. It can be seen that the PLQY increases nonlinearly from 0.02% at 200 K to 0.43% at 80 K. This increase in PLQY is due to the charge carriers becoming immobile as the temperature is lowered, and therefore increasingly unable to reach the non-radiative recombination centres (defects) that are present in the perovskite. Instead the carriers must combine radiatively which gives rise to an increase in PLQY with decreasing temperature.
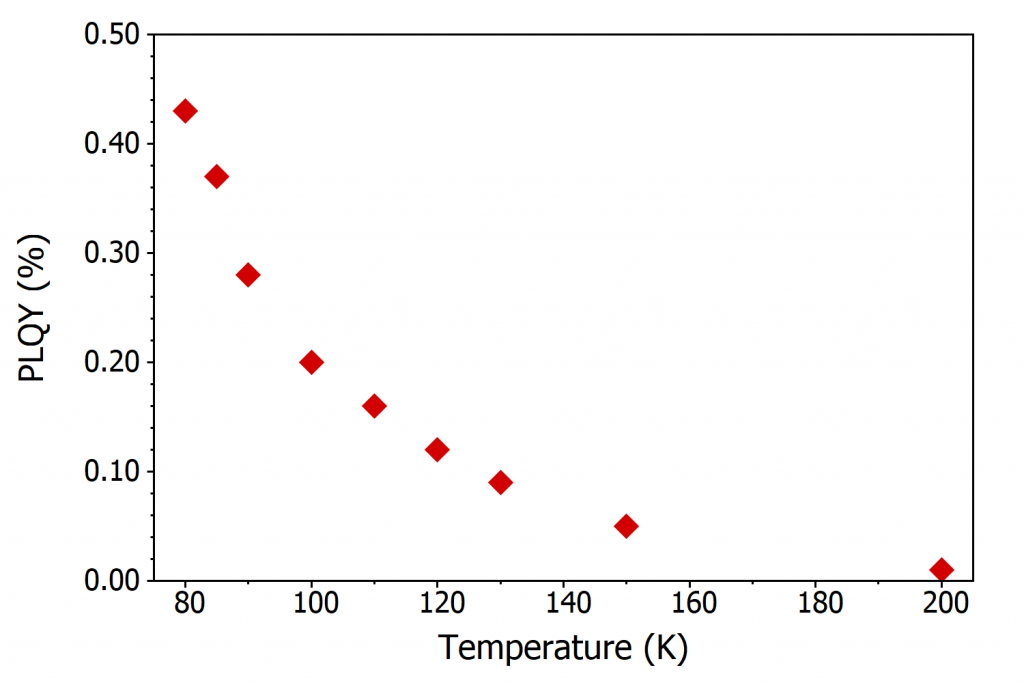
Figure 5. Temperature dependence of the PLQY of CsPbBr3, measured using the Cryosphere accessory for the FLS1000. The PLQY was calculated using the quantum yield wizard in Fluoracle.
Conclusion
The influence of temperature on the photoluminescence quantum yield of CsPbBr3 perovskite was investigated using the Cryosphere accessory for the FLS1000. The PLQY was found to increase from 0.02% to 0.43% as the perovskite was cooled from 200 K to 80 K which corresponds to a suppression of non-radiative recombination mechanisms. This application note demonstrates that the Cryosphere is a powerful tool for investigating how the loss mechanisms in optoelectronic devices are influenced by temperature.
Acknowledgements
We are grateful to Dr. I. Hadar and Prof. M. G. Kanatzidis from Northwestern University for providing the CsPbBr3 sample used in this study.
References
- Docampo and T. Bein, A Long-Term View on Perovskite Optoelectronics, Acc. Chem. Res. 49, 339–346 (2016)
- A. Green, Y. Hishikawa, E. D. Dunlop, D. H. Levi, J. Hohl-Ebinger, and A. W. Y. Ho-Baillie, Solar Cell Efficiency Tables (Version 51), Prog. Photovolt. Res. Appl. 26, 3–12 (2018)
- Du, G. Wu, J. Cheng, H. Dang, K. Ma, Y. Zhang, Pe. Tana and S. Chen, High-Quality CsPbBr3 Perovskite Nanocrystals for Quantum Dot Light-Emitting Diodes, RSC Adv. 7 10391-10396 (2017)
- D. Smith, and H. I. Karunadasa, White-Light Emission from Layered Halide Perovskites, Acc. Chem. Res. 51, 619-627 (2018)
- Tress, N. Marinova, O. Inganäs, M. K. Nazeeruddin, S. M. Zakeeruddin, M. Graetzel, Predicting the Open-Circuit Voltage of CH3NH3PbI3 Perovskite Solar Cells Using Electroluminescence and Photovoltaic Quantum Efficiency Spectra: The role of Radiative and Non-Radiative Recombination, Adv. Energy Mater. 5, 1400812 (2015)
- Gil-Escrig, G. Longo, A. Pertegás, C. Roldán-Carmona, A. Soriano, M. Sessolo and H. J. Bolink, Efficient Photovoltaic and Electroluminescent Perovskite Devices, Chem. Commun. 51, 569-571 (2015)
- Skoplaki, A. G. Boudouvis and J. A. Palyvos, A Simple Correlation for the Operating Temperature of Photovoltaic Module of Arbitrary Mounting, Sol. Energy Mater Sol. Cells 92, 1393-1402 (2008)
- C. C. Stoumpos, C. D. Malliakas, J. A. Peters, Z. Liu, M. Sebastian, J. Im, T. C. Chasapis, A. C. Wibowo, D. Y. Chung, A. J. Freeman, B. W. Wessels, and M. G. Kanatzidis, Crystal Growth of the Perovskite Semiconductor CsPbBr3: A New Material for High-Energy Radiation Detection, Cryst. Growth Des. 13, 2722−2727 (2013)
Sign-Up for our Application and Technical Notes
If you have enjoyed reading our Application Note, why not sign-up to our newsletter via our red Sign-up button below.
