


Fluorescence, Delayed Fluorescence and Phosphorescence Spectra of a TADF Emitter Measured using the FLS1000 with a VPL laser and Gated PMT Detector
Introduction
Materials exhibiting thermally activated delayed fluorescence (TADF) have attracted widespread research attention as a new generation of high-efficiency emitters for use in Organic Light Emitting Diodes (OLEDs). In a TADF OLED, triplet excitons are converted to singlet excitons through a thermally assisted reverse intersystem crossing which enables internal quantum efficiencies of 100% to be achieved.
In TADF research the spectra of the fluorescence and phosphorescence components of the emission must be measured in order to assign the origin of the component and calculate the energy splitting between the molecular levels. In this application note, the FLS1000 Photoluminescence Spectrometer equipped with a gated PMT detector and a VPL pulsed diode laser is used to measure the prompt fluorescence, delayed fluorescence and phosphorescence spectra of the TADF emitter CzDBA.1 The VPL series of pulsed diode lasers are a new range of variable pulse length lasers designed by Edinburgh Instruments that are optimised for measuring longer-lived emission such as upconversion, delayed fluorescence and phosphorescence.
Materials & Methods
CzDBA was dissolved in anhydrous toluene at a concentration of 2 x 10⁻⁵ M and loaded into a 10 ml quartz cuvette. Spectra were measured using the FLS1000 Photoluminescence Spectrometer equipped with a gated PMT-900 detector, single photon counting multichannel scaling (MCS) lifetime electronics, a 375 nm variable pulse length diode laser (VPL-375) and a 77 K – 500 K liquid nitrogen cryostat (Oxford Instruments Optistat DN2).
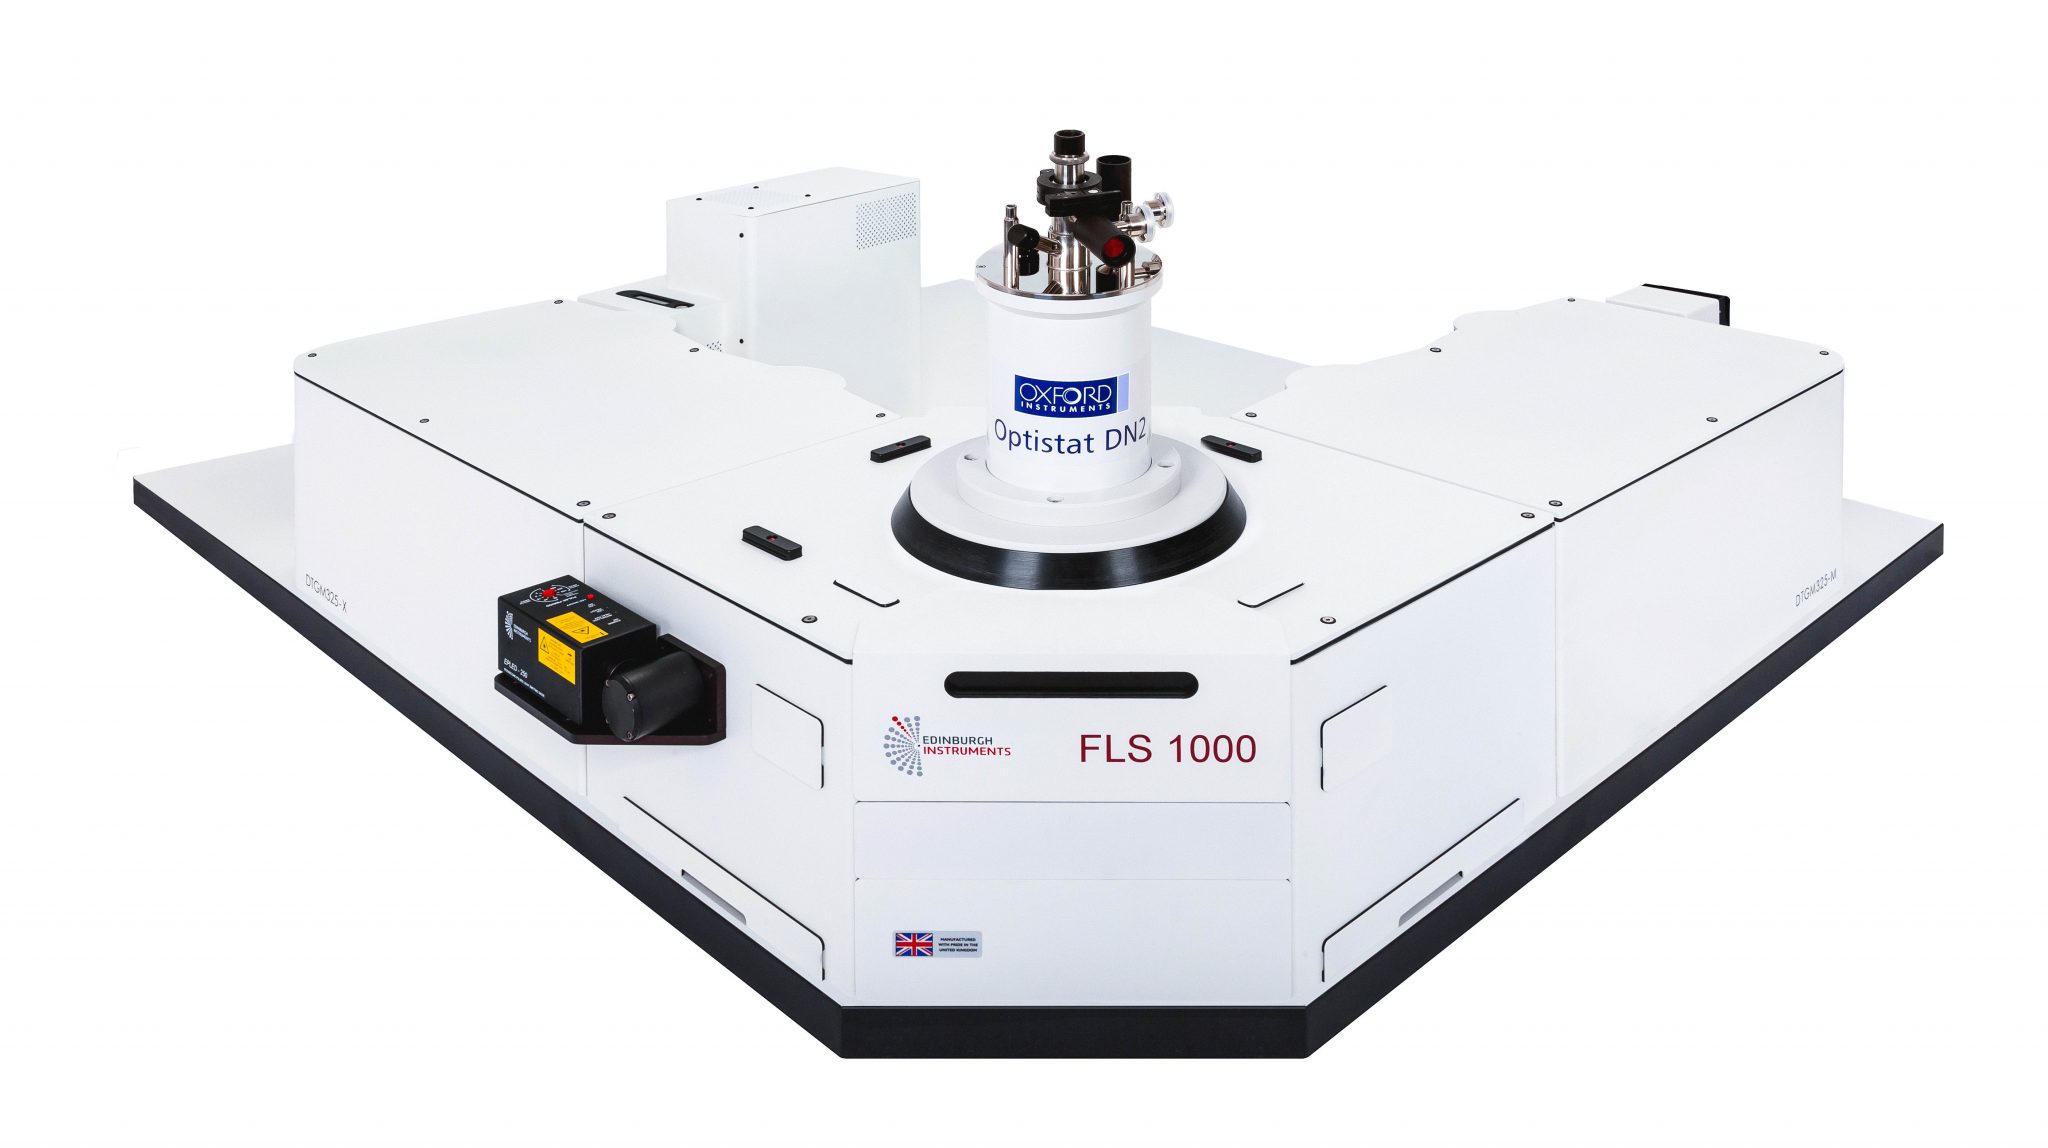
Figure 1: FLS1000 Photoluminescence Spectrometer equipped with an Oxford Instruments liquid nitrogen cryostat for the measurement of low-temperature phosphorescence spectra.
Results & Discussion
Fluorescence and Delayed Fluorescence Spectra measured using TRES at 300 K
At room temperature, photoexcitation of a TADF emitter results in prompt fluorescence emission on nanosecond timescale and delayed fluorescence emission on a microsecond timescale. The prompt and delayed fluorescence decay of CzDBA was measured using single photon counting multichannel scaling (MCS) with a variable pulse length diode laser (VPL-375) as the excitation source (Figure 2).
MCS is a complementary time-resolved technique to the more widely known time-correlated single photon counting (TCSPC) and is the method of choice for measuring delayed fluorescence. In MCS the detection window is split into time intervals and all photons that arrive within a specified time interval are counted, the photons in the next interval are then counted and so on until the entire time range has been covered. This multiple stop mode detection enables higher detection count rates to be used than in TCSPC which reduces the acquisition time of longer decays.
The pulse length of the VPL laser can be adjusted from 100 ns to 1000 μs which allows the pulse length to be optimised to the type of emission being measured. For the decay shown in Figure 2, the pulse length of the VPL was set to 100 ns which is sufficient to deliver sufficient power to the sample without obscuring the delayed fluorescence.
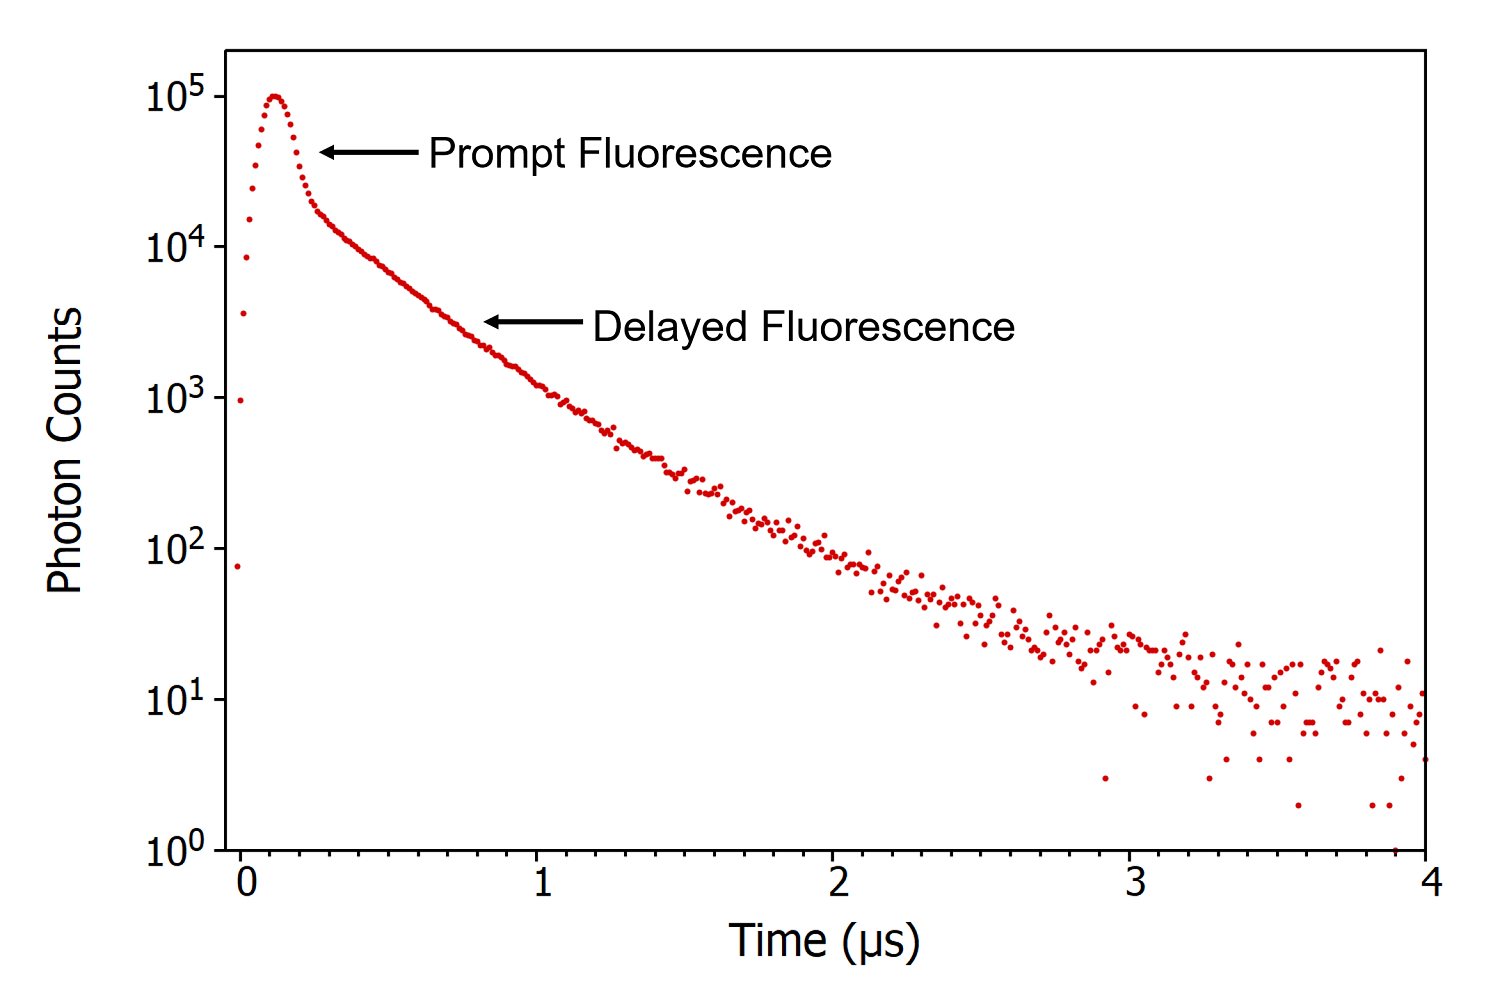
Figure 2: Fluorescence decay of CzDBA solution at 300 K measured using MCS. Experimental Parameters: Excitation Source = VPL-375, Pulse Width = 100 ns, Rep Rate = 100 kHz, λex = 375 nm, λem = 530 nm, Δλem = 2 nm.
The best method to measure the spectra of the prompt and delayed fluorescence components is a time-resolved emission scan (TRES). In a TRES measurement, the fluorescence decay is measured as a function of emission wavelength to build up a three-dimensional time-resolved spectrum (Figure 3a). The VPL is ideal for TRES measurements of delayed fluorescence as its high intensity and repetition rate enable rapid acquisition; with the TRES profile shown in Figure 3 measured in under 15 minutes. To obtain the emission spectra of the prompt and delayed components the TRES profile is integrated using the Fluoracle software of the FLS1000 to give the spectra in a specified time-window. It can be seen that the spectra of the prompt and delayed components are identical which confirms that the delayed component is indeed fluorescence from the S1 state.
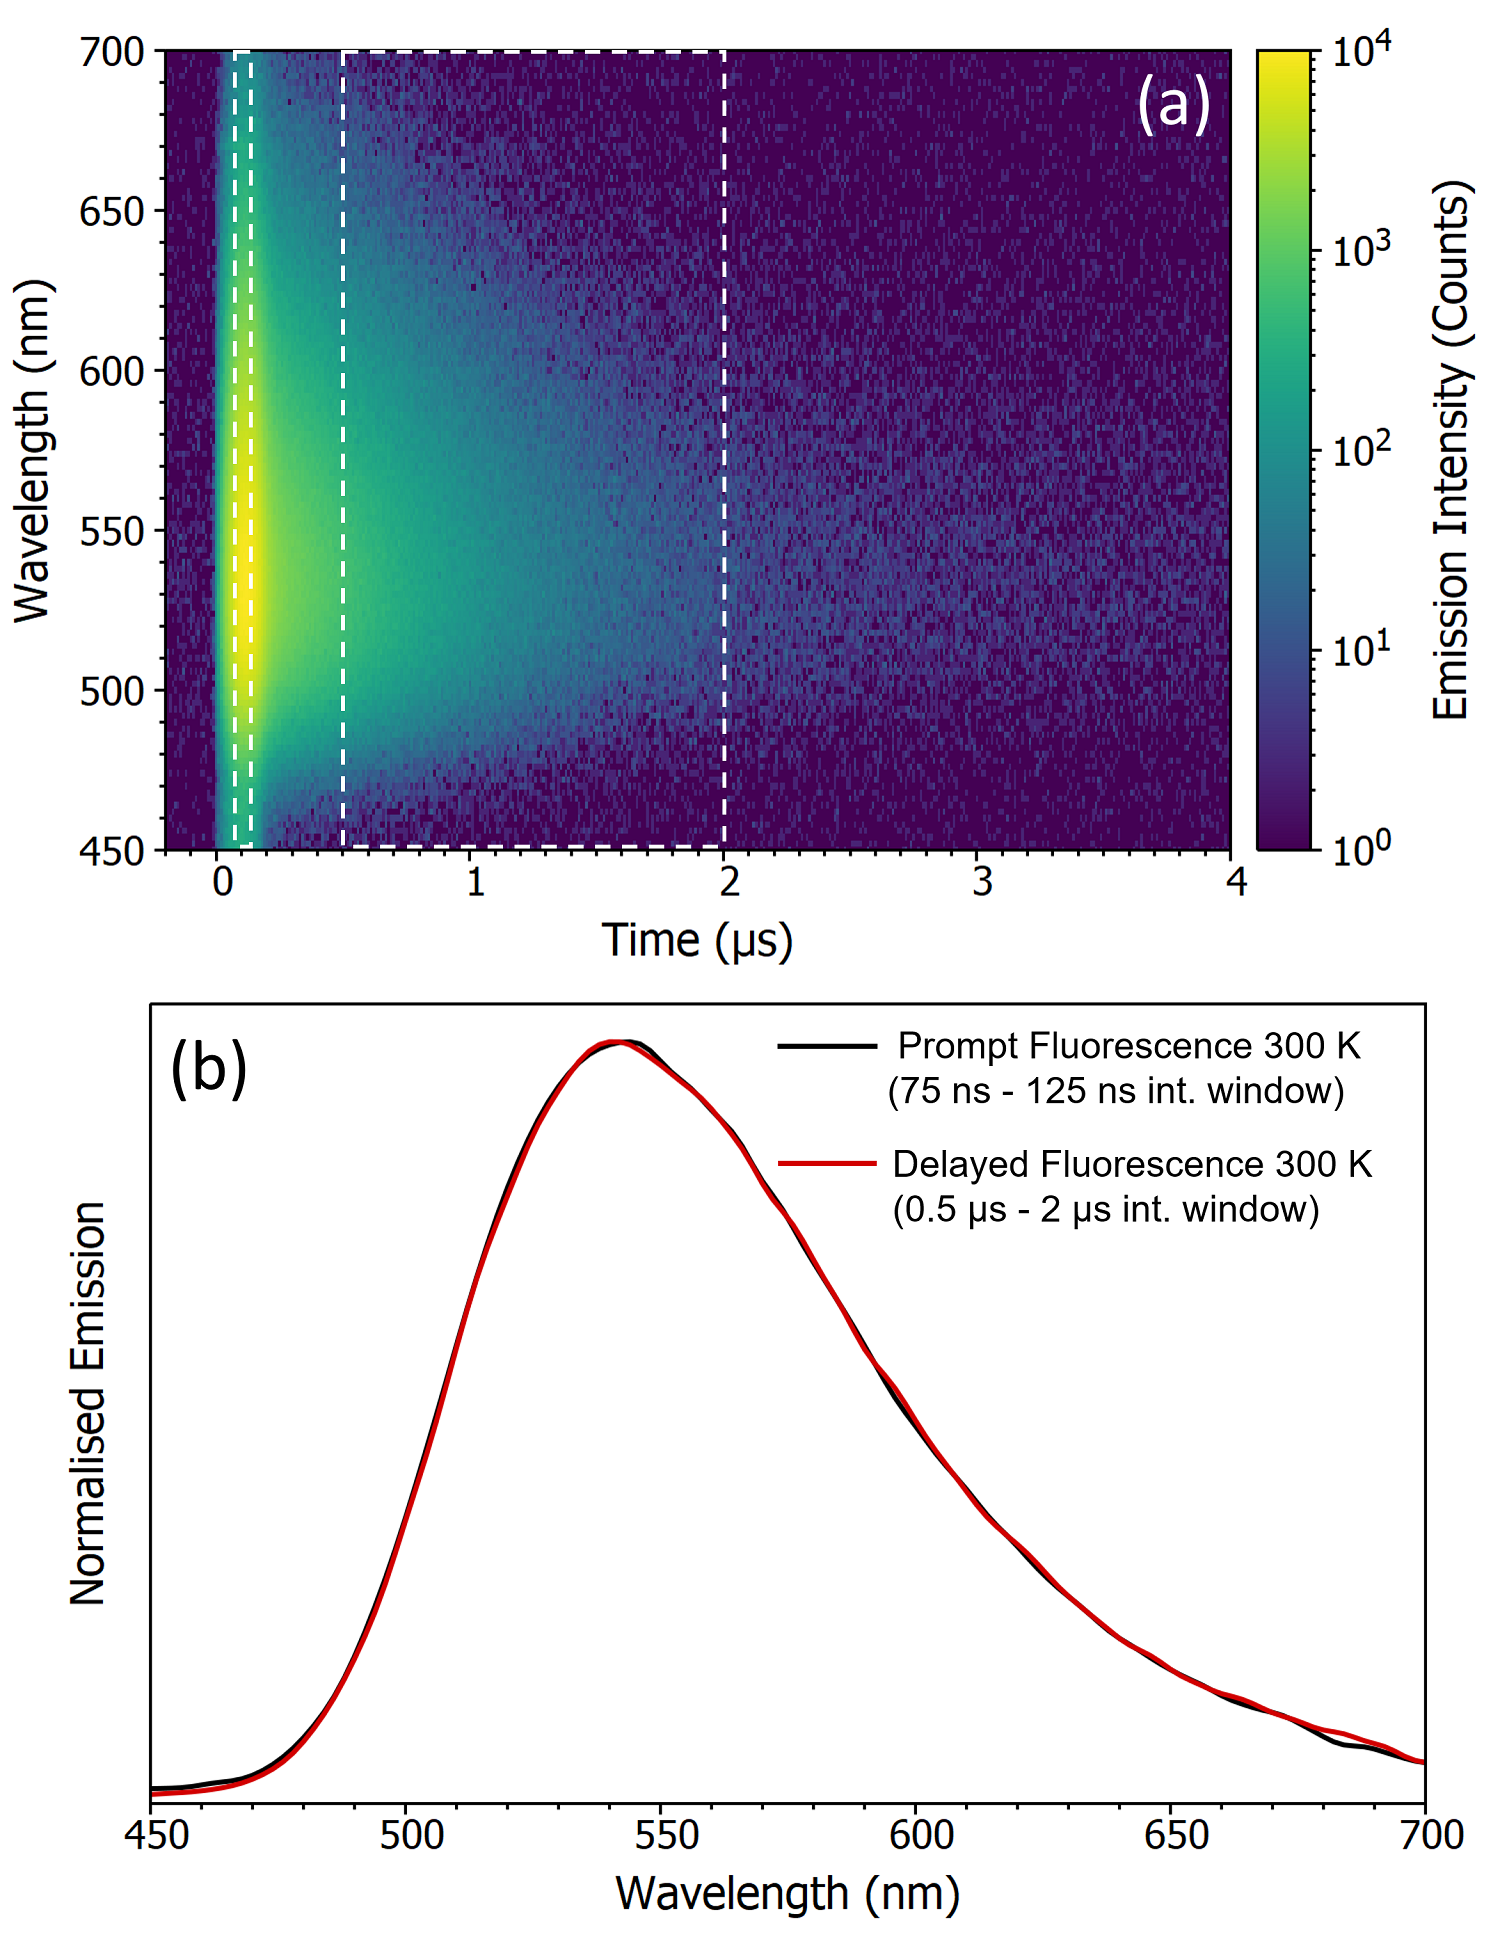
Figure 3: Time-resolved emission spectrum (TRES) of CzDBA solution at 300 K measured using MCS. TRES colour map (a) and integrated TRES slices (b) of the prompt and delayed fluorescence spectra. Experimental Parameters: Excitation Source = VPL-375, Pulse Width = 100 ns, Rep Rate = 100 kHz, λex = 375 nm, Δλem = 2 nm. Acquisition time = 875 s.
Fluorescence and Phosphorescence Spectra measured using Gated Detection at 80 K
At room temperature, there is no phosphorescence from an efficient TADF emitter as the triplet state is depopulated through reverse intersystem crossing. The sample must, therefore, be cooled to cryogenic temperatures in order to measure the phosphorescence spectrum. The FLS1000 can be equipped with a wide range of nitrogen, helium, and cryogen-free cryostats; enabling measurements down to 3 K.
Figure 4 shows the decay of CzDBA measured at 80 K and consists of a nanosecond timescale prompt fluorescence component and phosphorescence emission on a millisecond timescale. Since phosphorescence occurs on a longer timescale the pulse width of the VPL‑375 was increased to 500 μs for this measurement. This enables more optical power to be delivered to the sample in order to measure the weakly emitting phosphorescence component and this flexibility is the advantage of the VPL series.
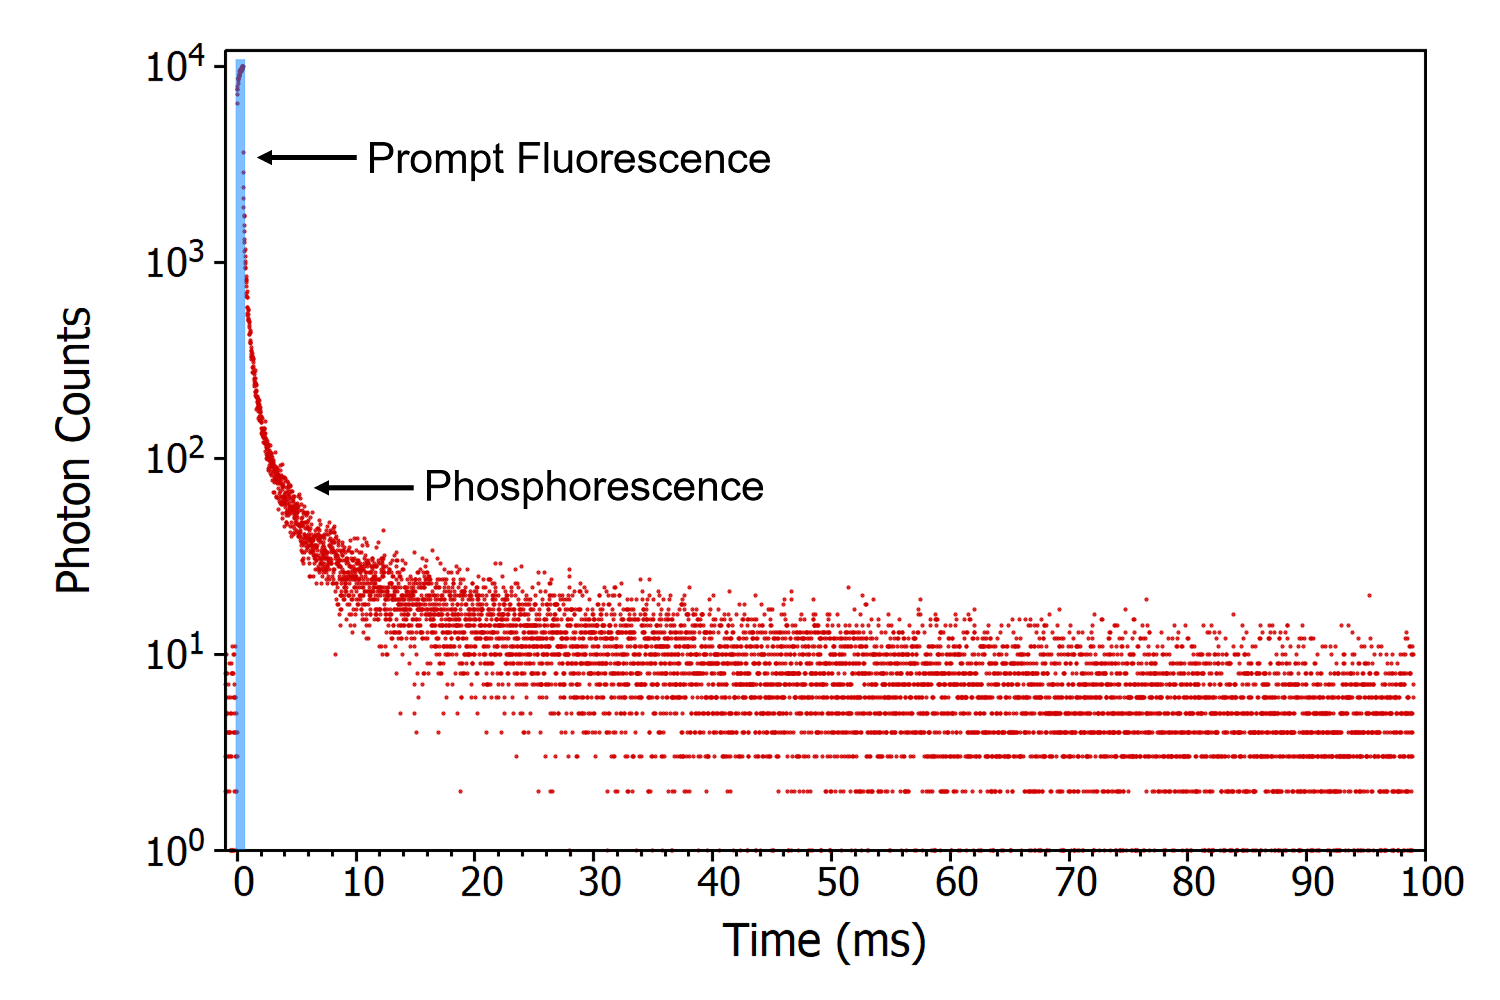
Figure 4: Photoluminescence decay of CzDBA solution at 80 K measured using MCS. Experimental Parameters: Excitation Source = VPL-375, Pulse Width = 500 μs, Rep Rate = 5 Hz, λex = 375 nm, λem = 530 nm, Δλem = 2 nm. The shape and position of the VPL pulse are shown in blue.
The spectrum of the phosphorescence component could in principle be measured using TRES, in a similar manner to Figure 3. However, the disparity between the peak intensity of the fluorescence and phosphorescence components seen in Figure 4 makes this method inefficient. The peak intensity of the fluorescence component is approximately two orders of magnitude greater than the phosphorescence and this intense fluorescence emission is occurring within a short 500 μs window (the duration of the laser pulse). The PMT detector of the FLS1000 can accept a maximum count rate of ~1.5 x 10⁶ counts per second before it enters the saturation regime and its output becomes non-linear. To prevent saturating the detector the power of the VPL laser would have to be attenuated in order to keep the peak count rate during the laser pulse below the saturation limit. This is an inefficient way to measure the phosphorescence as the count rate is being limited by the short-lived fluorescence component.
The solution to this problem is to time-gate the PMT detector (Figure 5). In detector gating, the high voltage to the PMT is only applied within a user-defined window known as the gate. The gate delay (the time between the start of the laser pulse and the start of the gate) and the length of the gate are selected in Fluoracle in order to only detect within the time region of interest. In the case of phosphorescence spectra, the gate delay is chosen such that the fluorescence has ended which simultaneously enables higher count rates to be used and isolates the phosphorescence from the fluorescence. The phosphorescence spectrum of CzDBA is shown in Figure 6 and was measured using a 5 ms gate delay and a 50 ms gate width and was acquired in less than 15 minutes. For comparison, the 80 K fluorescence spectrum was also measured by setting the gate to occur during the laser pulse.
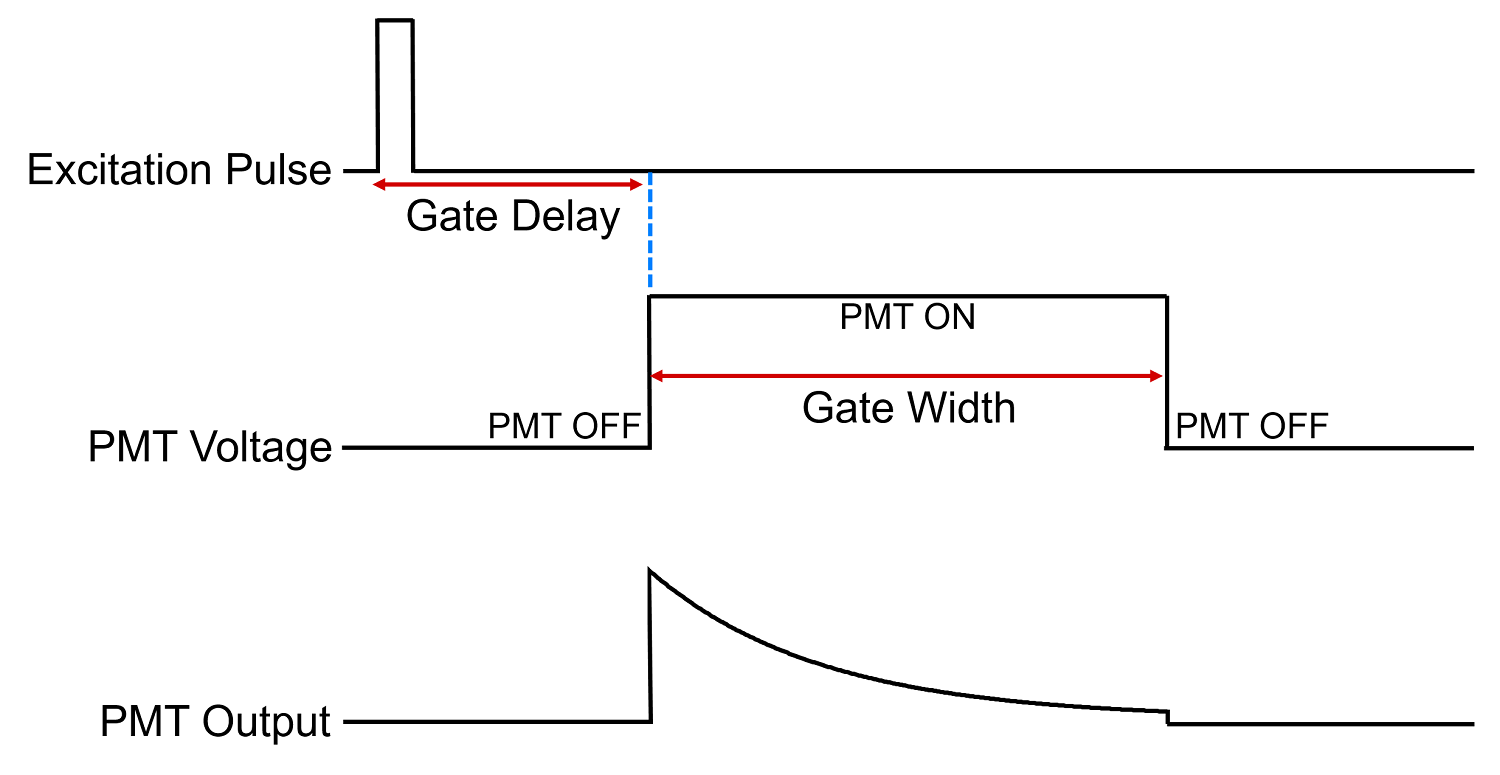
Figure 5: Timing diagram of a gated PMT detection.
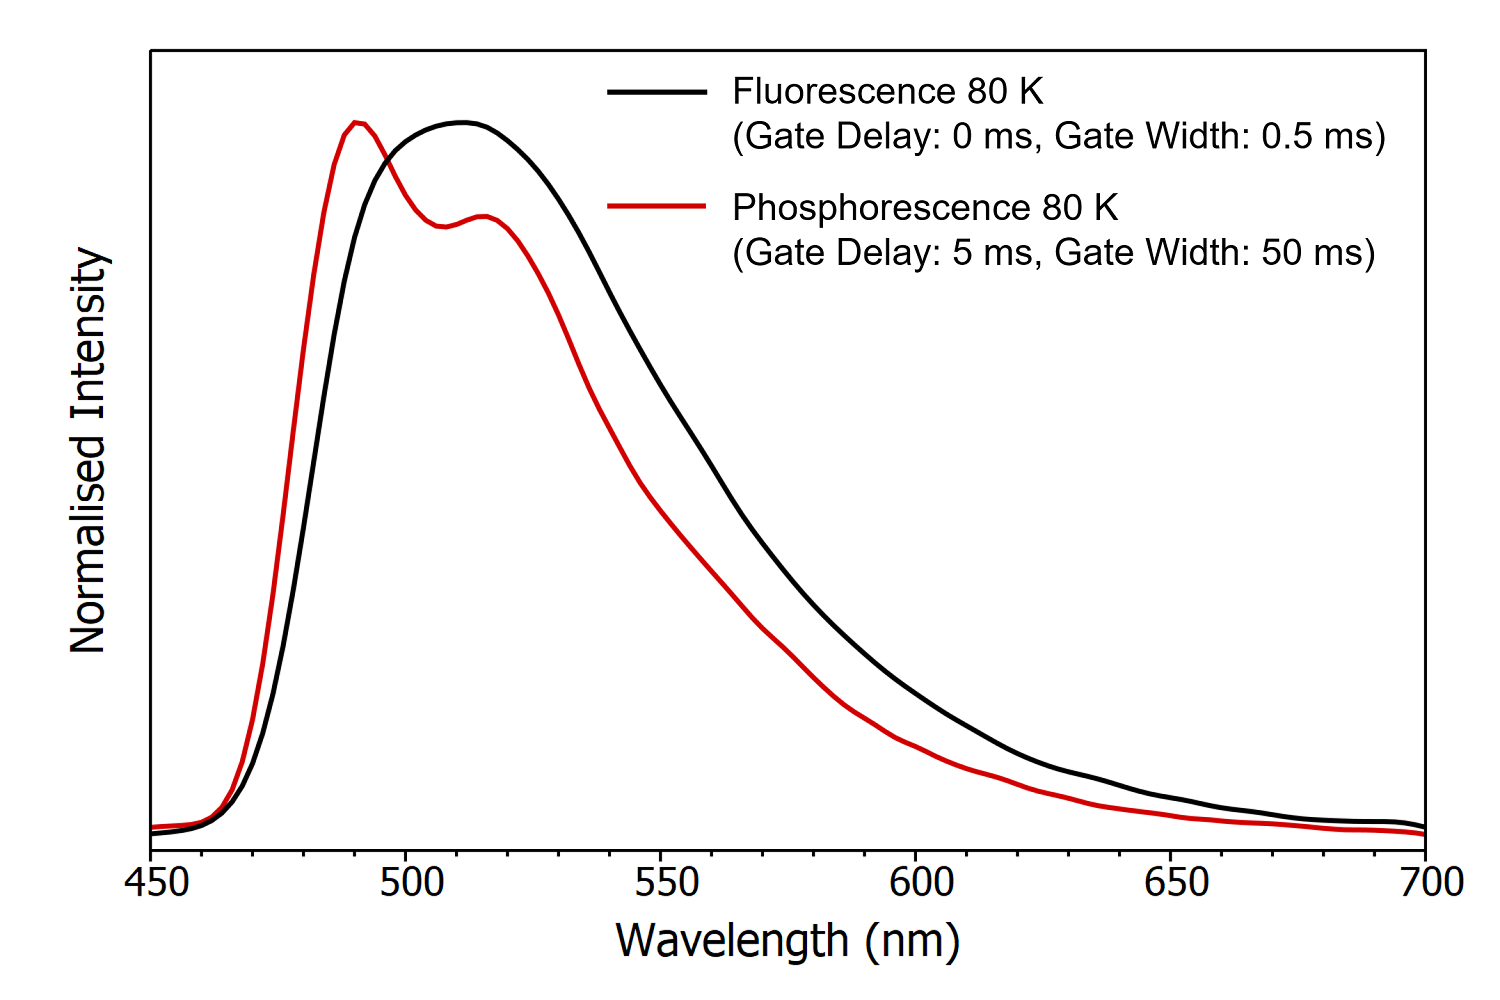
Figure 6: Gated phosphorescence and fluorescence spectra of CzDBA solution at 80 K. Experimental Parameters: Excitation Source = VPL-375, Pulse Width = 500 μs, Rep Rate = 5 Hz, λex = 375 nm, Δλem = 2 nm. Acquisition time = 875 s each.
Conclusion
The prompt fluorescence, delayed fluorescence, and phosphorescence spectra of CzDBA were measured using the FLS1000 Photoluminescence Spectrometer with a gated detector and a VPL laser. The pulse length of the VPL laser can be adjusted to measure both delayed fluorescence and phosphorescence spectra. The combination of the VPL laser with a gated PMT detector enables low-temperature phosphorescence spectra to be measured rapidly.
References
Acknowledgements
We are grateful to Dr Tien-Lin Wu and Prof. Chien-Hong Cheng at National Tsing Hua University, Taiwan for synthesising the TADF material used in this application note.
