


Time-Resolved Electroluminescence Spectroscopy of a White Light Emitting Diode
The development of the light emitting diode (LED) has revolutionised the lighting and display industries. The immense impact of the LED was recognised by the award of the 2014 Nobel Prize in Physics to Isamu Akasaki, Hiroshi Amano and Shuji Nakamura for the “invention of efficient blue light-emitting diodes which has enabled bright and energy-saving white light sources”.1 The creation of an efficient blue LED facilitated the development of low energy white light sources for lighting and consumer electronics applications. White light LEDs have an energy consumption that is 15 times lower than traditional incandescent bulbs and 5 times lower than energy efficient halogen bulbs, while simultaneously having a much longer working lifetime.2 The market share of LEDs in one of the largest energy consumers, the United States, has been gaining steadily over the past 5 years and are expected to become the dominant indoor lighting technology in the U.S by 2020.2 In addition to providing cost savings to the consumer, this energy usage reduction can significantly lower carbon emissions since lighting accounts for 20-30% of the electrical energy consumption in developed countries.1
Furthermore, LEDs are essential for modern portable consumer electronics as they are used to backlight the liquid crystal displays (LCD) found in televisions, smart phones and tablets. LED backlights enable the creation of compact, lightweight and low power usage displays; allowing lighter and longer battery life devices to be designed. New LED technologies such as OLEDs and quantum dot LEDs are being actively researched in order to improve the lifetime, brightness and colour rendering of displays. One of the most powerful techniques to understand the behaviour and performance of these light emitting devices is electroluminescence spectroscopy. In this application note the FLS1000 Photoluminescence Spectrometer is used to investigate the emission properties of a phosphor coated indium gallium nitride white light LED using steady state and time-resolved electroluminescence spectroscopy.

Figure 1: FLS1000 Photoluminescence Spectrometer which can be equipped with a range of source-meters and function generators for the measurement of steady state and time-resolved electroluminescence.
An LED consists of a chip of semiconducting material that has been doped to create a p‑type region and an n-type region. The p-type regions contain an excess of holes while the n‑type have an excess of electrons. At the interface between these two regions, a p-n junction is formed which is the light emission region of the LED. A schematic of charge carrier recombination at the p-n junction in an LED is shown in Figure 2. When a voltage is applied across the semiconductor the holes in the p-type region and electrons in the n-type region will drift towards the p-n junction where they will recombine. The recombination of an electron with a hole releases a photon with an energy approximately equal to the energy bandgap between the valence and conduction bands.
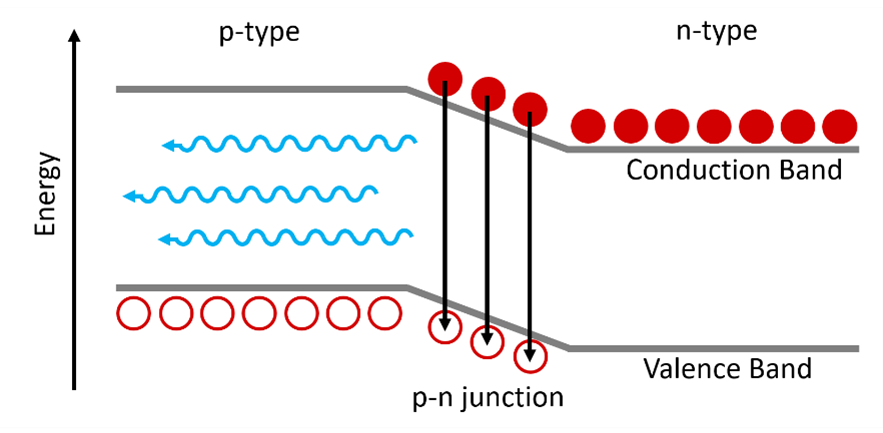
Figure 2: Schematic of charge carrier recombination at a p-n junction in an LED. Electrons are shown by the solid circles and holes by the hollow circles. Adapted from Ref 1.
The fact that the energy of the emitted photons is determined by the bandgap of the semiconductor poses a problem for the generation of a white light LED, since the emission spectrum of the LED will be narrowly centred around the bandgap energy. The most widely adopted solution to this problem is to coat the LED with a layer of phosphor, the principle of which is illustrated in Figure 3. In this approach the bandgap of the semiconductor is tuned so that the electroluminescence is in the blue region of the spectrum. Some of these blue photons pass through the phosphor unperturbed while others are absorbed, causing it to phosphoresce at a longer wavelength. The combination of the direct blue electroluminescence and the secondary yellow phosphorescence then produces white light. By tuning the bandgap of the semiconductor, the choice of phosphor, and the thickness of the phosphor coating; the properties of the white light can be adjusted.
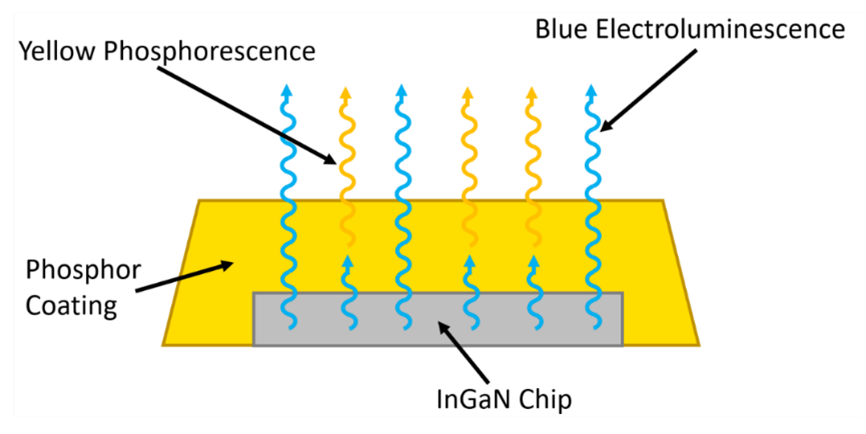 Figure 3: Schematic of a white light emitting phosphor coated InGaN LED.
The most common semiconductor material for blue LEDs is indium gallium nitride (InxGa1‑xN). GaN has a bandgap of 3.4 V (360 nm), but by adding indium to the GaN the bandgap of the semiconductor can be lowered to achieve the desired emission wavelength, in this case blue.3,4 For the phosphor coating, there are a range of different options available.5-7 One of the most common choices for cheap LEDs, where a good colour rendering index is not crucial, is cerium doped yttrium aluminium garnet (Ce:YAG).5 In this application note the emission properties of a phosphor coated InGaN LED are investigated using electroluminescence spectroscopy.
Methods & Materials
A commercial white light InGaN LED (MCL053SWC-YH1) was purchased from Farnell Ltd. Electroluminescence measurements were performed using the FLS1000 Photoluminescence Spectrometer equipped with a PMT-900 detector. For steady state electroluminescence measurements, the current through the LED was set to 20 mA (3.4 V) using a Keithley 2400 Source Measure Unit. For time-resolved electroluminescence measurements, square 3.5 V voltage pulses with a pulse duration of 2.5 μs and a repetition rate of 100 kHz were applied to the LED using an arbitrary function generator (N-M06). The EL decays following the voltage pulse were measured using Time-Correlated Single Photon Counting (TCSPC).
Results & Discussion
The electroluminescence emission spectrum of the LED is shown in Figure 4. It can be seen that the emission consists of a narrow emission peak centred on 450 nm which corresponds to the blue electroluminescence directly from the InGaN semiconductor and a broad emission centred on 570 nm from the phosphor coating.
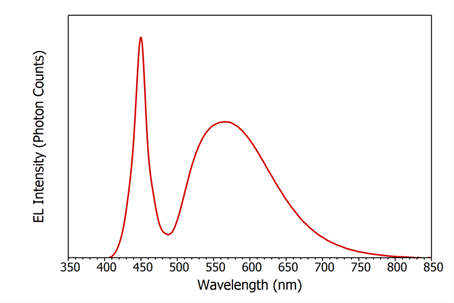
Figure 4: Steady state electroluminescence of the white light InGaN LED at a drive current of 20 mA (3.4 V). Δλem = 0.1 nm.
The peak wavelength of the direct electroluminescence can be used to determine the indium content of the InGaN chip. An empirical relationship between the indium content and the bandgap of InGaN, , has been previously established to be,8
where and are the bandgaps of GaN and InN respectively, x is the fraction of indium in the InxGa(1-x)N and is the bowing parameter. Using the values of 0.77 eV and 3.42 eV for the bandgaps of InN and GaN,8 2.4 eV for b,8,9 and an InxGa(1-x)N bandgap of 2.76 eV (450 nm) from the EL spectrum in Figure 4; the fraction of indium is determined to be approximately 0.14 and the composition of the semiconductor is therefore In0.14Ga0.86N.
It is difficult to visualise the colour of the LED solely using the emission spectrum in Figure 4. The solution to this is to replot the emission spectrum as a chromaticity diagram, which describes the colour quality of an emission independently of its luminance. The Fluoracle® software of the FLS1000 has a built-in wizard to generate a chromaticity plot from any emission spectrum, in either CIE 1931 or CIE 1976 colour space. The chromaticity coordinates of the LED electroluminescence was calculated in CIE 1931 colour space and are shown in Figure 5. The LED emission has coordinates of (0.32, 0.33) which is close to the achromatic point of (0.33, 0.33) and the LED therefore produces a good rendition of white light.
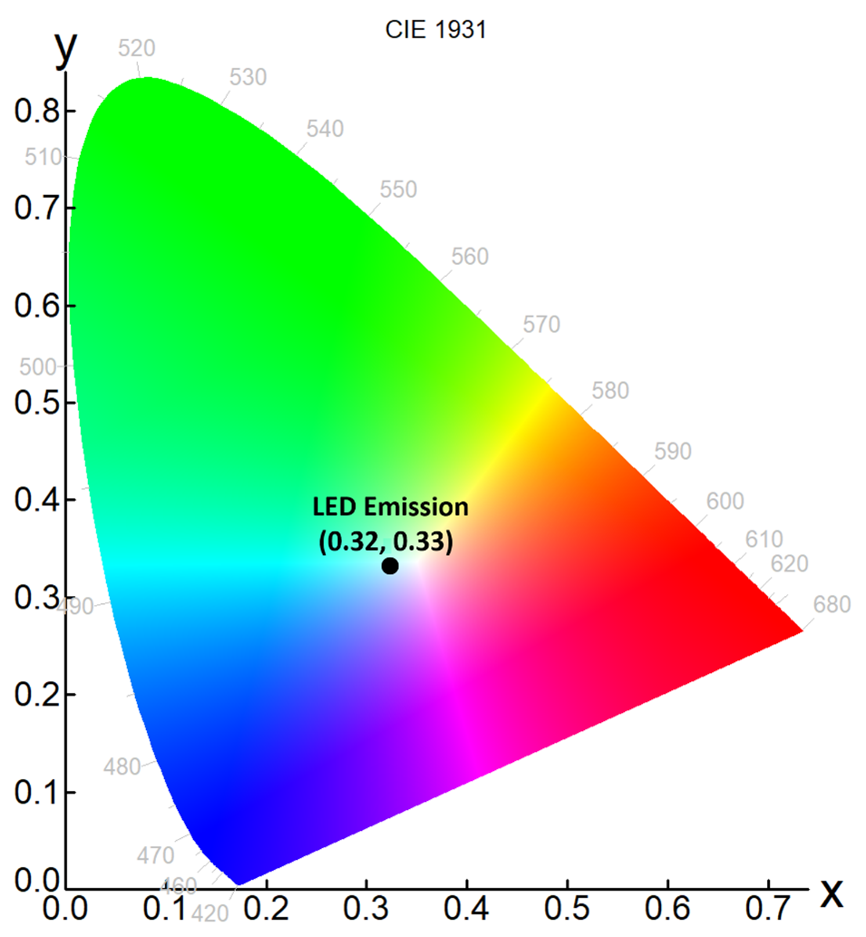
Figure 5: Chromaticity plot of the LED emission in CIE 1931 colour space, calculated using Fluoracle from the electroluminescence spectrum in Figure 4.
In order to gain further into the nature of the LED emission, the temporal decay of the emission was investigated using time-resolved electroluminescence (TREL) spectroscopy. In TREL a voltage pulse is applied to the sample and the electroluminescence response to the voltage pulse monitored over time. The electroluminescence response can provide a wealth of information properties and performance of the electrical device. For example, TREL has been previously used to distinguish between direct and indirect transitions in Ge,10 look at deep level trapping in AlGaN,11 redox depletion in dye sensitised solar cells,12 measure charge carrier mobility,13 and observe triplet-triplet annihilation in OLEDs,14,15 to name a few.
A schematic of the pulse sequence used for the TREL measurement of the LED is shown in Figure 6. The duration of each voltage pulse was chosen to be 2.5 μs, which is sufficiently long for the LED to enter the steady state regime, and the electroluminescence during the pulse therefore saturates. The region of interest is the decay of the EL following the end of the voltage pulse. This EL decay was measured using the technique of TCSPC, where the pulse sequence is repeated millions of times and the EL decay built up photon-by-photon over time.
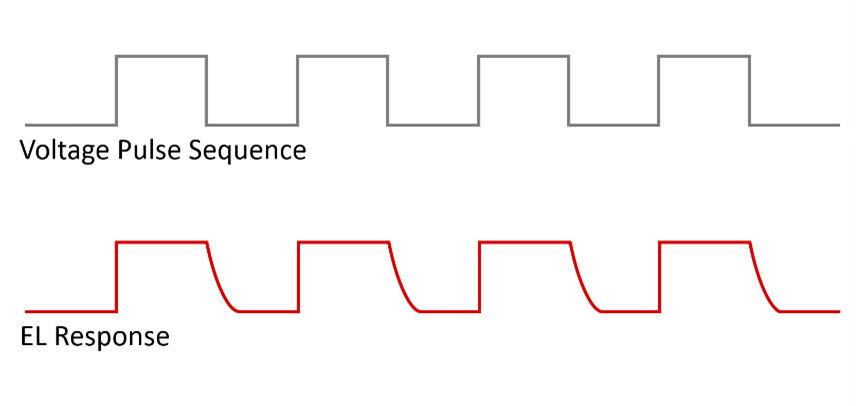
Figure 6: Time-resolved electroluminescence (TREL) pulse sequence. The EL decay following each voltage pulse is measured using TCSPC.
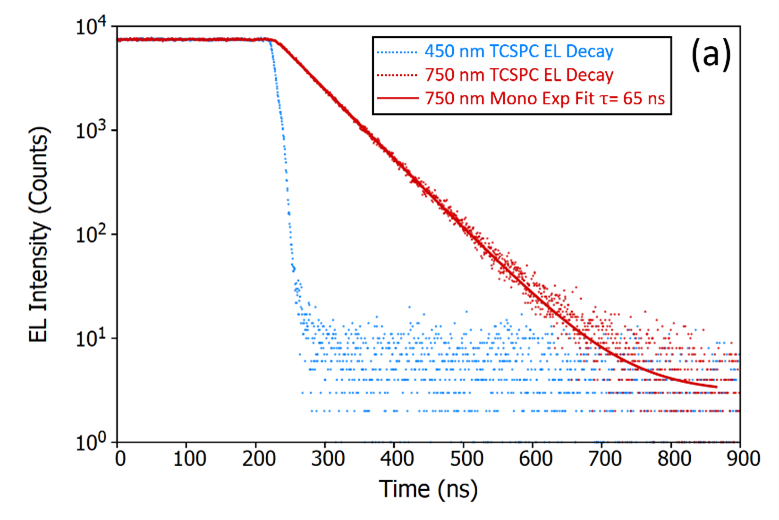
The TREL measurement of the LED is shown in Figure 7a. The EL decay was measured at two emission wavelengths 450 nm and 575 nm, the peak wavelengths of the narrow and broad emission bands respectively. It can be seen that the decay at 450 nm is prompt, returning to baseline within 50 ns. The function generator used to generate the voltage pulses for the measurement has a rise/fall time of less than 3 ns so the EL decay must be due to the response of the LED and not the IRF of the function generator. The decay is complex, and could not be fit by simple exponentials. The primary contribution to this decay is due to the capacitance and resistance of the LED itself. A typical LED has a capacitance in the 50 pF range and the load resistance of the driving circuit was 50 Ω. This gives an RC time constant of ~2.5 ns which accounts for the majority of the observed decay.
 |
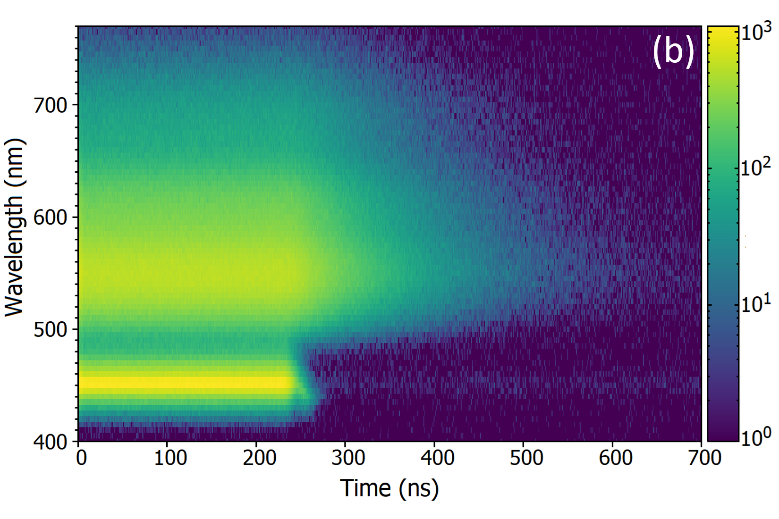 |
Figure 7: Time-resolved electroluminescence of white light InGaN LED. (a) EL decay measured at 450 nm and 575 nm using TCSPC. The EL decay at 575 nm was fit with a monoexpoential decay using Fluoracle, giving a lifetime of 65 ns. (b) Time-resolved electruminescence emission spectrum measured using TCSPC. (a,b) Excitation source = 3.4 V square voltage pulse with a 2.5 μs duration from an arbitrary function generator, Rep Rate = 100 kHz, λem = 450, 575 nm, Δλem = 0.3 nm.
At an emission wavelength of 575 nm the EL decay is much longer and could be accurately fit using a single monoexponential decay with a lifetime of ? = 65 ns. The long decay confirms that the emission in this region is due to the phosphor coating, which typically have decays in the region of hundreds of ns. The fact that the decay can be fit so well with a single monoexponential suggests that the phosphor coating contains a single emissive species. The boundary between the two types of the emission in the LED can be seen clearly in colour plot in Figure 7b which is a time-resolved electroluminescence emission spectrum. It can be seen that beyond 500 nm, the emission is solely due to the secondary weaker but longer lifetime emission from the phosphor.
Conclusion
Using the FLS1000 Photoluminescence Spectrometer equipped with the N-M06 electroluminescence accessory the emission properties of a phosphor coated InGaN LED were investigated. Steady state electroluminescence spectroscopy was used to determine the chromaticity coordinates of the emission, which were determined to be (0.32, 0.33) in CIE 1931 colour space. This is close to the achromatic point of (0.33, 0.33) and shows that the LED generates a good approximation of white light. Using time-resolved electroluminescence the dual nature of the LED emission was investigated. It was found that the direct emission from the InGaN decayed rapidly and was primarily controlled by the RC constant of the LED, while the emission from the phosphor coating at 575 nm decayed more slowly with a time constant of 65 ns. The capability of both the FLS1000 and FS5 Photoluminescence Spectrometers can be extended with a range of electroluminescence accessories for the characterisation of electrical devices.
References
- Class for Physics of the Royal Swedish Academy of Sciences, Scientific Background on the Nobel Prize in Physics 2014: Efficient Blue Light-Emitting Diodes Leading to Bright and Energy-Saving White Light Sources (2014)
- EPA Energy Star: The Light Bulb Revolution (2017)
- Nakamura, Growth of InxGa(1-x)N Compound Semiconductors and High-Power InGaN/AIGaN Double Heterostructure Violet-Light-Emitting Diodes Microelec. J. 25 651 (1994)
- Osamura, S. Naka, and Y. Murakami, Preparation and Optical Properties of Ga1−xInxN Thin Films, J. Appl. Phys. 46 3432 (1975)
- Mills, Phosphors Development for LED Lighting, III-Vs Review 18 32 (2005)
- Mills, Phosphors to brighten your future, III-Vs Review 19 36 (2006)
- Izotov, A. Sitdikov, V. Soldatkin, V. Tuev, and A. Olisovets, Study of Phosphors for White LEDs, Procedia Technology 18 14 (2014)
- F. Schubert, Light-Emitting Diodes, 2nd ed., Cambridge University Press, Cambridge, NY, (2006)
- Siozade, J. Leymarie, P. Disseix, A. Vasson, M. Mihailovic, N. Grandjean, M. Leroux, J. Massies, Modelling of Thermally Detected Optical Absorption and Luminescence of (In,Ga)N/GaN Heterostructures, Solid State Commun. 115 575 (2000)
- Terada, Y. Yasutake, and S. Fukatsu, Time-resolved Electroluminescence of Bulk Ge at Room Temperature, Appl. Phys. Lett. 102 041102 (2013)
- Shatalov, A. Chitnis, V. Mandavilli, R. Pachipulusu, J. P. Zhang, V. Adivarahan, S. Wu, G. Simin, and M. Asif Khan, Time-resolved Electroluminescence of AlGaN-Based Light-emitting Diodes with Emission at 285 nm, Appl. Phys. Lett. 82 167 (2003)
- Trupke, S. Baumgärtner, and P. Würfel, Time-Resolved Electroluminescence of Dye Sensitized Solar Cells, J. Phys. Chem. B 104 308 (2000)
- Lin, M. Li, W. Chen, M. A. Omary, and N. D. Shepherd, Transient Electroluminescence Determination of Carrier Mobility and Charge Trapping Effects in Heavily Doped Phosphorescent Organic Light-emitting Diodes, Solid State Electron. 56 196 (2011)
- Y. Kondakov, Characterization of Triplet-Triplet Annihilation in Organic Light-Emitting Diodes Based on Anthracene Derivatives, J. Appl. Phys. 102 114504 (2007)
- T. Jen, and S. Chen, Singlet Exciton Fraction in Electroluminescence from Conjugated Polymer, Sci. Rep. 7 2889 (2017)
Sign-Up for our Application and Technical Notes
If you have enjoyed reading our Application Note, why not sign-up to our newsletter using the button below.
