


Chromaticity Coordinates and Bandgaps of III-V LEDs Using Electroluminescence Spectroscopy
In this application note, chromaticity coordinates of III-V LEDs are investigated using the FS5 Spectrofluorometer, as well as their emission properties and bandgaps.
In 1907 English engineer Henry Joseph Round was testing the rectifying current behaviour of SiC crystallites and noticed that a faint yellow light was emitted from the SiC; this was simultaneously the first reported observation of the phenomena of electroluminescence spectroscopy and the first successful operation of a light emitting diode (LED). The work of Round was expanded on by a few others in the early 20th century, but it would take many decades for LEDs to become efficient enough for practical use. In the 1960s the first commercial LEDs were released which had emission in the NIR and red regions of the spectrum. It would take another 30 years for the breakthrough of high efficiency InGaN based blue and green LEDs, in the late 1990s, to usher in the age of the LED.
Modern LEDs are efficient, bright and reliable and are one of the most versatile and widely used light sources with an ever increasing number of applications. LED technology is still advancing at a rapid pace with new device architectures and doping methods being developed in order to increase LED brightness and efficiencies. In addition there are several new disruptive LED technologies using quantum dots (QDLEDs), organic semiconductors (OLEDs) and halide perovskites (PLEDs) which are set to move LED design away from the classic type III-V semiconductors that have previously dominated the technology.
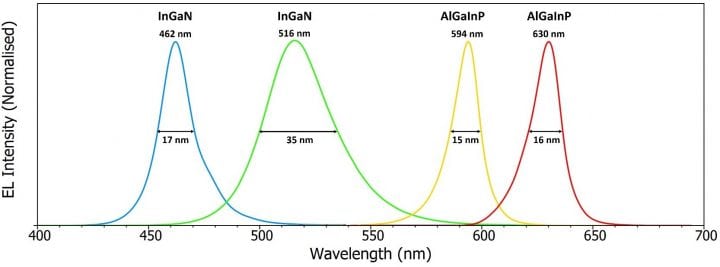
Figure 1: Electroluminescence spectra of InGaN and AIGaInP LEDs, recorded using the FS5 Spectrofluorometer, showing the peak wavelengths and FWHM of the emission.
An essential technique to characterise new LED designs and advance their development is electroluminescence (EL) spectroscopy. In EL spectroscopy a current is passed through a light emitting device and the properties of the emitted light studied; in either a steady state or time-resolved measurement. In steady state EL spectroscopy a constant current is passed through the device and the EL emission spectrum measured using a monochromator. From the emission spectrum the chromaticity coordinates and colour rendering index of the emission can be calculated, in addition to fundamental material properties such as the bandgap of the semiconductor. In time-resolved EL spectroscopy the EL response of the device to short voltage pulses is studied in order to investigate the dynamics of charge carriers in the device, such as triplet formation in OLEDs.
Download the Electroluminescence Spectroscopy Application Note
Chromaticity Coordinates using the FS5 Spectrofluorometer
For further information on how the FS5 Spectrofluorometer, was used to determine the chromaticity coordinates of III-V LEDs why not contact one of our sales team by emailing us at sales@edinst.com.
Sign-Up for our Application and Technical Notes
If you have enjoyed reading our Application Note, why not sign-up to our infrequent newsletter, and follow us on social media.