


Rapid Excitation Emission Matrix Analysis of Single Wall Carbon Nanotubes
Using excitation emission matrix spectroscopy, in this application note the FLS1000 Photoluminescence Spectrometer, equipped with an InGaAs NIR camera, is used to identify the chiral indexes present in a SWCNT sample.
Single-wall carbon nanotubes (SWCNTs) have unique electrical, thermal, mechanical, and optical properties which make them attractive for a wide variety of applications; ranging from drug delivery to battery electrodes. SWCNTs can be envisaged as a graphene layer that has been rolled up into a cylinder with different tube structures possible depending on how the graphene layer is rolled. The tube diameter and chirality (orientation of the graphene lattice with respect to the tube axis) are defined by the roll-up vector shown in Figure 1 as a red arrow. The roll-up vector magnitude and angle are described by a pair of integers (n, m) called the chiral index.
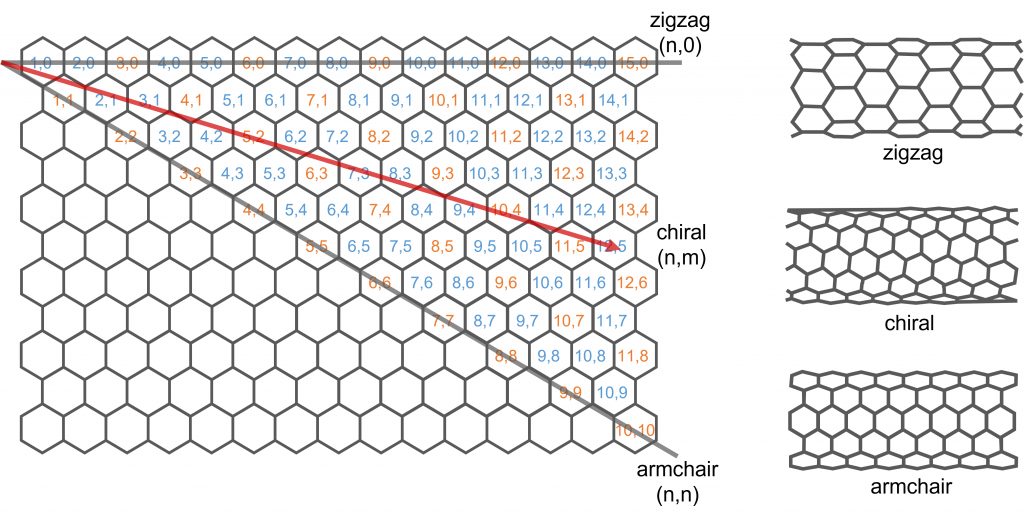
Figure 1: Roll-up vector of SWCNTs and chiral indexes. Blue chiral indexes have semiconducting properties while the orange are metallic.
SWCNTs are interesting because their electronic properties heavily depend on the chiral index of the tube structure. SWCNTs with chiral indexes coloured in orange in Figure 1 exhibit metallic properties while those in blue are semiconducting, with the bandgap varying with chiral index. This gives SWCNTs a wealth of tunability and their properties can be tailored to specific applications. Many SWCNT synthesis methods result in a mixture of chiral structures and identifying the chiral structures present in a synthesised sample is therefore vital. One of the most powerful methods for SWCNT identification is photoluminescence spectroscopy. In this application note, the FLS1000 Photoluminescence Spectrometer equipped with an InGaAs NIR camera is used to identify the chiral indexes present in a SWCNT sample using excitation emission matrix spectroscopy.
Experimental Setup
SWCNTs were synthesised using the HiPCo process and dispersed in an aqueous surfactant solution at a concentration of 0.01 mg ml-1 (Nanointegris, NanoGauge IsoTubes-S). The photoluminescence of the SWCNT solution was measured using an Edinburgh Instruments FLS1000 Photoluminescence Spectrometer equipped with a double excitation monochromator and an emission spectrograph with an InGaAs NIR camera. 3 ml of the SWCNT solution was pipetted into a quartz cuvette and held in the N‑J03 Front Face Sample Holder.
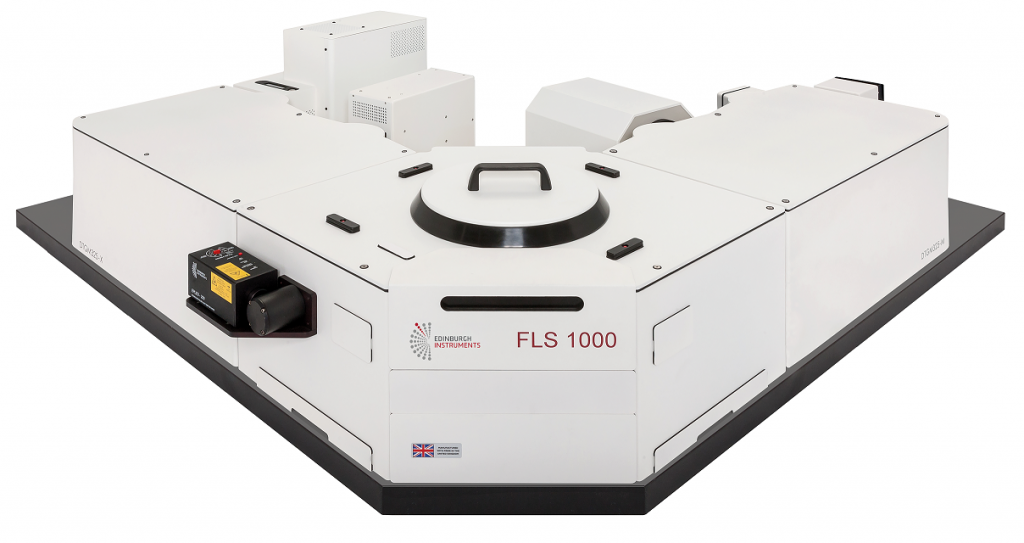
Figure 2: FLS1000 Photoluminescence Spectrometer.
Excitation Emission Matrix Acquisition
A SWCNT sample contains a multitude of tube structures with different chiral indexes and therefore different bandgaps. The SWCNTs in the sample will therefore have a range of absorption bands and to fully characterise the photoluminescence properties of all semiconducting SWCNTs present, an excitation emission matrix (EEM) is required. In an EEM, the photoluminescence spectrum is measured as a function of excitation wavelength to build a 3D fingerprint of all semiconducting SWCNT structures present in the sample. To measure EEMs quickly the acquisition time of each photoluminescence spectrum should be as short as possible. To enable the rapid measurement of NIR EEMs the FLS1000 can be equipped with an InGaAs NIR camera which captures the entire NIR spectrum in a matter of seconds.
Using the FLS1000’s Fluoracle® software, an automated EEM was set up. The excitation wavelength was varied between 250 nm and 850 nm with 2 nm steps and the excitation intensity was corrected using the FLS1000’s reference detector. The photoluminescence emission was measured between 900 nm and 1400 nm in a single capture using the InGaAs NIR camera. The EEM of the SWCNT sample is shown in Figure 3 with a total acquisition time of 30 minutes.
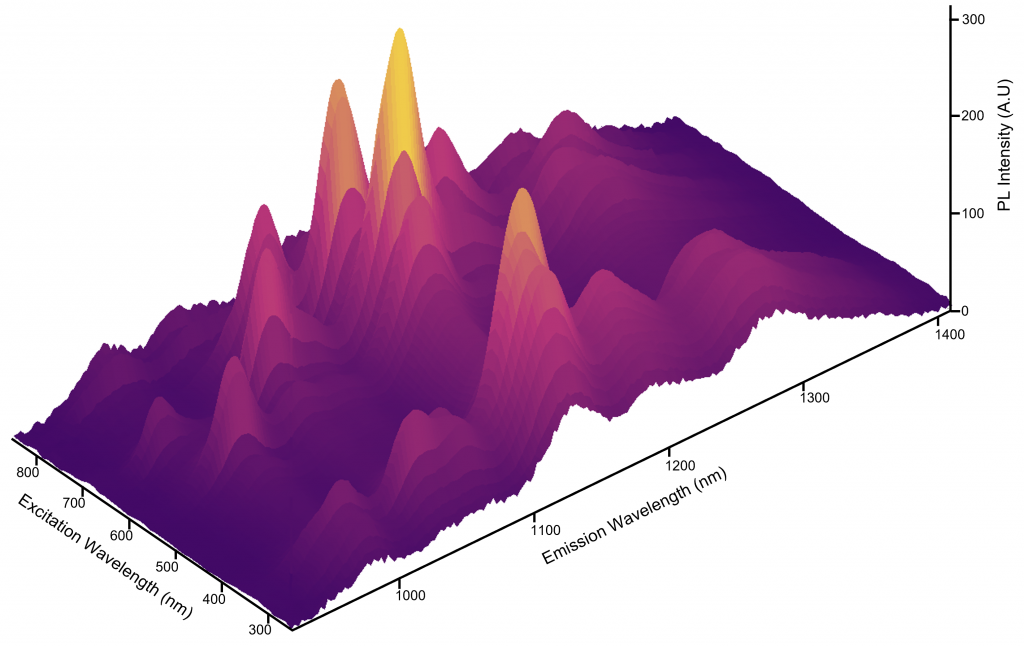
Figure 3: Excitation Emission Matrix of the SWCNT sample.
Excitation Emission Matrix Analysis
The photoluminescence and absorption properties of SWCNTs can be understood by looking at their density of states. Figure 4a shows a qualitative density of states schematic of a single SWCNT structure. Due to their quasi one-dimensional nature, the density of states of a SWCNT consists of sharp Van Hove Singularities in the valence and conduction bands between which optical transitions can occur. Light absorption at energy E22 or E33 promotes electrons from the valance to the conduction band. This is followed by rapid non-radiative relaxation to the c1 level and radiative relaxation to the valence v1 level with photoluminescence energy E11. The values of E11, E22 and E33 depend on the structure (chiral index) of the nanotube and the different nanotube structures present in the sample, therefore, give rise to multiple peaks in the excitation emission matrix.
The excitation emission matrix is shown as a colour plot in Figure 4b where two emissive regions are highlighted. The low wavelength excitation region marked in blue corresponds to v3 → c3 absorption followed by c1 → v1 photoluminescence while the region at higher excitation wavelengths marked in green corresponds to v2 → c2 absorption followed by c1 → v1 photoluminescence. For identification of the SWCNT structures the v2 → c2 region marked in green is most often used.
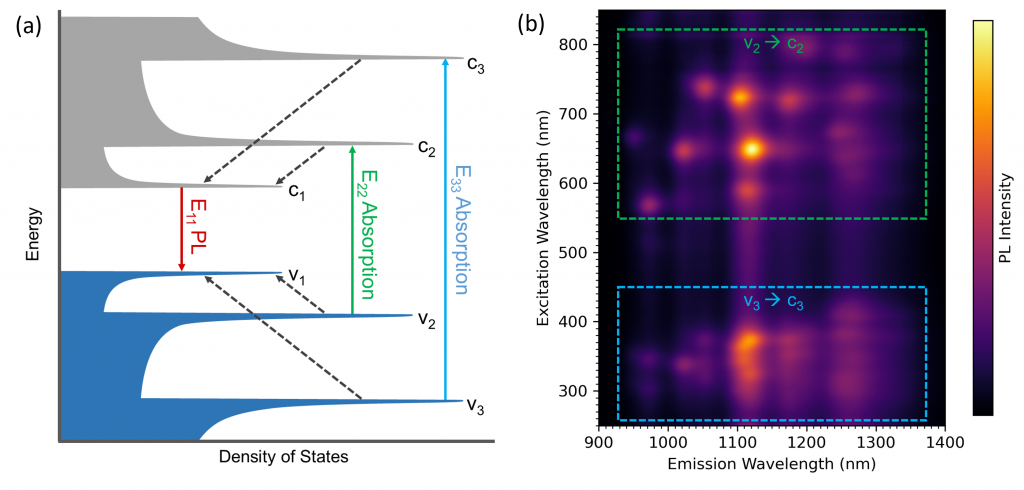
Figure 4: (a) Schematic density of states of a single SWCNT structure. The valance band is coloured in blue and the conduction in grey. Solid arrows are optical transitions between the valance and conduction bands and dashed arrows are non-radiative intraband relaxation between the band levels. Adapted from Bachilo et al.1 (b) EEM map of the SWCNT sample showing the two emissive regions corresponding to v3 → c3 absorption followed by c1 → v1 emission (blue) and v2 → c2 absorption followed by c1 → v1 emission (green).
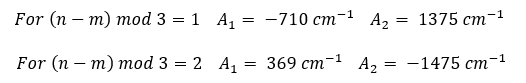
Empirical relationships between the E11 and E22 transition energies and the chiral indexes of the SWCNT structures were established by Bachilo et al.1 The energies of the E11 (emission) and E22 (excitation) transitions in wavenumber units (cm-1) are given by:
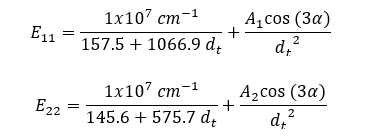
where A1 and A2 are constants that depend on the chiral index (n, m) of the SWCNT structure:
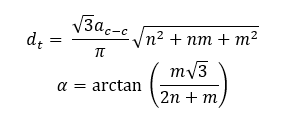
and dt and α are the SWCNT tube diameter and chiral angle respectively which can be calculated from the chiral indexes and the carbon-carbon bond distance ac-c = 0.144 nm:
 For example, a SWCNT structure with a chiral index of (7,6) has E11 and E22 transition energies of approximately 8900 cm-1 and 15,440 cm-1 respectively. Converting to wavelength, this corresponds to a peak in the EEM at an emission wavelength (λ11) of 1120 nm and excitation wavelength (λ22) of 648 nm. Using this methodology, the peaks in the EEM can be assigned to specific SWCNT structures as shown in Figure 5. The intensity of the photoluminescence peaks provides information on the relative concentration of the nanotube structures present in the sample and it can be seen from Figure 4 that this sample has an abundance of 9,4 and 7,6 structures. Hence, by using EEM analysis researchers can fully characterise the distribution of semiconducting nanotube structures present in a synthesised SWCNT sample.
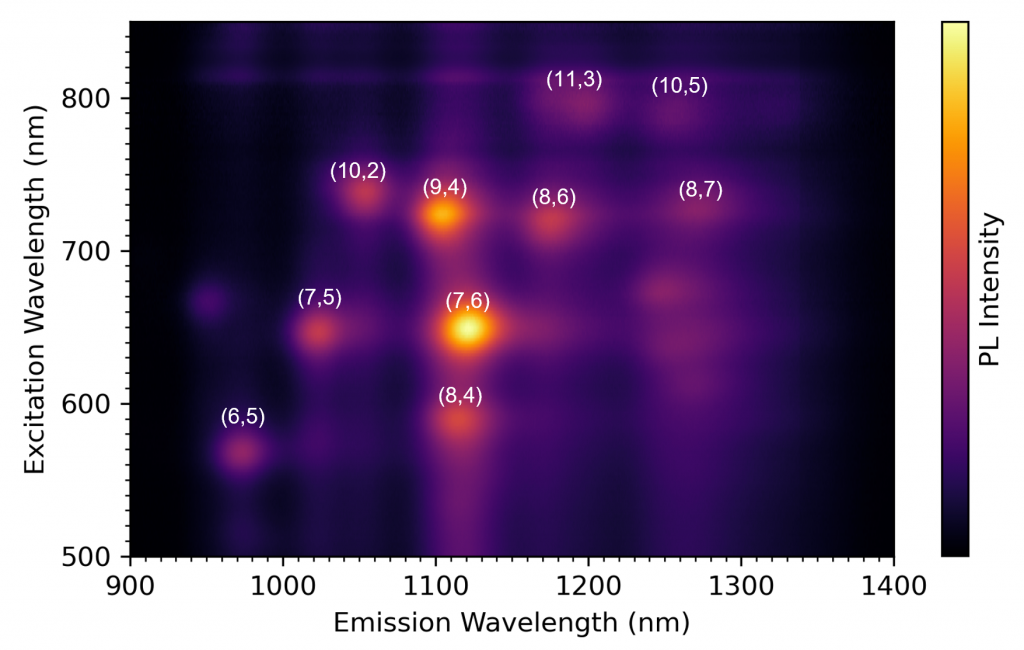
Figure 5: Identified SWCNT structures from the excitation emission matrix.
Conclusion
Excitation emission matrix spectroscopy with the FLS1000 Photoluminescence Spectrometer was used to identify the chiral structures present in a SWCNT sample. NIR EEMs of SWCNTs can be measured rapidly with an FLS1000 equipped with an InGaAs NIR camera.
References
Keep In Touch
Be the first to hear about our latest application notes, blog posts, product news and events by signing up to our eNewsletter or following us on social media using the links below.
