


Photoluminescence Spectroscopy of Carbon Dots
Introduction
Carbon dots are nanoparticles composed of carbon with diameters below 10 nm. They were accidentally discovered in 2004 by Xu, et al1 when researching methods to purify carbon nanotubes. Since their discovery they have received much attention from the Materials Science community as a potential alternative to semiconductor quantum dots, especially in biological applications due to their low toxicity. Some of their applications include photocatalysis, solar cells, bioimaging and drug delivery.
Carbon dots are composed of a mixture of sp2 and sp3-hybridised carbon atoms and functional groups such as –COOH, -NH2, and –OH. They can be synthesised by “top down” (starting from sp2 carbon materials such as graphite), or “bottom up” (carbonisation of small molecules) approaches (Figure 1). “Bottom up” syntheses produce very inhomogeneous carbon dots but they enable larger-scale production. Recently new forms of environmentally-friendly synthesis of carbon dots have emerged, with carbon dots being produced from waste oil, sucrose, or vegetables.2 Carbonisation of organic matter can be achieved by heating to temperatures above 200°C or by treatment with acids.

Figure 1: “Top-down” and “bottom-up” approaches for the synthesis of C-dots.
Many applications of carbon dots make use of their photoluminescence (PL). C-dots typically show good PL quantum yields and present a characteristic shift in their emission spectrum with excitation wavelength: longer excitation wavelengths shift the PL spectrum towards the red, in an apparent break of Kasha’s rule. This behaviour is easily identified in an Excitation-Emission Map (EEM) of the sample’s photoluminescence.
Several hypotheses have been proposed to explain the wavelength-dependent emission spectrum of carbon dots. One is the effect of carbon dot size, which is similar in semiconductor quantum dots.3 As the carbon particle decreases in size, quantum confinement takes place meaning that the particle is smaller than the de Broglie wavelength of the electron in the dot, creating a deviation from bulk properties. This confinement creates a quantisation of the energy into discrete levels in the conduction and valence bands, so the carbon dot can be understood as a “virtual atom”. The emission energy depends on the radius of the particle so that as the particle gets smaller, both the excitation and emission spectrum shift to shorter wavelengths. In a distribution of carbon dots with varying sizes, different subsets get preferentially excited as the excitation wavelength varies. As C-dots of different size are excited, the emission spectrum shifts with excitation wavelength.
Although size-dependent PL of carbon dots has been reported, it is not the only factor affecting the emission spectrum and in practice it is difficult to obtain a distribution with a narrow PL spectrum. Another potential explanation for the PL behaviour of carbon dots is the existence of different emissive sites on the surface of the dot.4 These sites are related to different defects on the surface, which are selectively excited depending on the wavelength used. Despite the large volume of research in this field, the mechanism of PL in carbon dots remains uncertain. This is partly due to the lack of strategies to selectively produce just one type of carbon dot structure. New synthetic approaches to control the degree of crystallinity and functionalisation of carbon dots are needed.
In this application note, we characterise an inhomogeneous distribution carbon dots (c-dots) produced by thermal treatment of milk. In this case carbonisation is achieved by simply heating up milk in air to 220 °C for 2 hours, and the photoluminescence spectra and lifetimes of the resulting C-dots are studied in an FLS1000 Photoluminescence Spectrometer equipped with an AGILE tunable white light source.
Experimental
Whole cow’s milk was diluted 1:1 in water and heated up in a conventional oven at 220 °C for 2 hours. The resulting black residue was collected and extracted with methanol and dichloromethane in order to obtain the high and intermediate polarity fractions of C-dots.5
Carbon dot solutions were placed in quartz cuvettes and measured in an FLS1000 Photoluminescence Spectrometer equipped with double monochromators, a 450 W Xe lamp, AGILE source, Time-Correlated Single Photon Counting (TCSPC) capability, standard cuvette holder, and standard PMT-900 detector. Excitation-emission maps were acquired automatically with the standard option provided in the Fluoracle software.
Results
Photoluminescence EEMs of C-dots extracted with dichloromethane and methanol are presented in Figures 2 and 3, respectively. Figure 2 shows characteristic C-dot emission in the range of 400 nm – 600 nm as well as a series of narrow UV bands when exciting at 300 nm – 350 nm (a). This band structure may be due to polyaromatic hydrocarbons, which can be present in heated milk.5 A close-up of C-dot emission (b) shows a very broad spectrum with a clear shift of its peak as the excitation wavelength moves towards the red.
Figure 3 shows an EEM of the methanol fraction of carbon dots. Interestingly, the narrow band structure is not present in the UV region (a) indicating that those compounds are not soluble in methanol. The C-dot region (b) is however very similar to the dichloromethane phase.
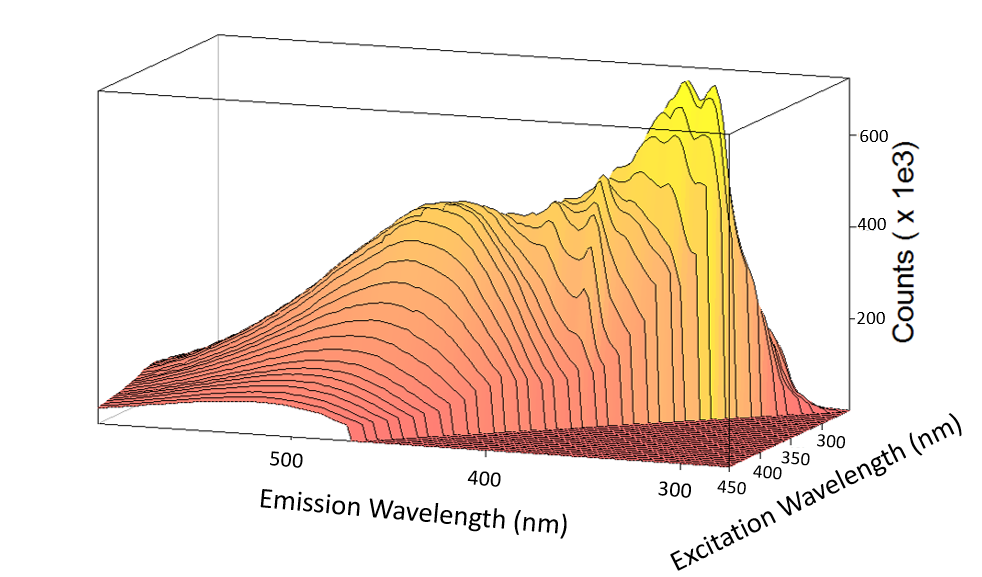
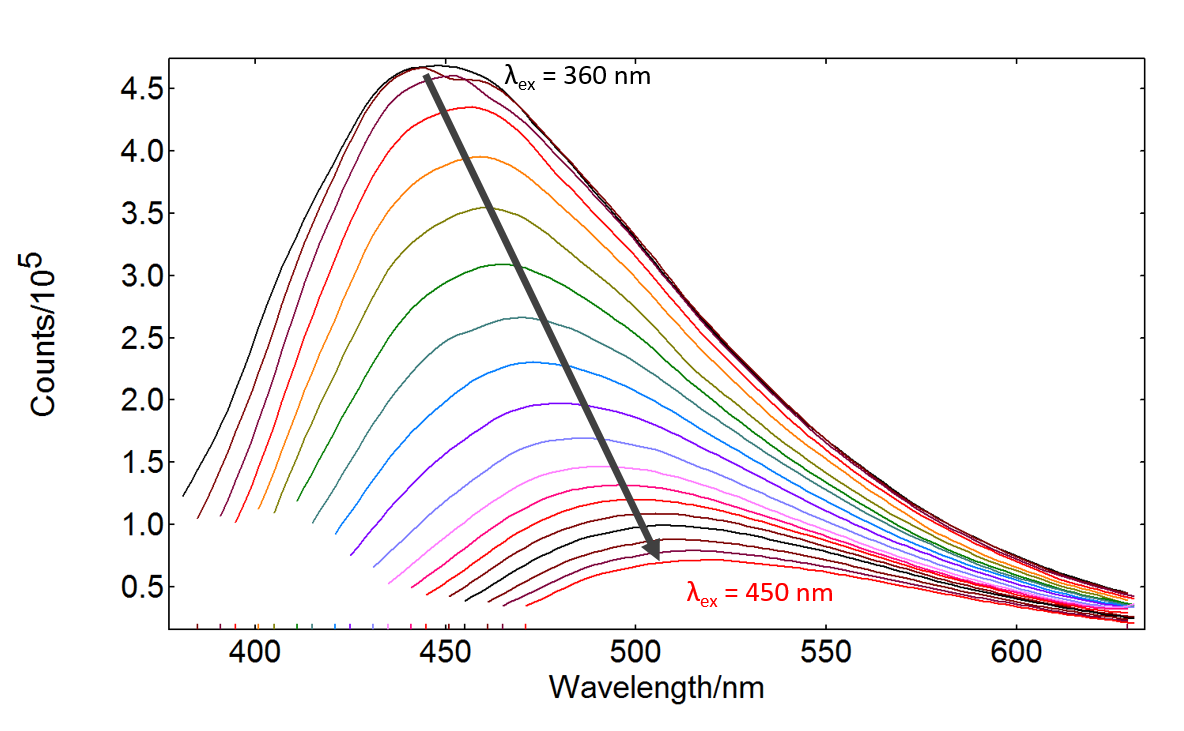
Figure 2: EEM of C-dots extracted with dichloromethane from heated milk: (a) 3D map, (b) 2D map of C-dot region (excitation wavelength shift indicated in the graph). Measurement conditions: Δλex = 3.00 nm, Δλem = 2.00 nm, λex step = 5.00 nm, λem step = 2.00 nm, dwell time = 0.5 s/step.
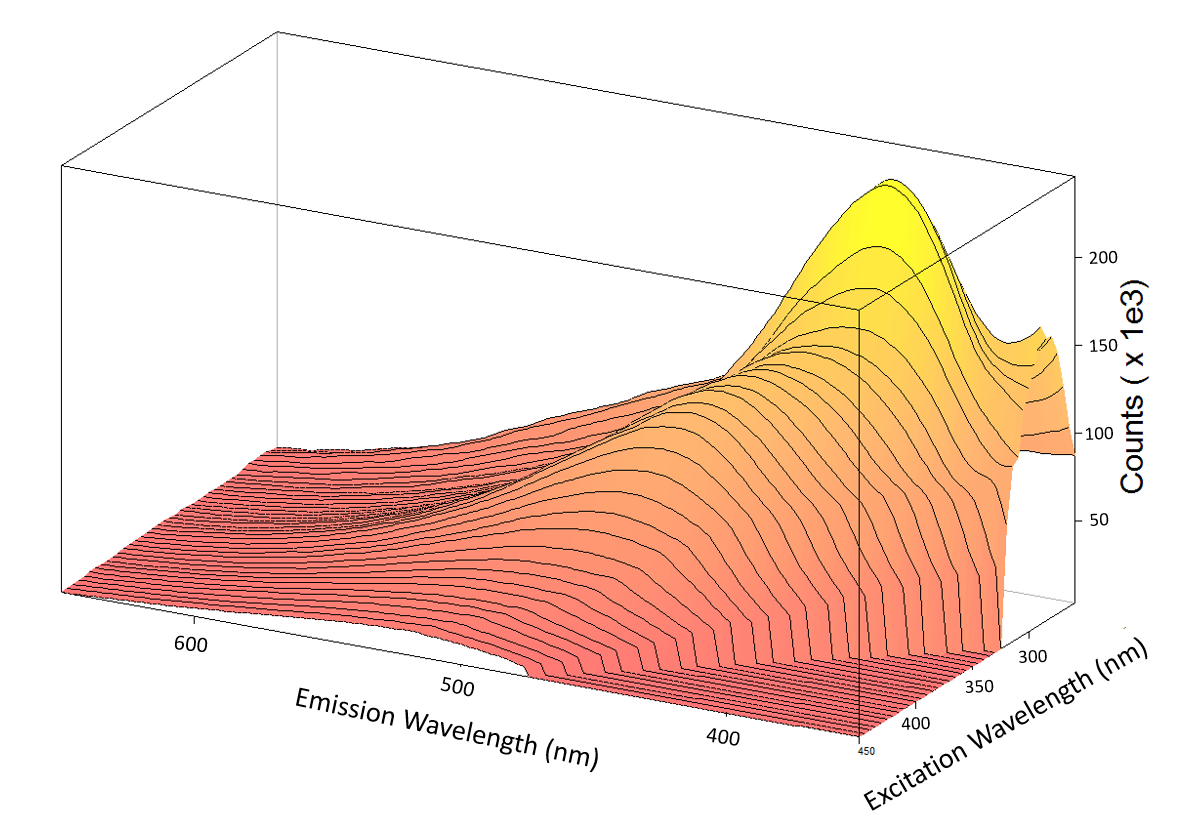
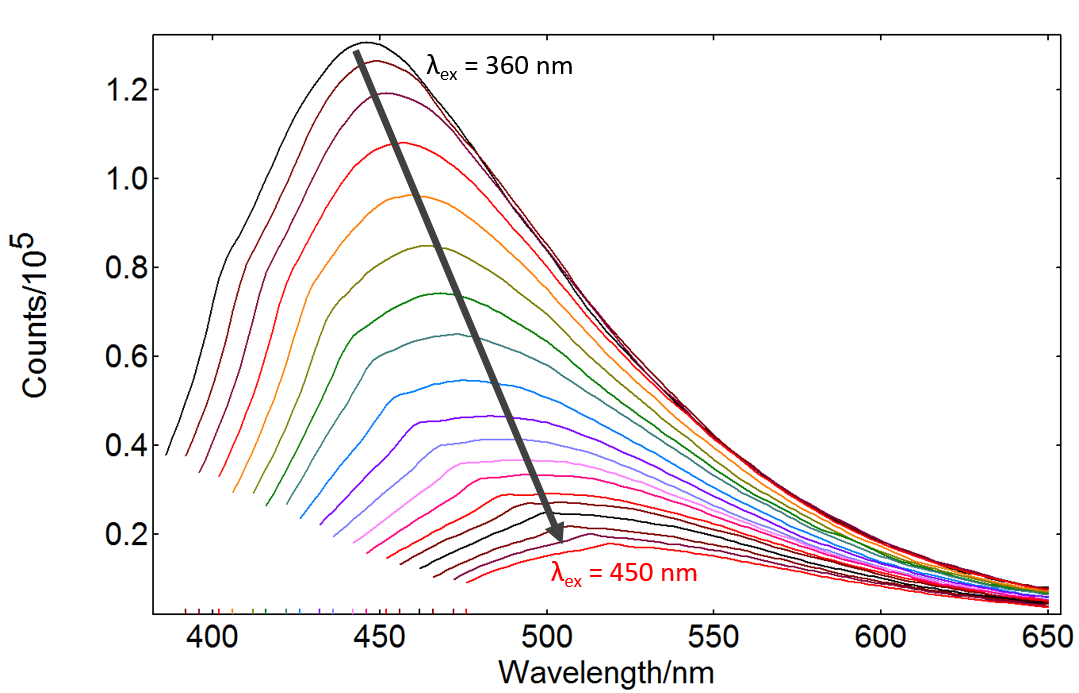
Figure 3: EEM of C-dots extracted with methanol from heated milk: (a) 3D map, (b) 2D map of C-dot region (excitation wavelength shift indicated in the graph). Measurement conditions: Δλex = 3.00 nm, Δλem = 2.00 nm, λex step = 5.00 nm, λem step = 2.00 nm, dwell time = 0.7 s/step.
Time-resolved PL measurements can offer further information on the luminescence mechanism of carbon dots. A Time-Resolved Emission Spectrum (TRES) is a sequence of PL lifetime measurements with varying emission wavelength which provides the spectral shift in emission as a function of time after the excitation pulse. TRES maps of both samples were acquired by Time-Correlated Single Photon Counting (Figures 4 and 5).
With a tunable TCSPC source such as AGILE, it is possible to study the PL lifetime as a function of excitation wavelength. This is known as excitation TRES and an example is shown in Figure 6. The results in Figure 6 show a dependence of lifetime with excitation wavelength, with longer decay times as the excitation shifts towards red wavelengths.
Both excitation and emission TRES evidence a clear increase in the PL lifetime at longer wavelengths; meaning that the emission spectrum shifts to the red with time as shown in the insets. This is unlikely to be a solvent relaxation effect due to the timescale of the process (it is typically ps rather than ns). The red shift could be due to the size distribution of the C-dots; however literature reports point to the opposite trend: larger C-dots emitting in the red possess shorter PL lifetimes.7 Therefore the most plausible explanation is the existence of different emissive sites which possess varying energies and PL lifetimes.
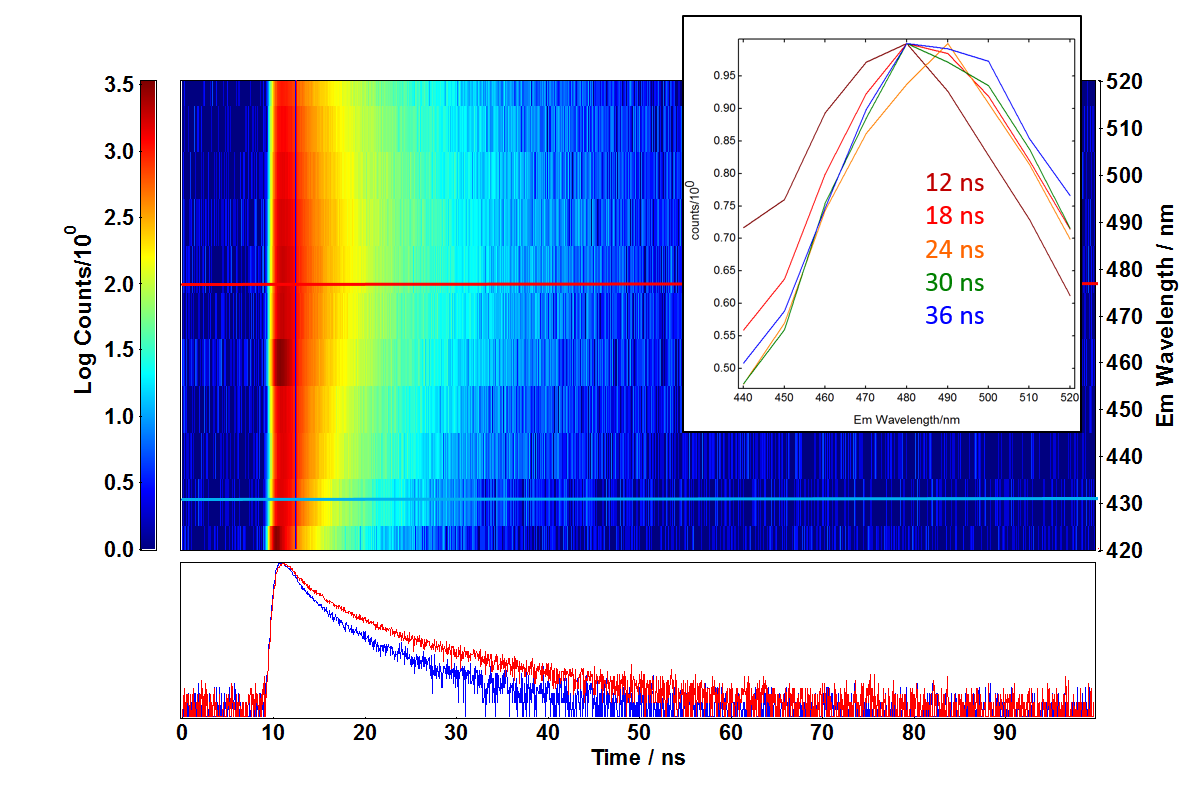
Figure 4. TRES of C-dots extracted with dichloromethane from heated milk, PL intensity colour code in the graph. The red and blue lines show the PL decays at 470 nm and 430 nm emission, respectively. The inset shows peak-normalised emission spectra integrated at different times in the decay (colour code in the graph). Measurement conditions: λex = 405 nm, Δλem = 5.00 nm, λem step = 10.00 nm, time resolution = 49 ps/channel, acquisition time = 5 minutes/decay.
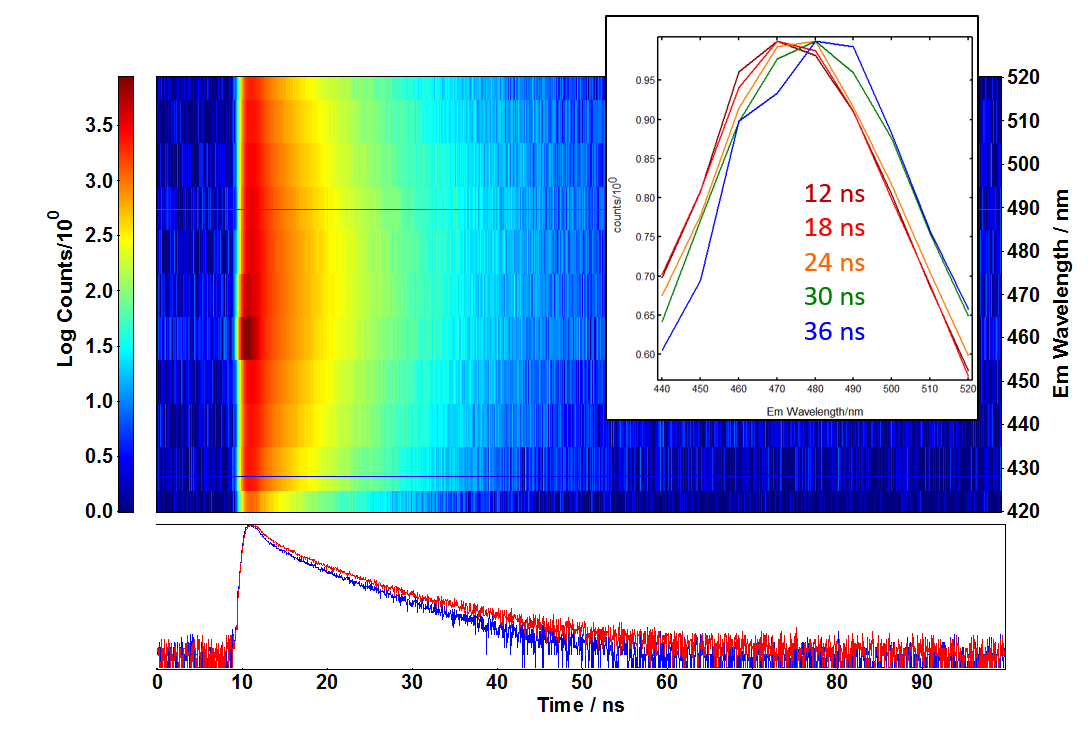
Figure 5. TRES of C-dots extracted with methanol from heated milk, PL intensity colour code in the graph. The red and blue lines show the PL decays at 490 nm and 430 nm emission, respectively. The inset shows peak-normalised emission spectra integrated at different times in the decay (colour code in the graph). Measurement conditions: λex = 405 nm, Δλem = 5.00 nm, λem step = 10.00 nm, time resolution = 49 ps/channel, acquisition time = 5 minutes/decay.
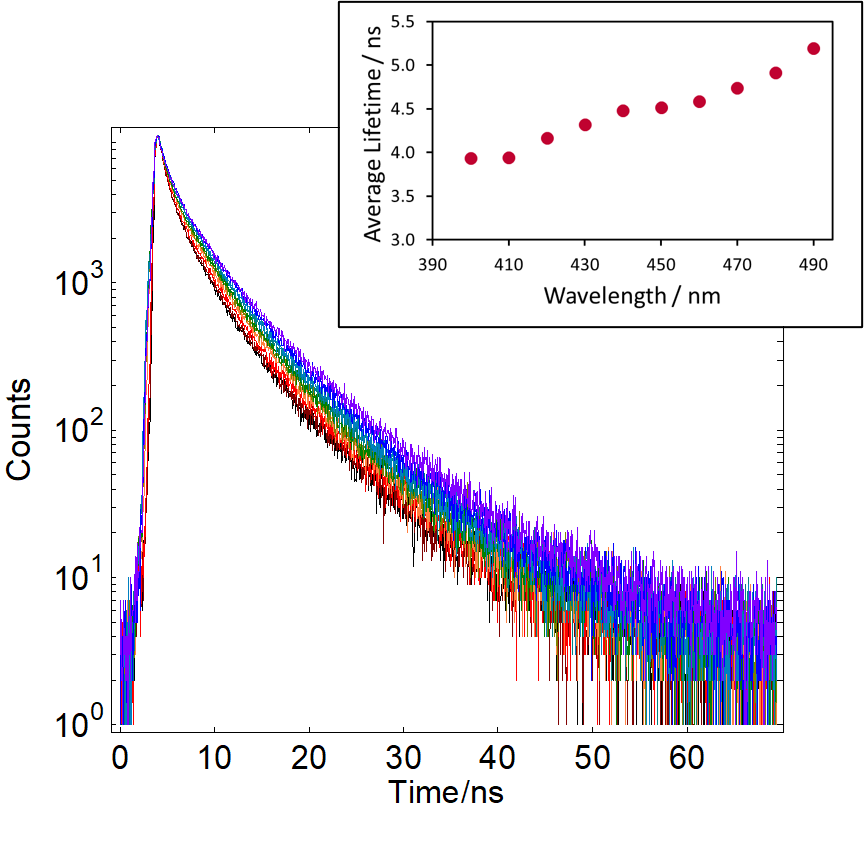 Figure 6: Excitation TRES of C-dots extracted with methanol from heated milk, excitation from 400 nm (black) to 490 nm (red) in 10 nm steps. The inset shows the fitted average lifetime as a function of excitation wavelength. Measurement conditions: λem = 500 nm, Δλem = 1.00 nm, time resolution = 49 ps/channel.
Conclusions
Thermal treatment of milk is an easily available, environmentally friendly method to produce carbon dots. The C-dots are easily characterised in an FLS1000 photoluminescence spectrometer using the excitation-emission map option available in the software. Time-resolved excitation and emission spectra using a tunable TCSPC source provide information on the PL mechanism and evidence the heterogeneous character of the carbon dots studied.
References
2. R. Das, R. Bandyopadhyay, P. Pramanik, Materials Today Chemistry 8, 96-109 (2018)
3. Edinburgh Instruments, Photophysical Characterisation of Perovskite Quantum Dots (2018)
7. K. Hola, et al, Carbon 70, 279-286 (2014)
