


How to Reduce Fluorescence in Raman Spectroscopy
Introduction
Raman scattering and fluorescence are fundamentally different phenomena.1 In Raman scattering, which is an inherently weak effect, the interaction between a molecule and an incident photon causes the promotion of that molecule to a very short-lived ‘virtual’ excited state, and when it relaxes via a radiative transition it is returned to a different vibrational energy level within the electronic ground state. On the other hand, fluorescence, which is the significantly more intense of the two effects, involves the absorption of light by a molecule and its subsequent excitation to a higher electronic energy state. From this excited energy level, the molecule relaxes to the ground energy state via vibrational relaxation followed by a radiative transition. The two effects can be visualised and compared with the aid of a Jablonski diagram, Figure 1. Both Stokes Raman scattering and fluorescence result in the emission of radiation that is lower in energy, and therefore at a higher wavelength than the incident radiation. The practical consequence of this in Raman spectroscopy is that intense fluorescence emissions from a sample can obscure weaker vibrational fingerprints and reduce the quality of spectra.
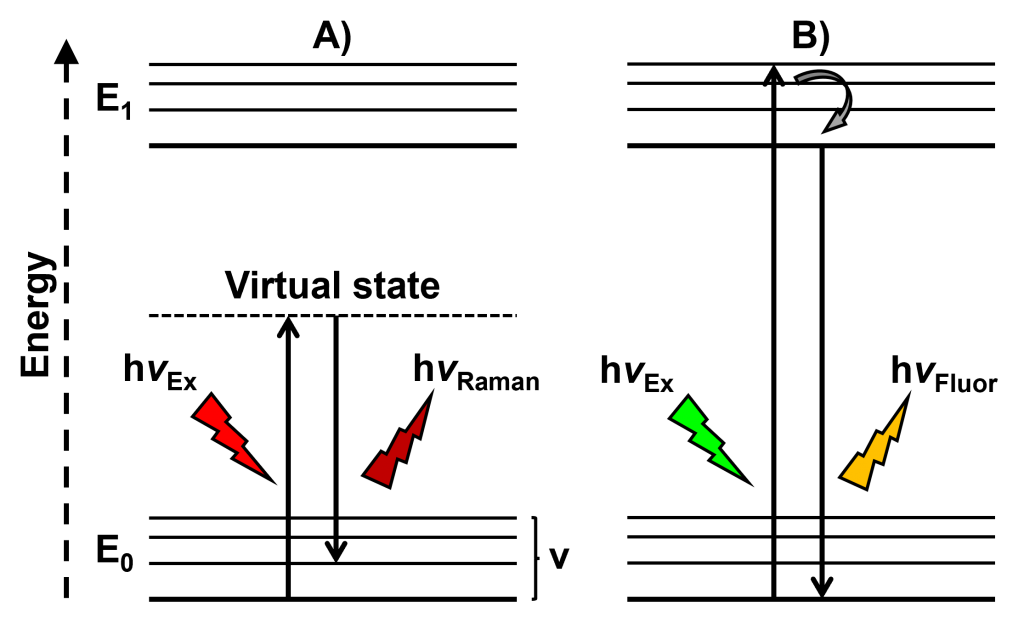
Figure 1: Simplified Jablonski diagrams comparing the radiative and non-radiative transitions involved in A) Stokes Raman scattering and B) fluorescence.
This Technical Note discusses techniques for dealing with fluorescence in Raman spectroscopy. It covers various hardware and software considerations for reducing fluorescence and improving the quality of Raman spectra, including describing the effects of the laser excitation wavelength, the diameter of the confocal pinhole, the groove density of the diffraction grating, background subtraction, and photobleaching of the sample.
Excitation Wavelength
λFluorescence is independent of λEx, λRaman is determined by λEx
One of the key properties of fluorescence is that the emission wavelength is generally independent of the excitation wavelength. This is a consequence of Kasha’s rule, which states that fluorescence will always originate from the vibrational ground state of the lowest excited singlet level.2 Furthermore, as can be observed in the Jablonski diagram in Figure 1, fluorescence occurs when the energy of the excitation light source induces an electronic transition to occur within the sample. In contrast to this, the wavelength of Raman scattering does change in proportion to the excitation wavelength.3 Raman spectra can be obtained using a multitude of different lasers with excitation wavelengths in the ultraviolet, visible, and near-infrared (NIR) regions of the electromagnetic spectrum. One method to suppress fluorescence during measurements is to select a laser with an excitation wavelength that avoids the spectral window in which fluorescence excitation occurs.
A gemstone was analysed using excitation wavelengths of 532 nm and 785 nm to demonstrate the effect of excitation wavelength on fluorescence background. The gemstone generated a broad fluorescence band with a peak at 590 nm when excited with the 532 nm laser, Figure 2A, which significantly increased the baseline of the Raman spectrum. However, when the excitation wavelength was increased to 785 nm, it was observed that the fluorescence background was removed, Figure 2A.
The benefit of the NIR excitation can more clearly be seen by plotting the spectra on a wavelength scale x-axis, Figure 2B. As the excitation wavelength is increased into the NIR the Raman bands no longer overlap with the fluorescence band. As shown in the Jablonski diagram in Figure 2B, the 785 nm laser was insufficient energy to induce an excited electronic state within the sample. NIR lasers such as 785 nm and 830 nm are extremely popular in Raman spectroscopy because they strike an excellent balance between minimising fluorescence and producing strong Raman intensities.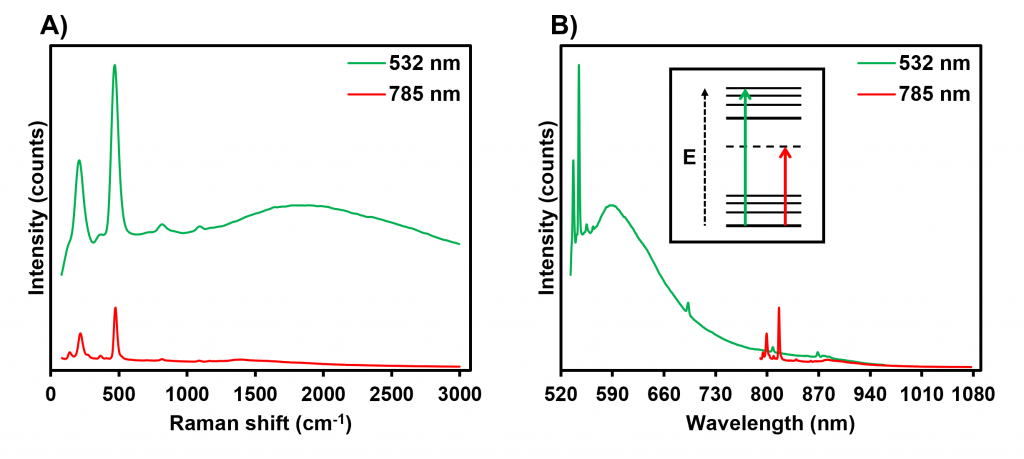
Figure 2: Raman spectra of a gemstone acquired using 532 nm and 785 nm excitation displayed on A) wavenumber and B) wavelength scales.
Confocal Pinhole Diameter
Closing the confocal pinhole reduces fluorescence from the surrounding sample volume
In confocal Raman microscopy, the pinhole is primarily used to control the spatial resolution during spectral acquisition and imaging. The schematics in Figure 3 show how changing the confocal pinhole’s diameter influences the microscope’s spatial resolution. Decreasing the confocal pinhole diameter decreases the volume of the sample from which Raman scatter is detected, thus improving the resolution. The confocal pinhole may also be used to reduce fluorescence backgrounds in Raman spectroscopy. This is particularly the case when the fluorescence signals are generated by species in the sample excitation volume surrounding the focal plane of interest. By closing the confocal pinhole and limiting the collection volume to the exact area of interest in the focal plane, the contribution of fluorescence signals from the sample surrounding the focal plane is reduced, which in turn improves the quality of the Raman spectrum generated.
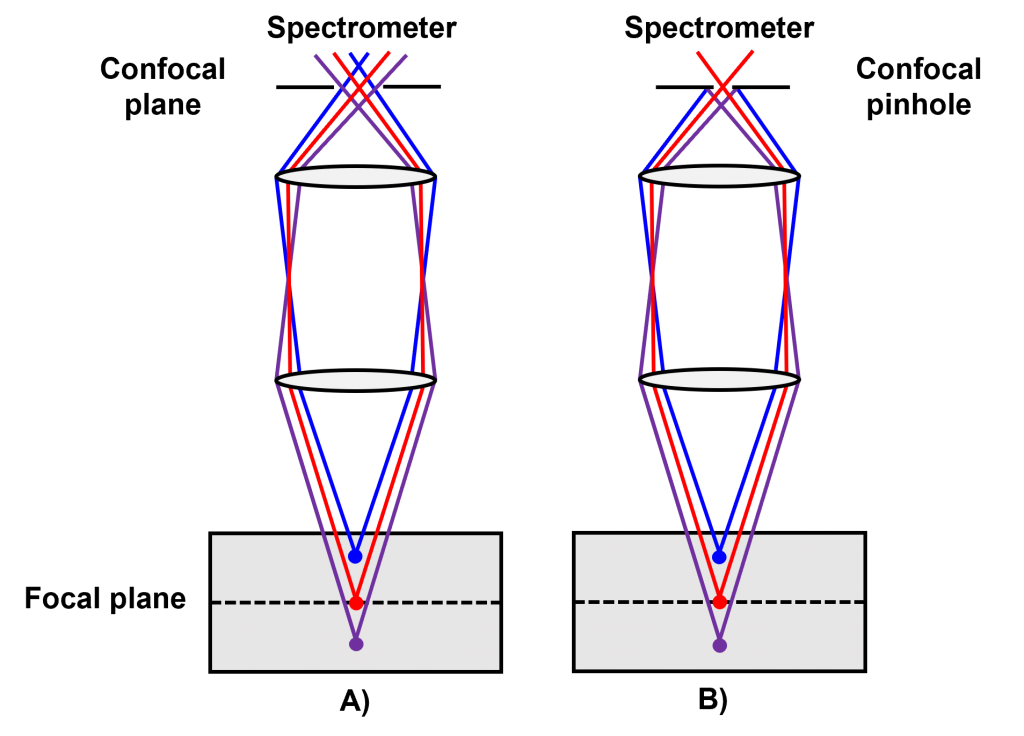
Figure 3: The effect of the confocal pinhole in an A) wide diameter position and B) small diameter position.
To demonstrate this a pharmaceutical tablet was analysed using a 532 nm laser and multiple confocal pinhole diameters between 2 mm and 50 μm, Figure 4A. It was observed that when the confocal pinhole diameter was set at 2 mm, the Raman spectrum contained a large fluorescent background, and as the pinhole diameter was decreased, the background decreased relative to the Raman bands. The quality of each Raman spectrum was assessed using the sensitivity of the highlighted band, which is a parameter that calculates the contrast of the selected band against the spectral background. This analysis, displayed in Figure 4B, demonstrates that as the confocal pinhole diameter is decreased, the contrast of the main Raman band against the fluorescent background increases exponentially because of the significant reduction in fluorescence that originated from the sample volume surrounding the focal plane. Reducing the diameter of the confocal pinhole is an effective method for dealing with fluorescence interference and improving the quality of Raman spectra.
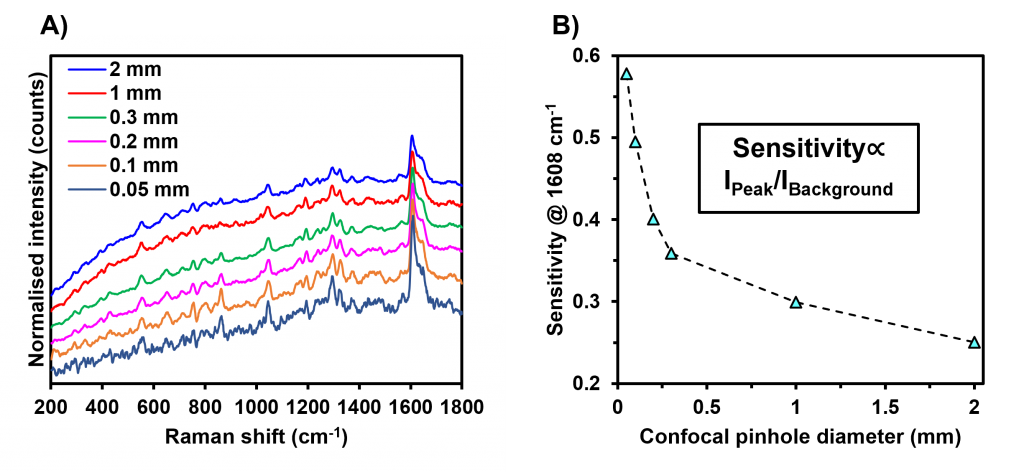
Figure 4: Effect of the confocal pinhole diameter in the suppression of fluorescence. A) Raman spectra of a pharmaceutical tablet measured using an excitation wavelength of 532 nm and different confocal pinhole diameters. B) Scatter plot measuring the sensitivity of the highlighted band versus the diameter of the confocal pinhole.
Groove density of the diffraction grating
A high groove density grating can be used to avoid fluorescence bands in a Raman spectrum.
The choice of the diffraction grating can be used to minimise the negative effects of fluorescence interference in a Raman spectrum. This is particularly useful when a sample exhibits Raman scattering and fluorescence bands in different spectral regions because the diffraction grating can be changed to focus only the Raman scattered light onto the detector, as shown in Figure 5. In Figure 5A, a hypothetical sample is excited with a 532 nm laser, and the Stokes-shifted polychromatic light, including a fluorescence band in the red region, enters the spectrometer and is dispersed onto the detector. The low groove density grating induces low levels of dispersion, such that the range in the resulting spectrum is enhanced at the expense of resolution. When a higher groove density diffraction grating is used, Figure 5B, the polychromatic light is dispersed over a larger area and therefore the spectral resolution is increased at the expense of range. The fluorescence band can hence be excluded entirely from the resulting spectrum.
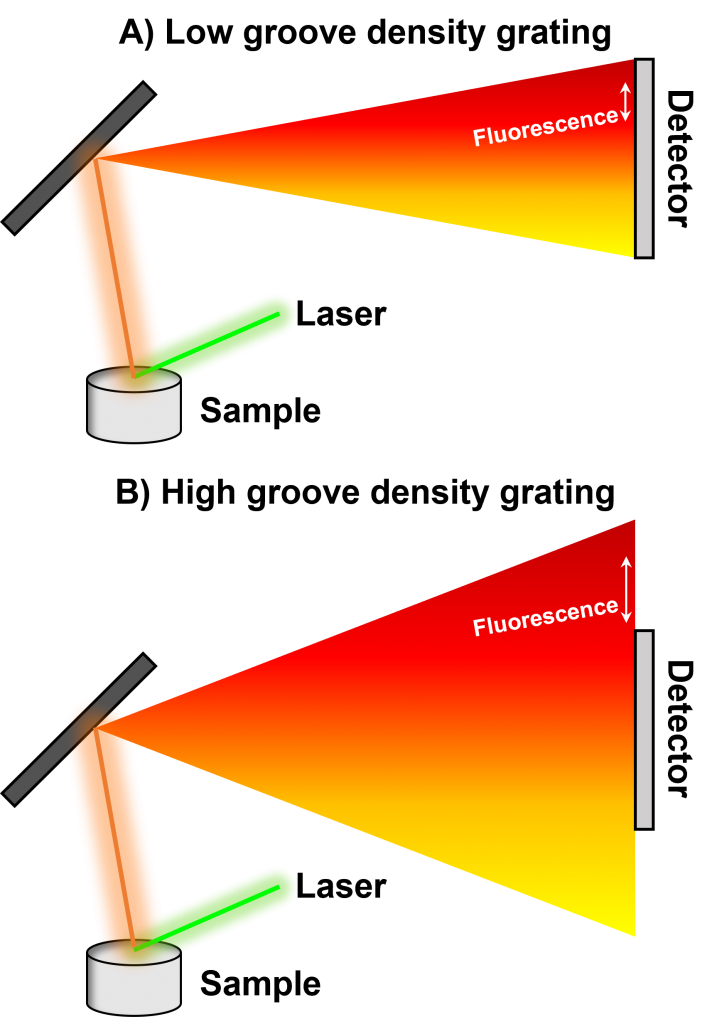
Figure 5: Schematic illustrating the effect of the diffraction grating groove density in avoiding fluorescence bands in Raman spectroscopy. A) Raman measurement using a low groove density diffraction grating. B) Raman measurement using a high groove density diffraction grating.
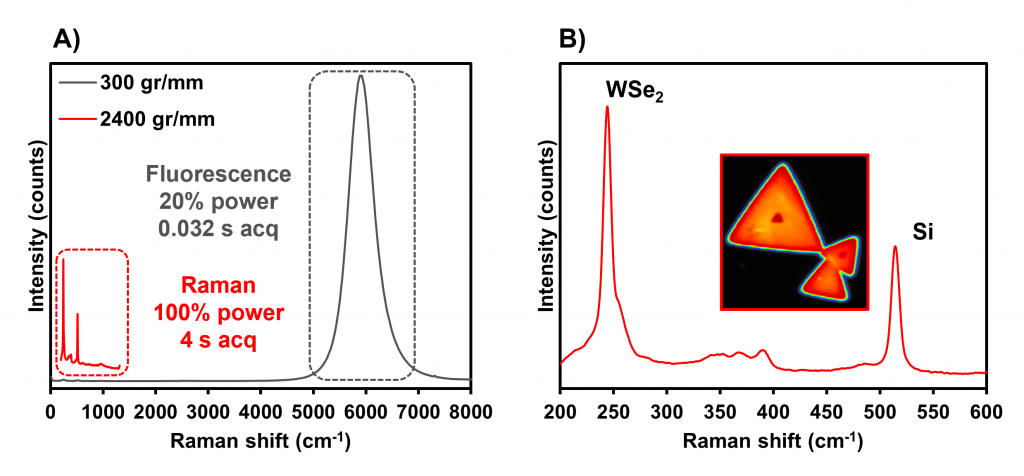
Figure 6: Raman spectroscopic analysis of WSe2. A) Plot containing spectra acquired with diffraction gratings with groove densities of 300 gr/mm (grey) and 2400 gr/mm (red). B) Spectrum acquired with a diffraction grating of 2400 gr/mm. The inset image displays a Raman map of the sample.
A good example of a material that exhibits both effects simultaneously, but in different spectral regions, is tungsten diselenide (WSe2). Here, crystals of WSe2 fixed on a silicon substrate were analysed under 532 nm excitation using multiple diffraction gratings, with different groove densities, to investigate the settings that maximised the quality of the resulting Raman spectrum, Figure 6. The 300 gr/mm diffraction grating collects a large spectral range, between 0 cm-1 and 8000 cm-1 which results in the strong fluorescence from the sample at 5887 cm-1 being the dominant feature in the spectrum. The laser power and spectral acquisition time had to be reduced to prevent the fluorescence emission from saturating the CCD camera. The consequence of this was that the Raman band from the sample at 244 cm-1 was very low in intensity. The 2400 gr/mm diffraction grating improves the spectral resolution and reduces the observable spectral range. In this example, because the characteristic Raman band for the material occurred at a lower wavenumber than the fluorescence band, it was desirable to use a high groove density grating that dispersed only the Raman scattered photons onto the detector. Since the fluorescence band was no longer focused on the detector, saturation was not a factor in selecting the spectral parameters and so the laser power and acquisition times could be increased. This resulted in strong Raman bands for both the WSe2 crystal and the underlying silicon.
Background Subtraction
Background subtraction eliminates underlying fluorescence signals during data processing
Background removal algorithms are useful for eliminating underlying fluorescence signals that interfere with Raman spectra. Unlike the previously discussed techniques, which all use different components of the confocal Raman microscope to physically prevent fluorescence emissions from impacting the detector, this method eliminates fluorescence after the data has been recorded. This is possible using Ramacle®, the software package for instrument control of the Edinburgh Instruments RM5 and RMS1000 microscopes and comprehensive data analysis. Ramacle® contains a ‘subtract background’ function that subtracts a variable background, often constituting fluorescence, from a single spectrum or a set of spectra contained within a single data window. The algorithm uses a Savitsky-Golay filter to determine the background, and it subtracts it by utilising the fact that the baseline curvature is often much less than that of the Raman signatures within a spectrum. The filter size, which can be selected by the user, determines the degree to which the background is subtracted, and this parameter may be adjusted to alter the degree of subtraction depending on the complexity of the sample and to avoid unwanted changes or artefacts in the processed spectrum. The filter can be applied to single spectra and entire data sets containing Raman maps and kinetic studies.
To demonstrate how this method removes fluorescence interference from Raman spectra, fixed mammalian tissue was measured using 532 nm excitation. The resulting spectrum was compared before and after applying the background subtraction algorithm, Figure 7. The application of a background subtraction algorithm to the initial spectrum of the tissue, which contained a complex background profile attributable to fluorescence emission, resulted in a flat Raman spectrum containing only information from the vibrational modes of the sample. This technique is valuable specifically when Raman bands are intense enough to be observed above fluorescence emissions and not be completely obscured in the raw spectrum. Under such conditions, background subtraction enables easier sample identification from spectral databases and allows for clearer spectra to be acquired for reports and publications.
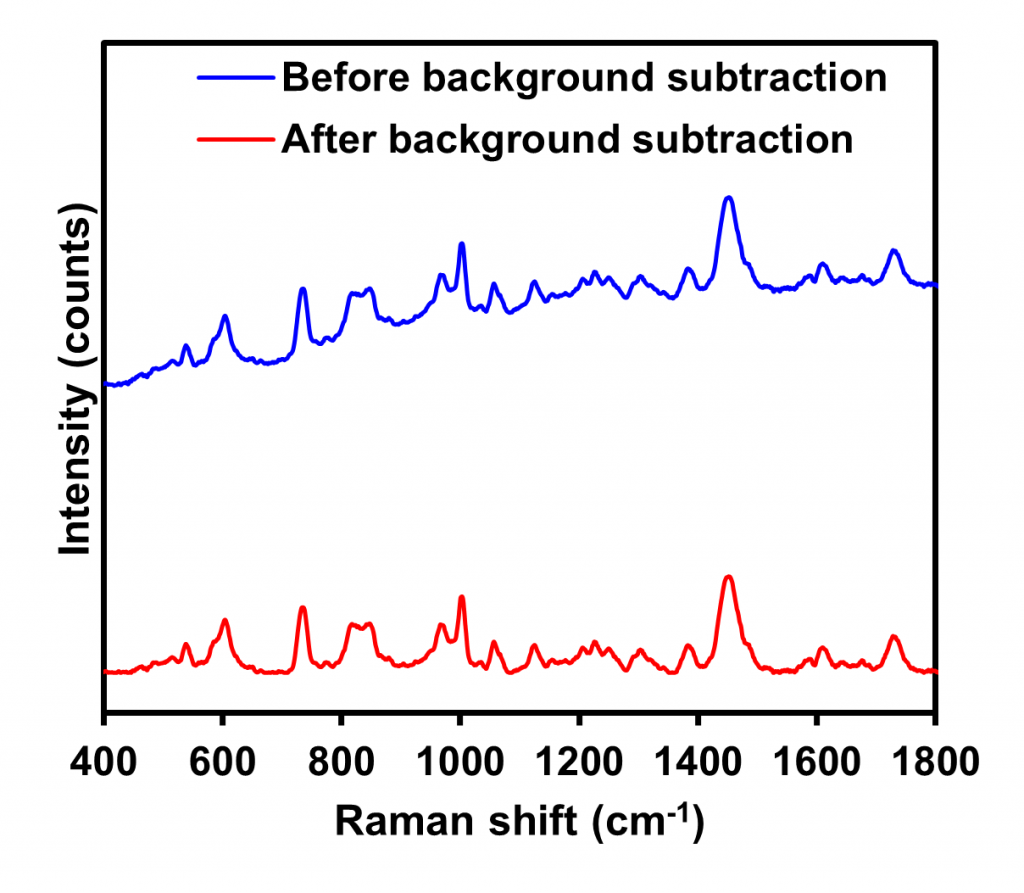 Figure 7: Raman spectroscopic analysis of fixed mammalian tissue before (blue) and after (red) the application of a Savitsky-Golay filter background subtraction algorithm.
Photobleaching
Pre-exposure of samples to laser irradiation reduces fluorescence backgrounds in Raman spectra
Photobleaching is a phenomenon that causes the chemical alteration and photodegradation of a dye or fluorophore to the extent that it becomes permanently incapable of emitting fluorescence.4 It occurs because organic fluorophores can only withstand a limited number of cycles of excitation and ground state relaxation before being subjected to irreversible damage. Although photobleaching is an important factor to consider in fluorescence spectroscopy because it can lead to unwanted complications during imaging and time-sensitive studies, it may be exploited in Raman spectroscopy primarily because it quenches fluorescence backgrounds and therefore improves the contrast of Raman bands in spectra. In Raman spectroscopy, one photobleaching method involves irradiation of the sample with the laser from a spectrometer or confocal microscope for a sustained period immediately before spectral acquisition.
To demonstrate the benefits offered by the photobleaching of fluorescent species within a sample immediately before performing analysis, the Raman spectrum of a bar of white chocolate was collected before and at increments of 20 minutes during a period of 60 minutes in which it was continuously irradiated with a 638 nm laser, Figure 8. In the spectrum of the sample collected before photobleaching was applied, Figure 8A, a large fluorescence band was present across the entire spectral range measured, with a peak in the fingerprint region. After an initial 20 minutes of laser irradiation and photobleaching, this fluorescence band decreased considerably. As the photobleaching time was increased to 40 and then 60 minutes, the fluorescent background continued to decrease, although the reduction in fluorescence between these time points was significantly less than the drop-off in the first 20 minutes. The contrast of Raman bands in the fingerprint and high-wavenumber regions against the fluorescent background was again tracked, here against time, using the sensitivity of the bands, Figure 8B. The reduction in the fluorescent background over time as a result of photobleaching caused a simultaneous increase in the contrast of Raman bands in both spectral regions. It is clear from this example that photobleaching samples with laser irradiation before Raman spectroscopic analysis is an effective technique for reducing fluorescence interference in raw spectra.
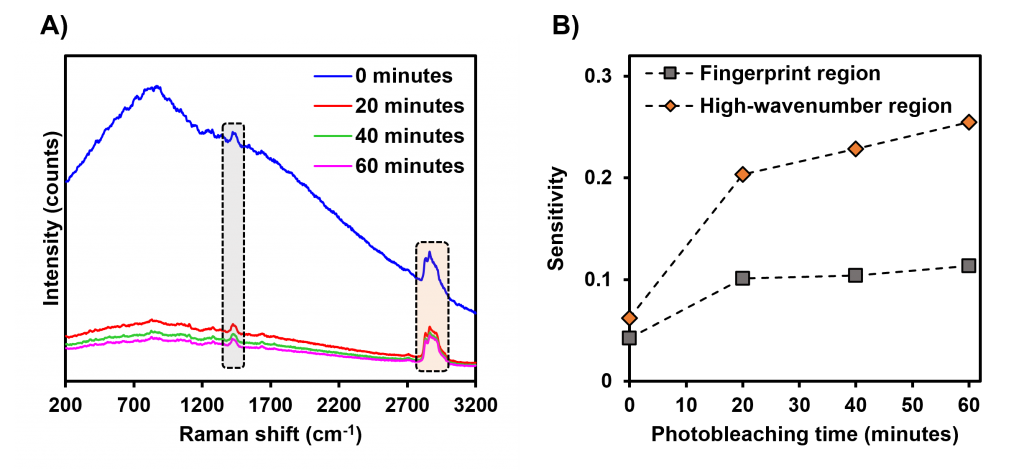 Figure 8: Effect of photobleaching on fluorescence suppression. A) Raman spectra of white chocolate before and after photobleaching using continuous irradiation of the sample with a 638 nm laser. B) Scatter plot measuring the sensitivity of the highlighted Raman bands in the fingerprint (grey) and high-wavenumber (orange) regions of the spectrum against the photobleaching time.
Conclusion
Fluorescence interference in Raman spectroscopy is a prevalent issue, however, it can be dealt with effectively using a variety of different methods. Settings that control the hardware of the confocal microscopy system, such as the laser excitation wavelength, the confocal pinhole’s diameter, and the diffraction grating’s groove density, can all be optimised during Raman measurements to physically prevent fluorescence from reaching the detector. The laser from the system may also be used to photobleach the sample and prevent it from producing fluorescence, thus improving the contrast of Raman bands against the spectral background. Alternatively, if the fluorescence emission from the sample causes elevated spectral background levels underneath Raman signatures that remain visually resolvable, then a background subtraction algorithm can be used to remove fluorescence and enhance the quality of the spectrum during data processing.
It is important to note that no solution will work for every sample, and the selection of the necessary parameters for a given experiment will depend on multiple factors, including the Raman and fluorescence cross-sections of the analyte under investigation, the susceptibility of the sample to burning, acquisition times, spatial and spectral resolution needs, and the spectral range required by the user. However, with the high degree of customisation and automation offered for all hardware and software parameters by Edinburgh Instruments RM5 and RMS1000 Raman Microscopes, it is easy for the user to optimise the configuration for their individual research needs.
References
- J. Clarke et al., Fluorescence and Light Scattering, J. Chem. Educ., 2004, 81, 705, DOI: 10.1021/ed081705
- N. Lewis et al., Phosphorescence and the Triplet State J. Am. Chem. Soc., 1944, 66, 2100–2116, DOI: 10.1021/ja01240a030
- E. Smith et al., In Modern Raman Spectroscopy: A Practical Approach, John Wiley & Sons Ltd, 2nd edn, 2019, vol. 1, ch. 3, pp. 77–99, DOI: 10.1002/9781119440598
- A. P. Demchenko, Methods Appl. Fluoresc., 2020, 8, 022001, DOI: 10.1088/2050-6120/ab7365
Keep in Touch
If you have enjoyed this technical note, be sure to follow us social media and sign up to our eNewsletter using the links below.
