


Automation of Photoluminescence Measurements using Batch Mode Scripting
Introduction
In both industrial and academic research labs, there are occasions where the same sequence of measurements needs to be repeated multiple times. In other times it is necessary to run a long sequence of tests for the same sample. These cases are quite time-consuming for the operator requiring their presence near the instrument to set a new measurement each time. To aid these experiments, Edinburgh Instruments photoluminescence spectrometers offer the possibility to script a sequence of measurements using the Batch Mode feature in the Fluoracle® software. In this technical note we describe the operation of Batch Mode and demonstrate two examples where it is useful: temperature maps of anisotropy and measurements on multiple samples.
Temperature Dependence of Photoluminescence Emission and Anisotropy
The solvation environment around an emitting molecule has substantial impact on its photoluminescence (PL) characteristics. Collisions between an excited fluorophore and solvent can relax the fluorophore into its ground state without the emission of light (this is known as collisional quenching). In addition, the solvent affects the mobility of the molecule, which in turn is related to its fluorescence anisotropy.1 Sample temperature affects both the observed anisotropy and the extent of collisional quenching: as the temperature increases, the molecule becomes more mobile and collisions more frequent. These processes can be followed by temperature maps of anisotropy and emission spectra, respectively. In Fluoracle, it is possible to set up an automated temperature map so that the software acquires a spectrum at each user-defined temperature; however this would involve setting up two separate maps. By using Batch Mode instead, the operator can acquire all the data in one measurement saving valuable laboratory time.
As an example, we have studied the well-known fluorophore Rhodamine B. Rhodamine B has a series of transitions with varying fundamental anisotropy, which is determined by the angle between excitation and emission transition moments. Its wavelength-dependent anisotropy can be detected by PL spectroscopy depending on the solvent used. It is usually observed in a viscous solution such as glycerol where the rotation of the Rhodamine B molecules is slower than their fluorescence lifetime (an excitation anisotropy spectrum is shown in Figure 1). As the temperature increases, the viscosity of glycerol decreases and the Rhodamine molecules are freer to rotate, so the observed anisotropy decreases.2 At the same time, thermal energy translates into movement of the molecules in solution leading to more collisional quenching and a decrease in fluorescence intensity.
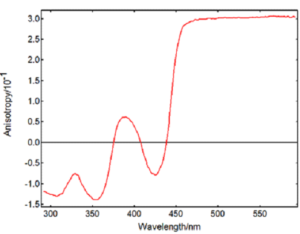
Figure 1: Excitation anisotropy spectrum from Rhodamine B in a glycerol-water mixture acquired in the FS5 spectrofluorometer. Measurement conditions: λem = 630 nm, Δλex = 3 nm, Δλem = 3 nm, 1 nm step, 1 s/step.
A cuvette with Rhodamine B in a 30% glycerol-water solution was placed in the SC-25 TE controlled sample holder and measured in the FS5 Spectrofluorometer. Figure 2 shows the batch measurement setup wizard in Fluoracle. The sequence is built from existing measurement files allowing the user to add repetition loops, delays between measurements, temperature changes or sample changes depending on the holder used.
The experiment was set from 30 °C to 65 °C in 5 °C steps and two types of spectra (excitation anisotropy and emission) were acquired at each temperature, removing the need for two individual maps.
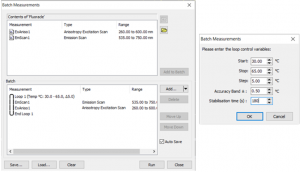
Figure 2: Temperature-dependent anisotropy and emission measurement setup in Batch Mode (left), parameter setup menu for the temperature loop (right).
The resulting maps are displayed in Figure 3. As expected, there is a clear decrease in fluorescence intensity and anisotropy as the temperature is increased. The anisotropy values at 500 nm excitation are plotted in Figure 4 together with the viscosity of the solvent.
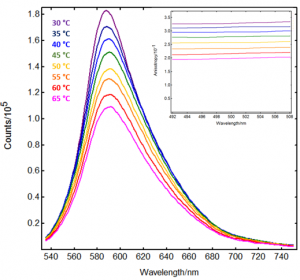
Figure 3: Temperature-dependent emission spectra and excitation anisotropy spectra (inset) from Rhodamine B in glycerol/water, acquired in FS5 Spectrofluorometer. Colour scheme indicated in the graph. Measurement conditions: λex (emission scans) = 479 nm, λem (anisotropy scans) = 570 nm, Δλex = 3 nm, Δλem = 3 nm, 1 nm step.
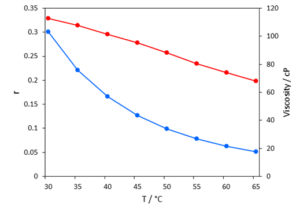
Figure 4: Anisotropy (blue) and viscosity (red) of Rhodamine B in glycerol/water as a function of temperature.
Reaction Kinetics with Multiple Sample Batch Measurements
The kinetics of a reaction may be studied by monitoring the absorbance or fluorescence from one of the reactants as a function of time. Both can be measured in the FS5 Spectrofluorometer thanks to being equipped with a transmission detector as standard. Here we have studied the kinetics of bleaching of Rhodamine B by sodium hypochlorite (NaOCl), which can help optimise the use of bleach as a disinfectant in the medical field.3 The reaction kinetics may depend on the concentrations of NaOCl and Rhodamine B with orders n and m, respectively:
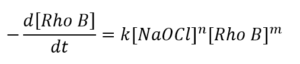
Therefore varying the concentrations of each reactant and measuring the rate can provide n and m (k is the reaction rate constant). This bleaching reaction takes place over the course of several minutes, so multiple sample measurements can be laborious and time-consuming. Thanks to the SC-27 four-position sample holder in the FS5, up to four different samples can be studied in a single batch measurement saving operator time.
The effect of reactant concentration on reaction rate was studied by preparing four solutions with different concentrations of NaOCl and Rhodamine B in water (Table 1). The solutions were placed in the SC-27 sample cassette and a batch script was built so that the sample position was changed after measuring transmission and fluorescence from each sample. Delays were added to the script to increase the time between data points. The batch measurement wizard is shown in Figure 5. The data was collected in 1 hour 30 minutes, whereas consecutive measurements in a single cuvette holder would have taken a whole day.
Table 1: Concentration of NaOCI and Rhodamine B in each of the four samples studied.
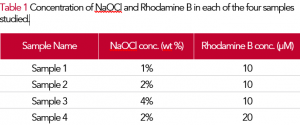
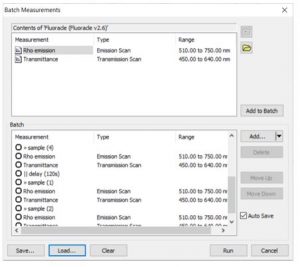
Figure 5: Batch measurement setup for the 4-position kinetics experiment.
The data acquired is plotted in Figure 6, normalised to the initial absorbance and fluorescence values for each run. Normalised absorbance and fluorescence are plotted for Sample 2 showing a similar trend as expected. The concentration of NaOCl has a dramatic effect on the rate, whilst the effect of Rhodamine B is more subtle. The initial reaction rates for each sample are summarised in Table 2: the results suggest a first order reaction for rhodamine B (m = 0.79) and second order for NaOCl (n = 1.7). This type of quick assessment provides a great starting point for further in-depth optimisation studies.
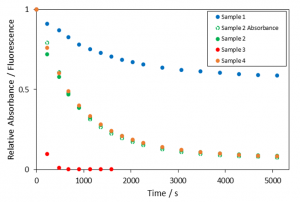
Figure 6: Normalised absorbance and fluorescence from Rhodamine B as a function of time in Samples 1 to 4 (colour coding indicated in the graph). Measurement conditions: λex (emission scans) = 500 nm, Δλex = 1.20 nm, Δλem = 1.20 nm, 2 nm step.
Table 2: Initial reaction rate observed for each of the samples.

Conclusions
Batch Mode scripting combined with sample accessories such as temperature-controlled and multiple-position holders expand the automation capabilities of Edinburgh Instruments photoluminescence spectrometers. Experiments that previously required an operator over several hours can now be set up in a single measurement. Features such as loops and delays allow the user to plan complex experiments, and to modify and repeat them as desired.
References
2. Viviane Devauges, et al., plos one 9(10), 110695 (2014)
3. Joyce Tiong, and Gareth J. Price, Ultrason Sonochem. 19, 358-64 (2012)
