


Quantum Yield Measurements of Powder Samples Using the Integrating Sphere
Accura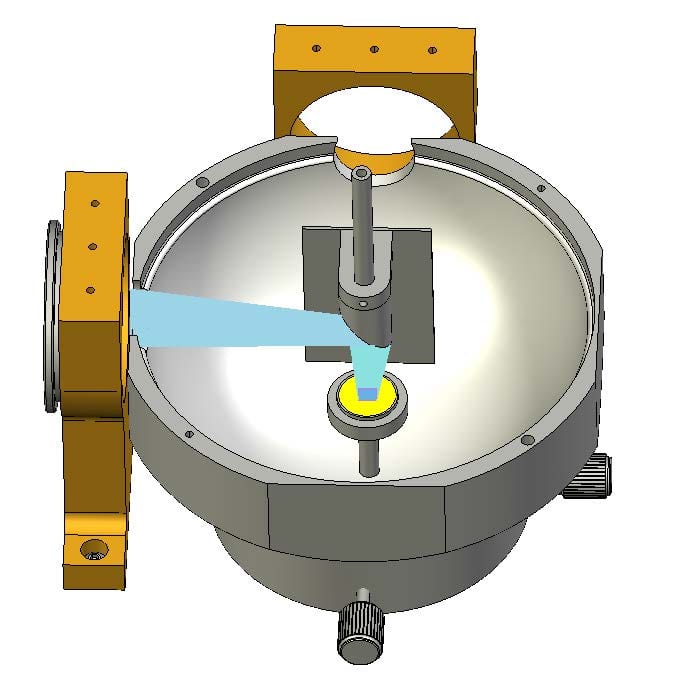 te Quantum Yield Measurements as well as precise measurements of the spectral dependence of reflection and/or absorption of powder samples, require an integrating sphere.
This removes ambiguities due to angular dependences, it increases repeatability of alignment when changing between samples and it is beneficial for the overall reproducibility. In addition, powder samples are ideally measured with the powder positioned on a tray and the excitation beam pointing downwards, normal to the sample. The integrating sphere for powder measurements (part number: 1-M-3) has been designed to meet the specific requirements for the measurements of spectral reflection, absorption and quantum yield of powders. The sphere replaces the standard sample holder inside the sample chamber. The two lens assemblies that are used for the standard sample holder have to be removed, and a special lens has to be inserted into the excitation path. No lens is required in the emission channel. The procedure of exchanging the two sample holders takes less than 3 minutes.
The sphere consists of two halves. The lower half is tightly fitted to the base of the sample holder by means of two thumb screws. The lower half contains a pillar that has a small dish for the exchangeable powder tray. The upper half of the sphere needs to be removed for sample exchange. A small elliptical mirror and a baffle plate are fitted to the upper half, for beam steering and shielding against directly detected light.
Theory of Reflectance, Absorbance, and Quantum Yield Measurements
The picture below graphically demonstrates two spectral scans made by scanning the emission monochromator, with the excitation monochromator fixed at 450nm. The first scan (blue) is a scan of a reference scatterer, which should have diffuse reflectance of 100%. The second scan (red) is a scan of the sample under investigation. This sample shows reflection (red, hatched) and emission (red, solid). The area of the blue graph (starting from the base line) is here referred to as ERef, the red hatched area will be ESam and the red solid area is called LSam.
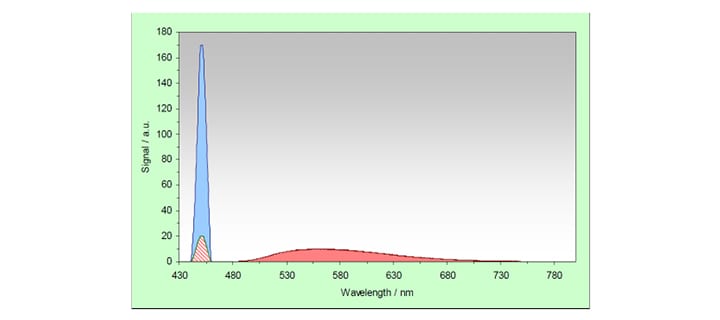
The following quantities can now be calculated:

The Reflectance, R, is the ratio of the scattered signal from the total diffuse reflecting standard and the sample. The Absorbance, A, is the logarithmic value (to the base of 10) of the inverse of the Reflectance. For the definitions in the table above the area under the two curves was used for the calculation. However, as both (Gaussian-like) shapes are identical the two quantities Reflectance and Absorbance can also be taken from each data point of the curves. Thus, reflectance and absorbance spectra can be measured by synchronously scanning both excitation and emission monochromators with zero wavelength offset.
The quantity Quantum Yield, η, is defined by the sum of all emitted photons, divided by the sum of all absorbed photons. The number of absorbed photons is given by the difference of the two scattered curves. It should be noted that precise spectral correction is essential for the quantum yield calculation. Note that this method is based on the direct measurement of the number of emitted and absorbed photons, it is often referred to as absolute method for the determination of the Emission Quantum Yield. A different method – also widely used and referred to as relative method for Quantum Yield Measurements – is the comparison to a reference standard with known emission quantum yield.
Measurements of the Spectral Reflectance and Spectral Absorbance
Reflectance measurements are made by using Synchronous spectral scans, with both excitation and emission monochromators stepping through the pre-set spectral range. The offset between emission wavelength and excitation wavelength in these synchronous scans is set to Zero, i.e. photons are recorded for identical wavelength settings of both monochromators. This way the Rayleigh (diffuse) scattered light is detected.
Two measurements are required: A spectral scan of the diffuse reflected light from the sample under investigation, and a second measurements under identical conditions with a reference scatterer in place of the sample. This reference scatterer is usually BaSO4, the same material that is used for the coating of the inner surface of the sphere.
A difficulty arises from the fact that signal intensities must be limited to approximately 2 million counts per second to avoid count rate saturation. The user must ensure that this level is not exceeded at any point of the spectrum. As the higher signal is that of the BaSO4 reference sample, tests should be carried out using this reference material to correctly set up the spectral band width of both monochromators as a means to control the overall signal intensity. Typical values are 10 nm spectral band width in the excitation channel and 0.2 nm in the emission channel.
Principally, uncorrected spectra are sufficient to calculate the reflectance curve, as the correction would fall out by the division of the two curves. However, simultaneous correction using the reference detector is recommended to correct for possible fluctuation of the light intensity of the xenon lamp. (As the spectral band width in the excitation is rather wide, the gain of the amplifier of the reference signal will have to be reduced.)
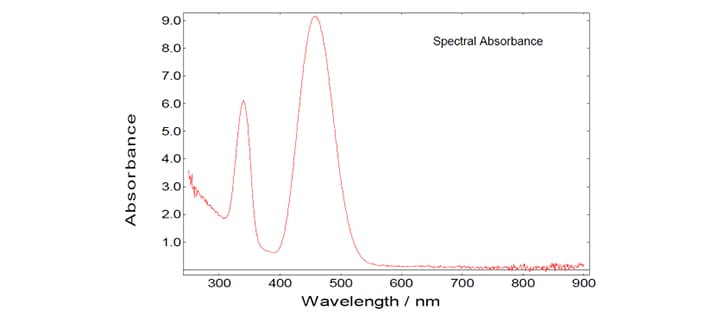
A typical measurement of both the reference scatterer (BaSO4) and a sample (YAG:Ce) are shown in the picture below.
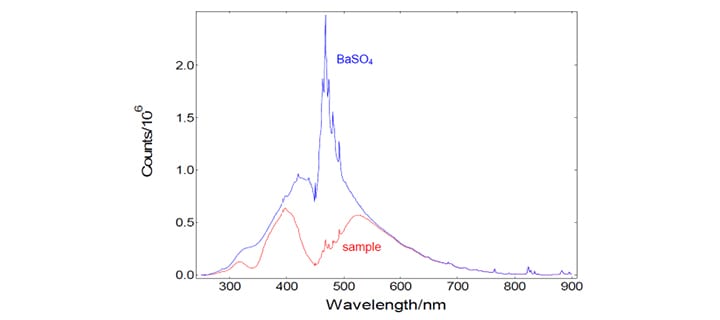
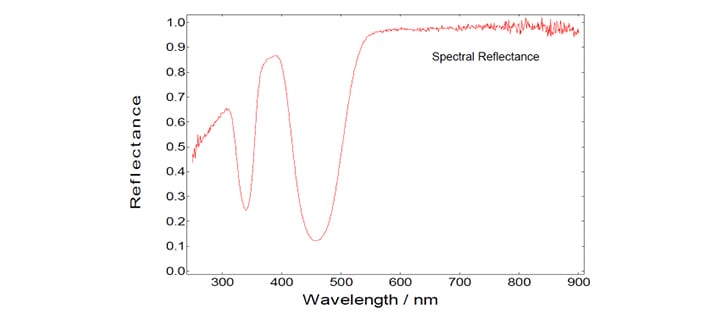
Using the two curves shown in the graph above, the spectral reflectance and the spectral absorbance can be calculated in a straight forward manner using the F900 spectrometer software:
Determination of the Emission Quantum Yield Measurements
The absolute determination of the emission quantum yield of an unknown sample requires the precise measurement of the emission spectrum and the measurement of the absorbed number of photons. The latter is performed by two spectral (emission) scans, with the emission monochromator scanning over the Rayleigh scattered light from the sample and from a 100% diffuse reflecting reference. The picture below contains these three measurements: Scattered light of BaSO4 (red), scattered light of the sample YAG:Ce (blue), and the emission of YAG:Ce (green). Note that those spectra were recorded by simultaneous detection of the signal from the reference detector, but they are not spectrally corrected in respect to the spectral function of the emission channel.
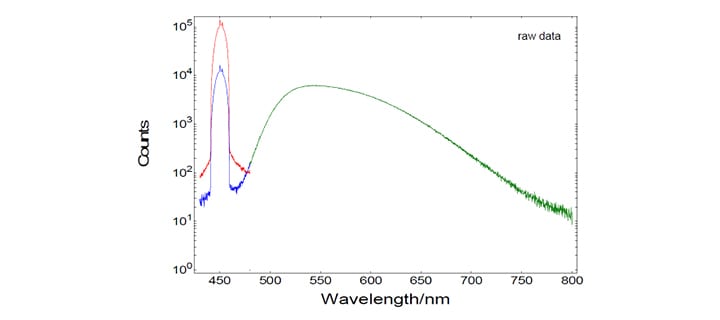
These emission scans were made with a wide spectral band width for excitation (10 nm) and a rather narrow spectral bandwidth in the emission (0.2 nm). This has two reasons: 1.) The scattered light spikes need to be “over-sampled”, i.e measurements require a large number of closely spaced data points, so that the areas of the comparatively narrow spikes can be correctly calculated. 2.) The narrow emission band width is a means to control the level of signal intensity in order to avoid detector saturation.
While it is somewhat unusual to view spectral data on a logarithmic scale, there is some virtue of this for quantum yield determinations. This way the user can make a better assessment of the typically low amplitude emission spectrum and the effect of the background level.
Spectral correction (emission arm) is then applied to the raw data after background subtraction, and from these spectrally corrected curves the quantum yield is calculated using aF900 software wizard.
It should be noted that this absolute method for calculating the emission quantum yield has an estimated error of ±5%, assuming no systematic error occurs. The repeatability has an error of ±3%. Potential sources of systematic errors are count rate saturation and incorrectness of the data file that is used for the spectral correction of the raw data.
An integrating sphere for the measurements of liquid samples is also available from Edinburgh Instruments (part number 1-M-2). Please refer to the relevant technical literature.
Instruments for Quantum Yield Measurements
Edinburgh Instruments offers a demountable integrating sphere for quantum yield and reflection measurements of solutions or solid samples. The integrating sphere fits directly into the sample chamber and is supplied with a cuvette holder and a mount for powder samples. If you have any questions then why not contact a member of our sales team at sales@edinst.com.
Download the Technical Note on Quantum Yield Measurements
Reflection, Absorption, Quantum Yield Measurements of Powder Samples Using the Integrating Sphere
Stay in Touch
If you have enjoyed reading our Technical Note on Quantum Yield Measurements and want to be the first to see all the latest news and product information from Edinburgh Instruments, then sign-up to our infrequent newsletter via the red sign-up button below, and follow us on social media.