


Angle-Resolved Polarised Raman Microscopy for Determining the Orientation of Carbon Nanotubes
Determining the orientation of carbon nanotubes can expose important structural information about the material that can help to explain its properties and potential applications. One technique used to investigate this is angle-resolved polarised Raman microscopy
Key Points
- Carbon nanotube architectures are of interest in a number of technologies because of their interesting properties.
- Raman spectroscopy can analyse various properties of carbon nanotubes, including strain, tube diameter, and defects.
- Angle-resolved polarised Raman microscopy can be used to determine the orientational axis and relative alignment of carbon nanotube architectures.
Introduction
Carbon nanotubes (CNTs) are cylindrical structures of single or multiple graphene layers with unique and interesting thermal, mechanical, electronic, and optical properties.1 Most of the products containing CNTs currently consist of bulk powders where the CNTs are unorganised. Some examples of such products include battery electrodes, automotive parts, bicycle frames, and water filters. Also of increasing interest are organised CNT architectures, such as vertically aligned forests and horizontally aligned sheets, which have the potential to allow for the upscaling of the highly desirable properties of individual CNTs. For this reason, aligned CNT architectures could prove to be extremely useful in multiple settings, including in microelectronics and photovoltaics.
During the fabrication of CNT architectures, photoluminescence and Raman characterisation are advantageous because they can reveal a wealth of information, including chirality, structural defects, and the degree and orientation of alignment. This Application Note will demonstrate how the alignment of CNT architectures can be probed using angle-resolved polarised Raman microscopy with the Edinburgh Instruments RM5.
Materials and Methods
Horizontal CNT sheets were fabricated on a 4-inch silicon (Si) wafer. Raman measurements were performed on an RM5 equipped with a vertically polarised 532 nm laser, an 1800 gr/mm grating, and changeable vertical and horizontal analysers in the scatter path, Figure 1. The wafer was placed on a rotational stage, fixed to the main X, Y, Z-mapping stage, allowing the wafer to be rotated in 360° for angle-resolved polarised Raman microscopy.
Figure 1: Edinburgh Instruments RM5 Raman Microscope.
Raman Spectrum of Carbon Nanotubes
The characteristic Raman spectrum of CNTs allows for their identification in a sample, and specific unique features allow for discrimination from alternative carbon allotropes such as graphene, Figure 2.2
The most prominent feature in the Raman spectrum is the G band, which is centred at ca. 1580 cm-1 and is characteristic of the in-plane stretching of C-C bonds. Uniquely, the G band in CNTs is split into two separate bands, which in Figure 2 are found at 1572 cm-1 and 1592 cm-1 and are denoted G+ and G–. This phenomenon occurs because of strain induced by the curvature of the material, which causes splitting in the vibrational energies of the modes orthogonal to and in the tubular axis.2 This differs from the G band of pristine graphene, which consists of a single peak.
The other unique feature in the carbon nanotube Raman spectrum is the radial breathing mode (RBM), assigned to an out-of-plane stretching vibration in which all carbon atoms in the cylindrical structure oscillate coherently in the radial direction.3 The frequency of this mode is inversely proportional to the diameter of the CNTs, and it can vary between 100 cm-1 and 500 cm-1. In the sample analysed in Figure 2, the RBM can be found at 173 cm-1. The other two bands highlighted from the CNTs are the D and G’ (often denoted 2D) bands at 1344 cm-1 and 2670 cm-1, which provide valuable information about the structural characteristics and disorder in the CNTs. These bands are also found in the spectrum of graphene and are explained in detail in our Application Note.
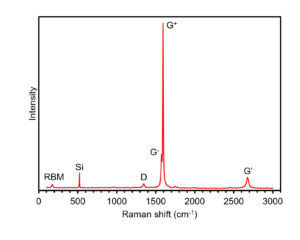
Figure 2: Raman spectrum of CNTs.
Angle-Resolved Polarised Raman Microscopy of Carbon Nanotubes
Whilst conventional Raman spectroscopy can be used to characterise various structural properties of CNTs, the determination of the orientation of aligned CNT architectures requires angle-resolved polarisation of incident and analysed light.4 This is because the Raman scattering cross-section of a CNT is highly anisotropic, meaning that the Raman scattering exhibited is enhanced significantly when the incident and analysed polarisations are aligned across the tubular axis and suppressed when the polarisations are orthogonal to the tubular axis. It follows that if CNTs are highly ordered and aligned, then the polarisation angles at which the Raman scattering is enhanced will correspond to the axis of their orientation.
Angle-resolved polarised Raman microscopy can be performed using several different configurations. One of these involves fixing the excitation and analysed polarisation within the microscope and rotating the sample around the Z axis by an angle denoted ϴ, Figure 3. In Raman microscopy, the X and Y-planes on the sample correspond to horizontal and vertical polarisation orientations, respectively. Here, the vertical polarisation of the internal 532 nm laser was exploited, and the analyser in the RM5 was set to detect vertically polarised Raman scattering. The CNT sample was placed on the rotational mount and iteratively turned by 10°, with a polarised Raman spectrum recorded from the same point on the sample at each step between 0° and 360°.
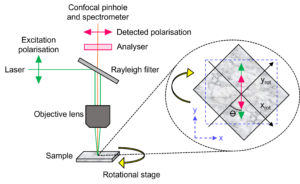
Figure 3: Experimental setup for angle-resolved polarised Raman microscopy. The orientation reference frames prior to and after sample rotation are shown in blue and black, respectively.
The Raman intensity of the G+ band at 1592 cm-1 at each angle was plotted in polar coordinates to reveal the orientation of the CNTs, Figure 4A. The blue squares represent the recorded intensities, and the red line is a Fourier curve used to fit the data. The bipolar nature of the fit indicates that the CNTs are aligned along a single axis, and the two poles of the fit at ca. 105° and 285° relative to the vertical polarisation plane indicate the direction in which the aligned tubular axes of the CNTs are oriented. The angle-resolved polarised Raman data was corroborated using atomic force microscopy (AFM), Figure 4B, in which it can be seen that the CNTs are aligned along the same axis.
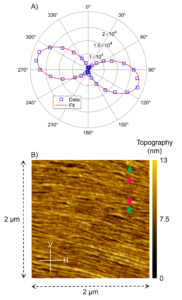
Figure 4: A) Polar plot of the CNT G+ Raman intensity at 1592 cm-1 and B) AFM image of CNTs.
Conclusion
In this Application Note, it was demonstrated that Raman spectroscopy can examine multiple properties of carbon nanotubes, such as strain, tube diameter, defects, and orientation. The Edinburgh
The RM5, equipped with polarisation optics and a rotational stage, can be used to perform angle-resolved polarised Raman microscopy for determining the relative alignment and orientation of carbon nanotubes in a sheet structure.
References
- M. F. L. De Volder et al., Carbon Nanotubes: Present and Future Commercial Applications, Science, 2013, 339, 535-539.
- A. Jorio et al., Raman spectroscopy for carbon nanotube applications, J. Appl. Phys., 2021, 129, 021102.
- M. S. Dresselhaus et al., Raman spectroscopy of carbon nanotubes, Phys. Rep., 2005, 409, 47-99.
- X. Yang et al., Polarized Raman Study of Aligned Multiwalled Carbon Nanotubes under High Pressure, J. Phys. Chem. C, 2015, 119, 27759-27767.
