


Raman Spectroscopy for Artwork and Archaeology
Key Points
- Chemical analysis of artwork and archaeology is crucial for restoration, forgery detection, and understanding human development.
- Such techniques need to be sensitive, specific, non-destructive, and have a high spatial resolution, all of which are traits of Raman spectroscopy.
- In this Application Note, pigment analysis using Raman spectroscopy is used to gain historical information about the techniques used in the creation of a cave painting, a glass bead from a Venetian shipwreck, and a religious sculpture.
Introduction
Cultural heritage materials, such as paintings, books, documents, buildings, pottery, and monuments, are precious to society because they provide us with a snapshot of the practices and beliefs held by civilisations throughout different historical periods, which helps us understand better and map human development.
Humanity’s high value on cultural heritage is a crucial driver of global tourism, reflected by the fact that in 2022, the international art and antiques market generated $67.8 billion. To support this large market, the forensic study of cultural heritage materials allows for their authenticity to be determined and provides information about what techniques or materials were used in their creation. With historical context, this yields evidence about the period in which the materials were created and who could have made them. Forensic studies also enable the detection of forgery, which erodes trust in the preservation of heritage, can have severe socioeconomic consequences for the involved parties, and is a serious crime.
Raman spectroscopy is an established method for the molecular investigation of cultural heritage materials because it is non-destructive when used correctly, has exceptionally high molecular specificity and sensitivity, requires minimal sample preparation, and provides micron-range spatial resolution when coupled with confocal microscopy.1 In this Application Note, how the RM5 Confocal Raman Microscope is used in the identification of different materials in cultural heritage artefacts.
Materials and Methods
Raman spectroscopic measurements were performed on an Edinburgh Instruments RM5 Raman Microscope, Figure 1, equipped with 532 nm, 638 nm, and 785 nm lasers, a back-illuminated CCD detector, and a variable diameter confocal pinhole. These components can all be fully controlled using the Ramacle® software of the RM5 without disturbing the sample between measurements.
Figure 1: Edinburgh Instruments RM5 Raman Microscope.
Rock Painting
The first artefact analysed was a multi-pigment flake extracted from a rock painting. Rock and cave paintings offer a window into the technological practices, societal structures, mythologies, and cognitive abilities of early human civilisations and, therefore, are of great interest to archaeologists and historians. When viewed under the microscope in brightfield mode, Figure 2a, the sample was seen to contain red, orange, white, and black pigments. The area of interest on the sample was analysed using a 785 nm laser, and the resulting spectra are shown in Figure 2b.
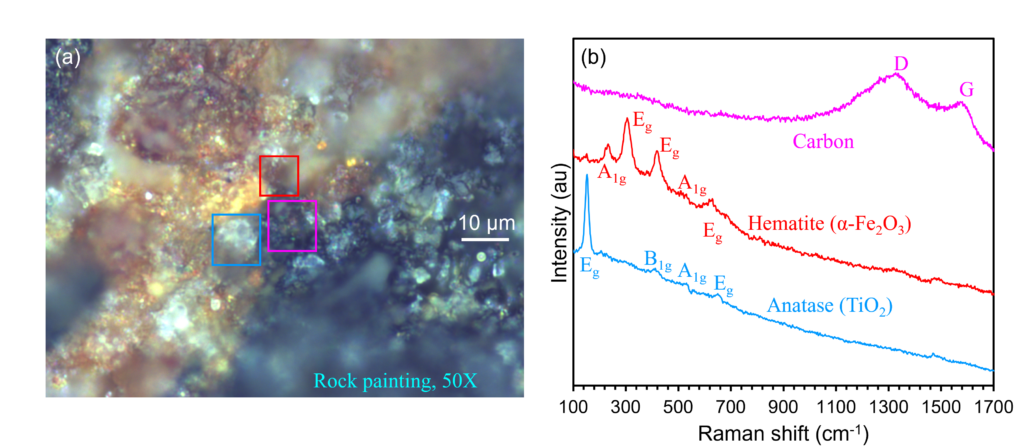
Figure 2: (a) Widefield image and (b) Raman analysis of a rock painting sample.
Unique spectral signatures were obtained from the bordered regions on the rock painting. The pigment framed in pink contained a carbon-based colouring material, most likely prepared by charring wood and other plant-based matter. This assignment was made because of the presence of broad D and G bands ca. 1326 cm-1 and 1581 cm-1, respectively, which are also typical of carbonaceous materials such as graphene and graphite.2 The prominence of the D band, associated with crystalline disorder, in the spectrum is suggestive of the carbon’s amorphous structure.
The spectrum of the pigment bordered in red, which contained intense bands at 233 cm-1, 305 cm-1, and 419 cm-1, was assigned as hematite. This naturally occurring and abundant mineral contains alpha-phase iron oxide (Fe2O3) found in rocks and soil.3
The material bordered in blue was assigned as anatase, one of the five naturally occurring mineral forms of titanium dioxide (TiO2) found in veins and cavities of igneous rocks.4 This was determined because the spectrum exhibited highly characteristic crystal lattice modes at 148 cm-1, 401 cm-1, 520 cm-1, and 644 cm-1. The orange pigment, not bordered in the painting, contained signatures from anatase and hematite.
Glass from Shipwreck
A glass bead was procured from the cargo of a merchant ship that sank in the Adriatic Sea in the 16th century. An artefact such as a glass bead is valuable to historians because it provides information about European manufacturing at the end of the Renaissance period, and the flow of such goods from Europe to international markets can be tracked. A cross-section of the glass bead was embedded within a block of epoxy resin with an exposed flat face, and this was examined using Raman spectroscopy, Figure 3.
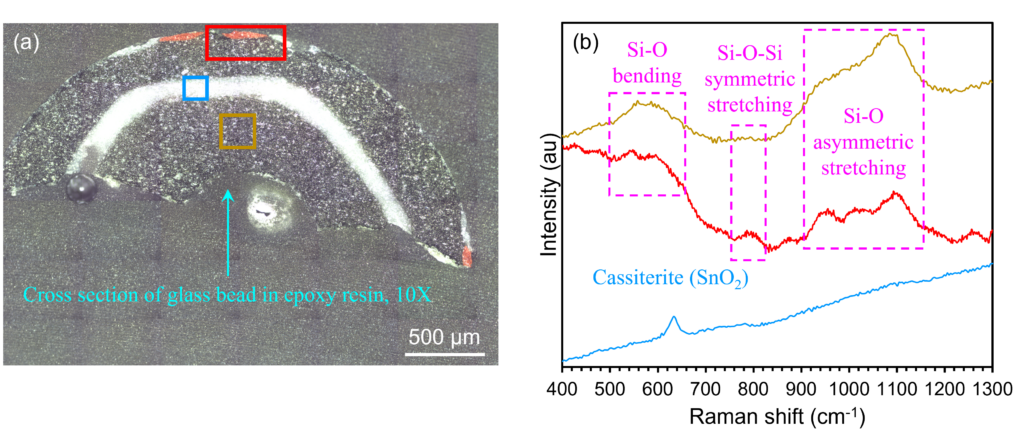
Figure 3: (a) Widefield image and (b) Raman analysis of glass bead.
The widefield image in Figure 3a shows that the bead is primarily made of green glass (a section of which is framed in gold), there are orange inclusions around the edges of the bead (framed in red), and it contains an internal curved strip of white glass (framed in blue). Raman spectra from each of these regions are shown in Figure 2b. The spectra from the red and gold-framed areas, which required excitation with 532 nm and 785 nm lasers, respectively, exhibit subtly different broad Raman bands characteristic of silicon-oxygen bond vibrations in soda lime silicate glass.
The spectrum of glass can be split into three regions: the low-frequency region, referred to as the bending massif ca. 500 cm-1; the medium-frequency region, ca. 800 cm-1; and the high-frequency region, ca. 1100 cm-1, which is called the stretching massif.5,6 These bands are information-rich. For example, the amount of silicon and the processing temperature of glass can be determined from the ratio of the area under the bending and stretching curves. Further, the relative intensities of each of the peaks that make up the stretching massif can be used to detect doping in the glass or to identify different types of bonds and, therefore, glass subtypes throughout the same sample.
In the area bordered in blue, a spectrum was obtained with a broad peak ca. 640 cm-1. This was assigned as an inclusion consisting of cassiterite (SnO2). Cassiterite imparts opacity to glass, enamels, and ceramics, giving the materials a cloudy white colour.6,7
Statues and Sculptures
Material from the face and hand of a figure depicting Saint Anthony of Padua, the patron saint of lost articles, were obtained and analysed to determine the pigments used by the sculptor. Religious icons, works of art used to represent sacred symbols and personages, are common in Roman Catholic and Eastern Orthodox Churches. Statues and paintings of icons are found regularly in churches and cathedrals as a form of prayer. The spectroscopic study of religious icons is of significant interest to historians because it can be used to date the work, provides them with a better understanding of the evolution of painting techniques and can reveal later artistic modifications, all of which are helpful for restoration purposes.9 The Raman analysis of the materials in the icon is shown in Figure 4.
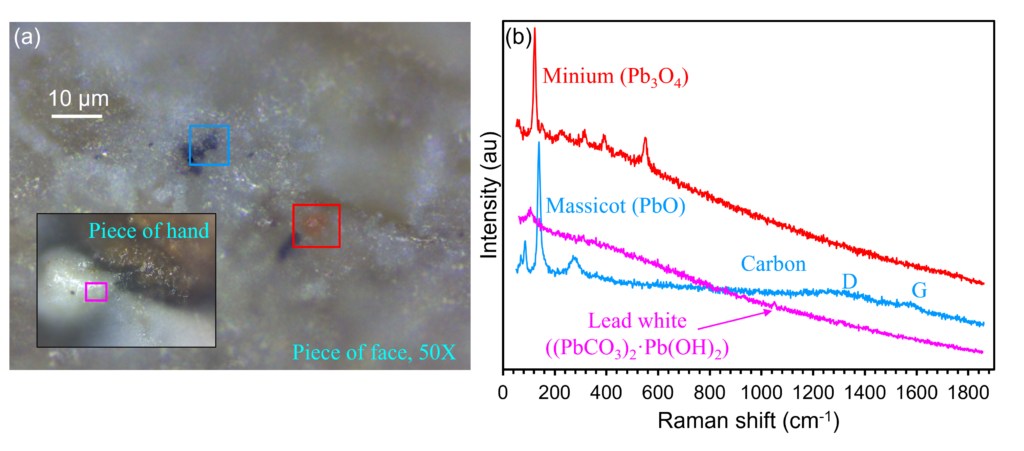
Figure 4: (a) Widefield image and (b) Raman analysis of pieces from the religious icon.
Various lead-based pigments were detected, and their location and corresponding spectra are shown in Figure 4. Lead-based paints were historically very popular because of their bright appearance, durability, and resistance to corrosion, but their associated toxicity has led to diminished use. The orange pigment on the material taken from the face of the icon, bordered in red, was identified as minium, which is also known as red lead (Pb3O4). The spectrum of the pigment exhibited highly characteristic bands at 120 cm-1 and 549 cm-1.10 The use of red lead can be traced back to at least the Middle Ages, where it was often preferred to the similarly coloured pigment vermillion, made from powdered mineral cinnabar (HgS), because it was easier to prepare and less expensive.
The darker pigment from the face of the icon, bordered in blue, produced a Raman spectrum that indicated a mixture of two different materials. The D and G bands of carbon black were detected, as were Raman signatures of the yellow pigment massicot (PbO) at 142 cm-1 and 285 cm-1, another lead-based pigment that can be tracked back to antiquity.11
The white painted region on the material taken from the hand of the figure exhibited a small but consistently observed peak at 1050 cm-1, which was assigned to the pigment lead white ((PbCO3)2·Pb(OH)2).12 It is one of the most common white pigments in paintings and murals, and it was even used historically as a cosmetic. The first recordings of the synthesis of the pigment can be dated back to the 4th Century BCE.13
Conclusion
In this Application Note, an Edinburgh Instruments RM5 Confocal Raman Microscope was used to analyse and identify materials in different cultural heritage samples. Raman microscopy is an excellent technique for the molecular investigation of cultural heritage materials because it is non-destructive, highly specific, sensitive, requires minimal sample preparation, can analyse very small samples, and provides micron-range spatial resolution.
References
- F. Casadio et al., Raman Spectroscopy of cultural heritage Materials: Overview of Applications and New Frontiers in Instrumentation, Sampling Modalities, and Data Processing, Top. Curr. Chem., 2016, 374, 62, DOI: 10.1007/978-3-319-52804-5_5.
- A. Coccato et al., Raman spectroscopy for the investigation of carbon-black based pigments, J. Raman Spectrosc., 2015, 46, 1003-1015, DOI: 10.1002/jrs.4715.
- Y. Liu et al., Identifying protons trapped in hematite photoanodes through structure-property analysis, Chem. Sci., 2020, 11, 1085, DOI: 10.1039/C9SC04853G.
- S. Challagulla et al., Structure sensitive photocatalytic reduction of nitroarenes over TiO2, Sci. Rep., 2017, 7, DOI: 10.1038/s41598-017-08599-2.
- M. Wang et al., Raman spectra of soda-lime-silicate glass doped with rare earth, Phys. B: Condens., 2011, 406, 3865-3869, DOI: 10.1016/j.physb.2011.07.014.
- A. Bonneau et al., Archaeometrical Analysis of Glass Beads: Potential, Limitations, and Results, BEADS: Journal of the Society of Bead Researchers, 2-14, 26, 35-46, Available at https://surface.syr.edu/beads/vol26/iss1/7.
- J. E. Post et al., Raman spectroscopy study of manganese oxides: Tunnel structures, Am. Mineral., 2020, 105, 1175-1190, DOI: 10.2138/am-2020-7390.
- N. Mironova-Ulmane et al., Synthesis and Vibration Spectroscopy of Nano-Sized Manganese Oxides, Acta Phys. Pol., 2018, 1013-1016, DOI: 10.12693/APhysPolA.133.1013.
- S. Daniilia et al., An extensive non-destructive and micro-spectroscopic study of two post-Byzantine overpainted icons of the 16th century, J. Raman Spectrosc., 2002, 33, 807-814, DOI: 10.1002/jrs.907.
- L. Burgio et al., Raman spectroscopy as a means for the identification of plattnerite (PbO2), of lead pigments and of their degradation products, Analyst, 2001, 126, 222-227, DOI: 10.1039/b008302j.
- I. Constantini et al., Use of Temperature Controlled Stage Confocal Raman Microscopy to Study Phase Transition of Lead Dioxide (Plattnerite), Minerals, 2020, 10, 468, DOI: 10.3390/min10050468.
- M. Kostadinovska et al., A spectroscopic study of inks from a rare Old Slavic manuscript: Liturgical Collection of chronicles, scriptures, in 2nd Virtual International Conference on Advanced Research in Scientific Areas, 2013, DOI: 10.1016/j.vibspec.2018.07.006.
- B. Han et al., Beauty and chemistry: the independent origins of synthetic lead white in east and west Eurasia, Humanit. Soc. Sci. Commun., 2022, 9, 1-12, DOI: 10.1057/s41599-022-01290-6.
