


Tuning the Photoluminescence of Graphene Oxide
In this application note, the photoluminescence properties of graphene oxide are investigated using an FLS1000 Photoluminescence Spectrometer equipped with double excitation and emission monochromators and an infrared PMT.
Graphene has received tremendous attention within both the scientific community and industry due to its remarkable electrical, thermal and mechanical properties. Graphene is predicted to be a disruptive technology with numerous potential applications, which range from flexible electronics to the filtration of water. The importance of the material was recognised with the award of the 2010 Nobel Prize in Physics for “groundbreaking experiments regarding the two-dimensional material graphene”.1
Graphene possesses an unusual electronic band structure with the valence and conduction bands forming conical surfaces in momentum space and touching at Dirac Points (Figure 1). The touching of the valence and conduction bands means that graphene possesses no band gap and is known as a zero bandgap semiconductor. A consequence of this lack of a bandgap is that pure graphene is rather uninteresting in terms of photoluminescence (PL) spectroscopy, as materials with zero bandgap do not exhibit PL. However, by oxidising graphene to form graphene oxide the π‑electron network of the carbon atoms in graphene is disrupted which results in the formation of a gap between the valence and conduction bands and the material therefore becomes photoluminescent, which opens the door to further applications.
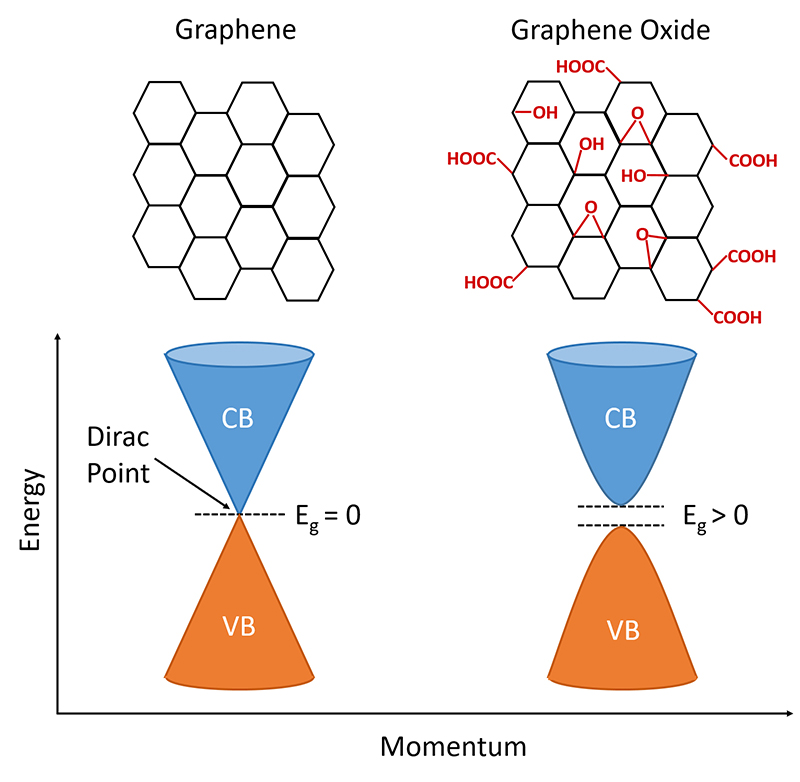
Figure 1: Simplified chemical and band structures of graphene and graphene oxide. VB = valence band, CB = conduction band. Adapted from Sehrawat et al.2
Since the PL of graphene oxide is linked to the degree of oxidation of the graphene lattice, the PL properties can be tuned by altering the extent of this oxidation. In this application note, the PL properties of graphene oxide and how they can be tuned using photothermal reduction are investigated using the FLS1000 Photoluminescence Spectrometer.
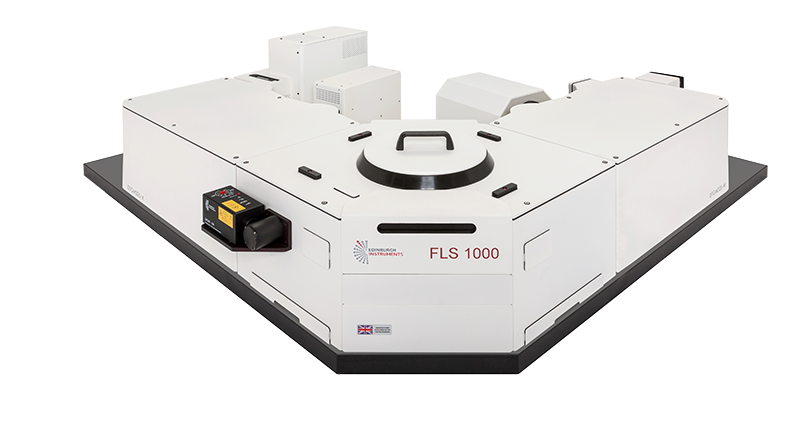
Figure 2: FLS1000 Photoluminescence Spectrometer with double excitation and emission monochromators for the measurement of highly scattering samples.
Experimental
An aqueous dispersion of graphene oxide was purchased from PlasmaChem GmbH and was diluted to a concentration of 0.02 mg cm-3 using deionised water. At this concentration the absorbance of the graphene oxide dispersion is 0.15 at 350 nm (start of the PL emission) and distortion of the PL spectra due to the inner filter effect is therefore avoided. The PL of the graphene oxide was measured using the FLS1000 Photoluminescence Spectrometer equipped with double excitation and emission monochromators and PMT-900 and PMT‑1700 photomultiplier tube detectors. The graphene oxide dispersion was loaded into a 10 mm pathlength quartz cuvette and held using the cuvette sample holder. The dispersion was continuously stirred during measurements using the inbuilt magnetic stirrer to prevent the graphene oxide from falling out of suspension. Photothermal reduction of the graphene oxide dispersion was carried out by placing the cuvette at the focal point of a 450 W xenon lamp.
Results & Discussion
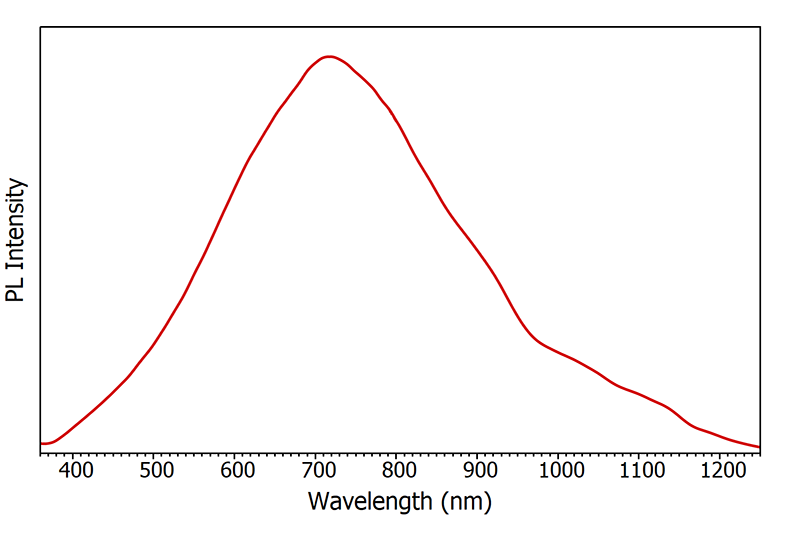
Figure 3: PL spectrum of a dilute graphene oxide dispersion in water. The spectrum was recorded using two detectors with a crossover point at 800 nm. Visible Emission (PMT-900) Parameters: λex = 300 nm, Δλex = 5 nm, Δλem = 5 nm. NIR Emission (PMT 1700) Parameters: λex = 300 nm, Δλex = 10 nm, Δλem = 20 nm.
The PL of graphene oxide was found to be extremely broad, extending from 350 nm to 1250 nm. To measure this broad range of emission wavelengths two photomultiplier tube detectors were used that are optimised for different wavelength ranges. The visible part of the spectrum was measured using the standard PMT-900 detector of the FLS1000 which is sensitive up to 900 nm while the NIR region was measured using the PMT-1700 which is sensitive out to 1700 nm. The PL was measured using both detectors and the spectra combined at 800 nm, which is the crossover point of the detector quantum efficiencies, to give the complete spectrum in Figure 3. An FLS1000 can hold up to five different detectors simultaneously and the detectors can be switched between solely using the Fluoracle® software of the FLS1000 with no hardware changes required.
One of the most interesting photoluminescent properties of graphene oxide is that the emission wavelength is determined by the degree of oxidation of the graphene. A simple way of controlling the degree of oxidation is using photothermal reduction, where the aqueous graphene oxide dispersion is exposed to heat and light which initiates deoxygenation reactions. To investigate the effect that the degree of oxidation has on the PL, the graphene oxide dispersion was photothermally reduced using a focussed xenon lamp. The PL spectra measured after different exposure times are shown in Figure 4.
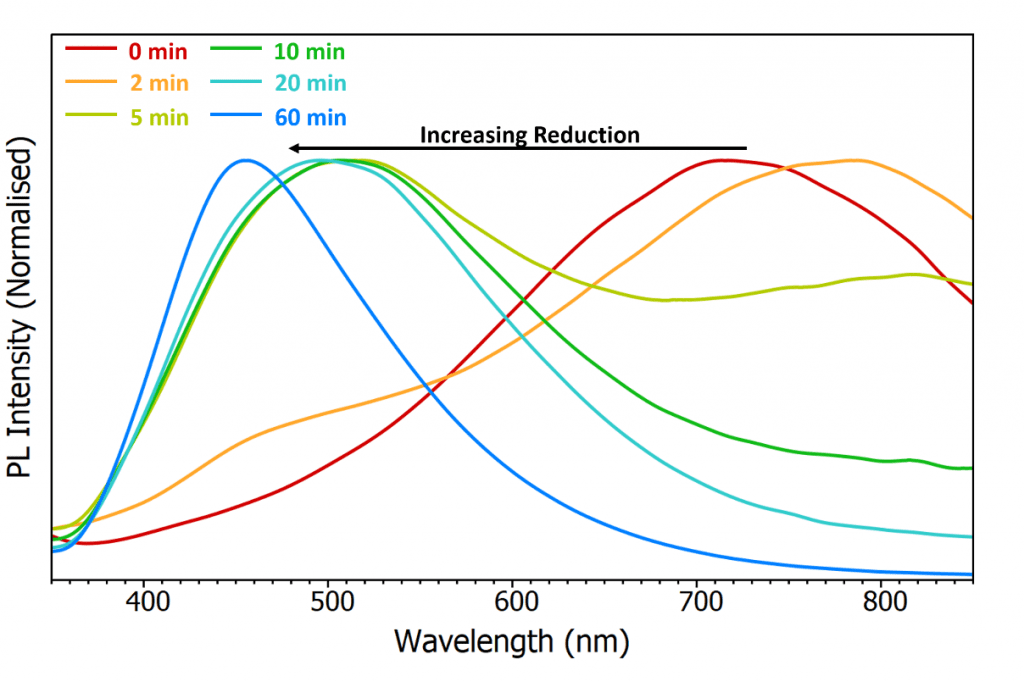
Figure 4: Change in the PL spectra of graphene oxide with increasing photothermal reduction. λex = 300 nm, Δλex = 5 nm, Δλem = 5 nm.
It can be seen that as the exposure time is increased (increasing reduction) the PL blue shifts with a maximum at 450 nm after 60 minutes reduction. The shoulder feature at 450 nm in the 2 minute spectrum provides the clearest picture that this blue shift is not simply due to the main peak shifting with exposure time. Instead, the shift arises from the relative intensity of the PL peak centred on 450 nm increasing with exposure time. This suggests that the 450 nm peak and the 710 nm correspond to two chemically distinct species with the 710 nm species being converted to the 450 nm species during photothermal reduction.
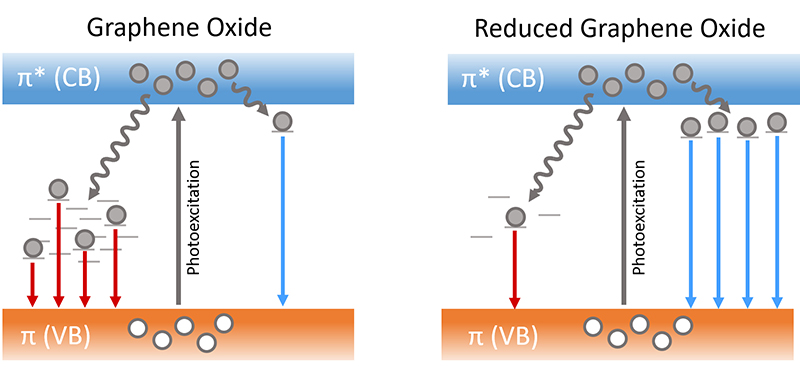
Figure 5: Origin of the PL shift when graphene oxide is reduced. The 710 nm PL (red) is from recombination within disorder induced defect states while the 450 nm PL (blue) arises from recombination within confined cluster states. Adapted from Chien et al.3
Based on this information and previous PL, XPS and AFM spectroscopic studies,2,3 the origin of these two PL peaks can be assigned. In the molecular picture of a pure graphene cluster the carbons are all sp2 hybridised and the overlap of the p-orbitals of the sp2 carbons form a π bonding orbital and a π* antibonding orbital which are analogous to the valence and conduction bands. In graphene oxide there are a finite number of carbons in each cluster that have been oxidised to sp3 and these sp3 carbons distort the structure of the graphene and introduce disorder induced defect states. These disorder induced states have a lower energy than the π-π* gap and a broad distribution in energy and are responsible for the broad PL peak centred on 710 nm (Figure 5 left). When the graphene is reduced, the number of oxidised sp3 carbons is decreased and the number of disorder induced defect states therefore also decreases. The reduction forms new clusters of pure sp2 carbon and these confined cluster states have a higher energy than the disorder states and are responsible for the PL at 450 nm (Figure 5 right).
Conclusion
The PL of a low quantum yield and highly scattering graphene oxide dispersion was investigated using the FLS1000 Photoluminescence Spectrometer equipped with double excitation and emission monochromators and an infrared detector. The PL of graphene oxide was found to be broad, extending from 350 nm to 1250 nm with a maximum at 710 nm and arises from radiative recombination within low lying disorder induced defect states. By photothermally reducing the graphene oxide, the PL maximum was tuned from 710 nm to 450 nm through decreasing lattice disorder and the formation of confined cluster states which lie higher in energy.
References
1. Press release. NobelPrize.org. Nobel Media AB 2018. Mon. 10 Dec 2018. https://www.nobelprize.org/prizes/physics/2010/press-release
