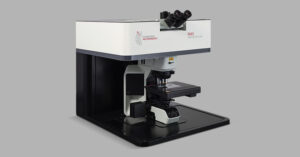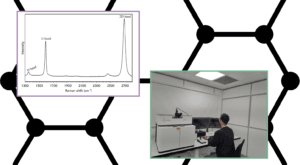
Raman spectroscopy is one of the most powerful tools for graphene characterisation, but a single spectrum only tells part of the story. In this video, we demonstrate how the Edinburgh Instruments RM5 Confocal Raman Microscope can rapidly generate Raman maps that reveal spatial variations in graphene structure and quality across an entire sample.
From Spectra to Images
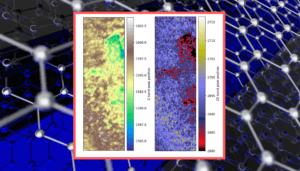
Rather than analysing a single measurement point, Raman mapping collects spectra across a defined area of the sample to build a spatial picture of material properties. Using the RM5, high-resolution maps can be acquired in just a few minutes, transforming Raman data into intuitive visual representations of graphene structure.
Understanding Graphene Layer Number
One of the most widely used Raman metrics for graphene is the ratio between the 2D and G bands. Mapping this ratio across the sample allows regions of monolayer, bilayer and multilayer graphene to be quickly distinguished, providing an immediate assessment of sample uniformity.
Revealing Defects and Strain
Raman mapping also highlights local variations in material quality. By monitoring D-band intensity, researchers can locate regions with increased defect density, while shifts in Raman peak position provide insight into strain and mechanical effects within the graphene lattice.
Together, these measurements provide a fast, non-destructive way to evaluate graphene quality and understand how material properties vary across the sample.
Watch the Full Demonstration
In the video, we walk through the complete workflow, from defining the mapping area and collecting data to analysing layer number, defect density and strain using Raman maps generated on the RM5.