Send us your samples, and we can measure them live in an online demonstration
Contact us to arrange an online demonstration
"*" indicates required fields
Ramacle is an exceptional software package written for complete instrument control and data handling on Raman systems. Ramacle controls all Raman microscope functions with a straightforward design concept. It focuses on all modern Raman spectroscopy applications, while at the same time, providing a user-friendly interface with ‘ready to publish’ outputs.
Ramacle simplifies the user journey from initially bringing their sample into focus using the microscope setup to performing spectral measurements. In the microscope setup phase, users can effortlessly adjust parameters to achieve optimal focus. Once the sample is in focus, the spectral measurement window allows comprehensive control over the laser path, including laser selection, laser power adjustment, and polarization settings.
Moving to the scatter path, Ramacle facilitates control over crucial components such as gratings, analysers, pinhole size, slit width, and detector settings. Each of these elements can be fine-tuned to tailor the measurement setup to the specific requirements of the experiment.
When ready to proceed with the measurement, users can finalise parameters such as exposure time, the number of acquisitions, and configure kinetic scans directly within the software interface. This streamlined process ensures that users can efficiently set up and execute measurements with precision and ease, enhancing the overall user experience with our instruments.
2D Raman mapping in Ramacle allows users to visualise the distribution of components across a sample. By defining the area of interest and setting the map dimensions and step size, the software moves the stage to capture Raman spectrum at each point. This technique provides detailed spatial information about the sample’s chemical composition.
3D Raman mapping in Ramacle extends the capabilities of 2D mapping by including the Z-axis, enabling users to probe into their samples such as layered plastics or inclusions. By defining the volume of interest, the software captures Raman spectrum at multiple depths, constructing a detailed 3D chemical image.
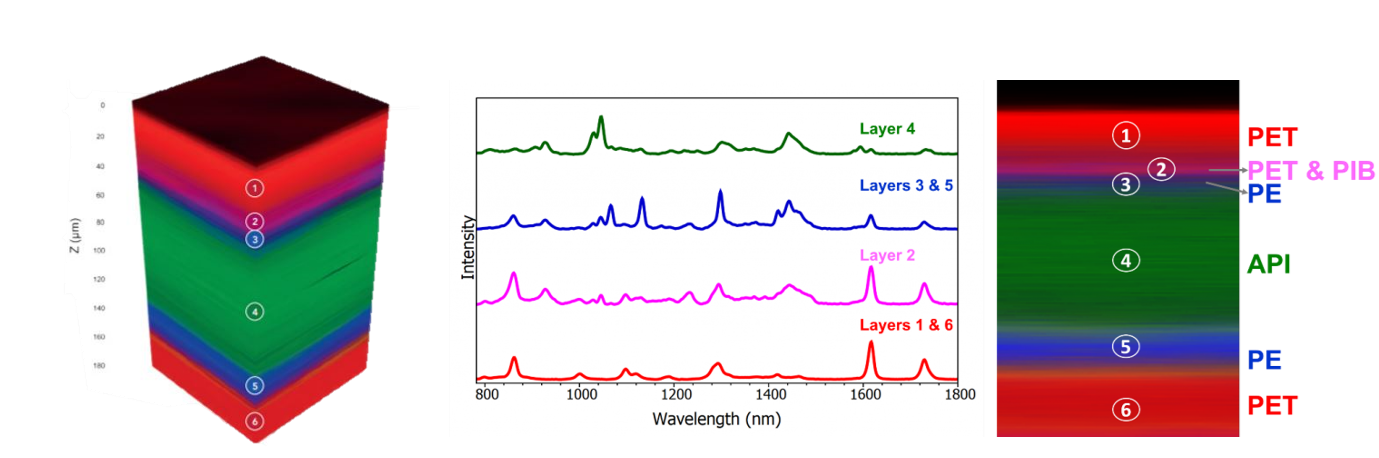
The result can focus in 2D on one particular layer, in 3D stacks, or as a complete volumetric representation to visualise distribution. Shown above a transdermal patch with several polymer layers surrounding the active ingredient.
In Raman mapping, the sample is placed on a motorised stage, and the user defines the mapping area and resolution. Standard mapping involves stopping the stage at each point to acquire the Raman spectrum, which is necessary for samples needing longer exposure times (>0.5 seconds). However, for samples with strong Raman responses using shorter exposure times (<0.5 seconds), this method can be inefficient due to the time spent on stage movement.
Ramacle’s FastMAP feature addresses this by continuously moving the stage during mapping, significantly reducing total acquisition time without compromising map quality. This is ideal for samples with strong Raman or photoluminescence responses, where shorter exposure times are sufficient. Fast Mapping utilizes a fast communication protocol between the stage and the CCD camera, enabling even shorter exposure times and further enhancing efficiency. FastMAP can be used in 2D and 3D spectral mapping.
In standard Raman mapping, the laser is focused on the sample surface and rastered across it to collect Raman scatter from each X-Y point. This process works best with perfectly flat samples, but many samples have uneven surfaces, causing the laser to fall out of focus and reducing Raman intensity and spatial resolution. For instance, a pharmaceutical tablet with a dip in the center would show significant intensity differences due to the laser being out of focus, not sample variation.
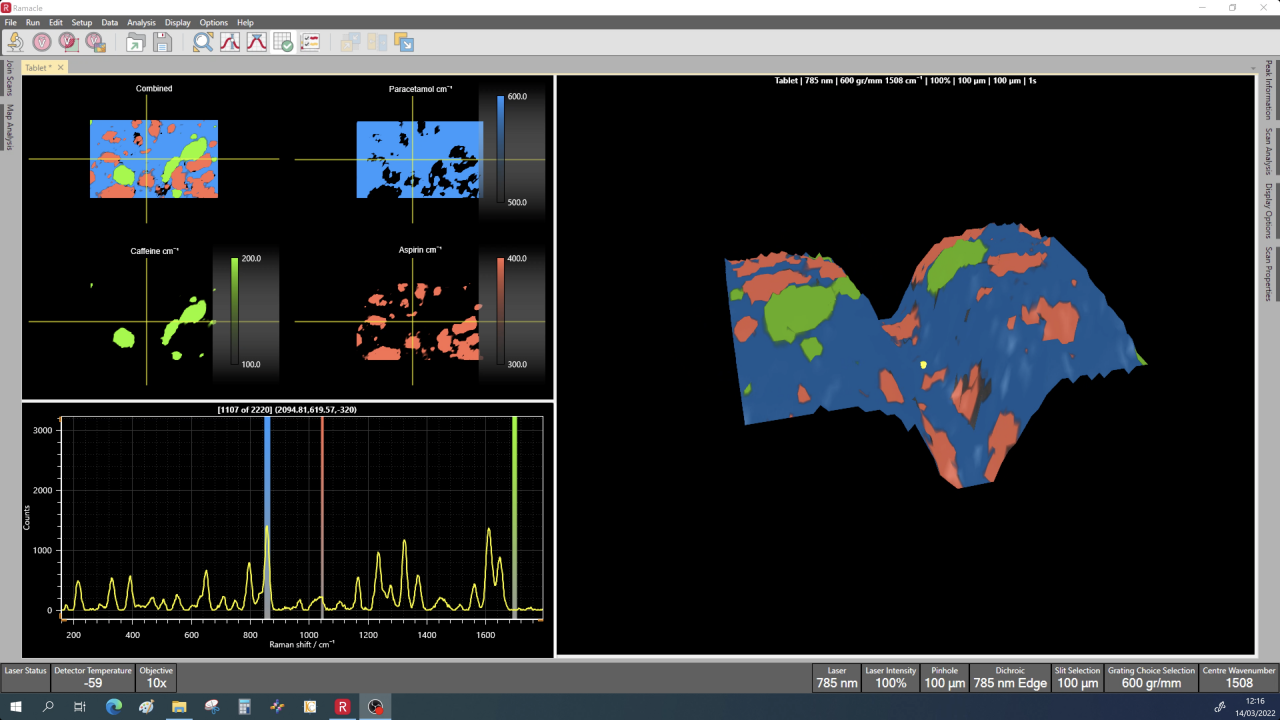
Ramacle’s Surface Mapping feature addresses this issue by ensuring the laser remains in focus across uneven surfaces. First, a series of white light images at different Z-points are taken to cover the sample’s height variation, creating an optimally focused image and a 3D topography view. Ramacle then uses these focused Z-coordinates to adjust the stage’s Z-position at each X-Y point, maintaining focus throughout the acquisition. The resulting map can be displayed in 3D, showing sample height variation and revealing the distribution of components like paracetamol, aspirin, and caffeine in a pharmaceutical tablet.
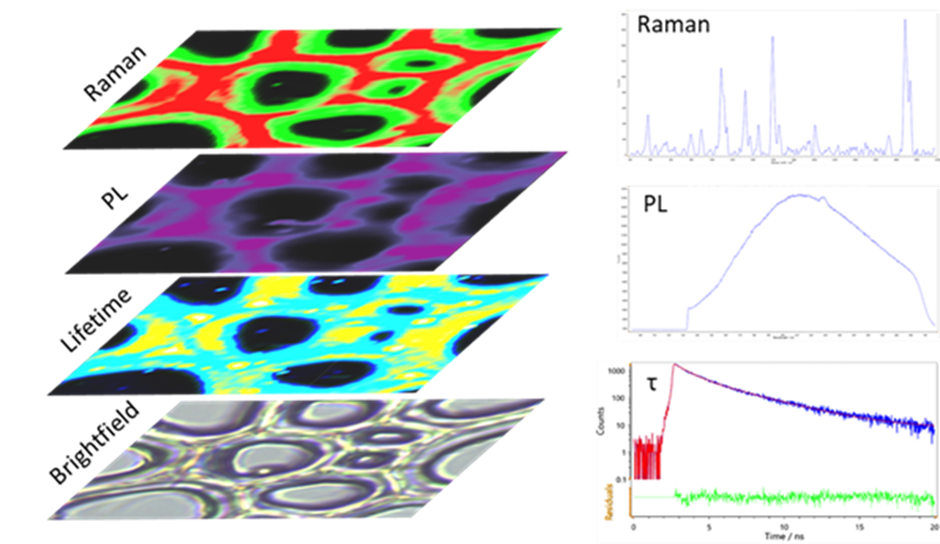
Ramacle integrates Raman and FLIM (Fluorescence Lifetime Imaging Microscopy) measurements, providing comprehensive imaging from a single platform. FLIM measurements complement Raman data by providing spatial information about the fluorescence decay times within the sample. By combining Raman and FLIM, Ramacle offers a powerful tool for multi-dimensional analysis, enabling researchers to correlate chemical composition with fluorescence dynamics, leading to a deeper understanding of complex samples. For example below on a sample of woody plant cell walls.
| Software Feature | Description |
|---|---|
| Microscope setup | User control over camera settings microscopy viewing Motorised stage user control over stage position Objectives selectable by user to provide accurate scale bar Laser viewable for alignment and focus purposes |
| Measurement setup | User control over all parameters to take a measurement: laser, laser power, grating, centre wavelength, pinhole, slit, exposure time, accumulation Live, single, and Kinect scans all managed in measurement set up |
| Data processing | Several data tools such as cropping, smoothing, background removal, manual baseline subtraction, normalisation |
| Cosmic Ray Wizard | Intuitive wizard for auto-removal of cosmic rays on single spectra and maps |
| 2D Map | Standard feature with motorised stage User can set up 2D maps in one field of view or stitch several together for larger area mapping defining measurement area and parameters. User is guided from image set up through to spectral acquisition for ease of use |
| 3D Map | Standard feature with motorised stage User can set up 3D maps in one field of view or stitch several together for larger area mapping defining measurement area and parameters. User is guided from image set up through to spectral acquisition for ease of use |
| FastMAP | Standard feature with motorised stage 2D and 3D maps can be operated in FastMAP mode if exposure times are <0.5 seconds, option displayed on 2D and 3D mapping set up windows |
| SurfMAP | Standard feature with motorised stage Using white light focusing sample remains in focus throughout measurement. |
| Map analysis | Numerous analysis tools for false colouring of map date, including peak position, intensity, ratio, match data |
| FLIM (RMS1000 only) | With FLIM upgrade user has a simple interface to set up fluorescence life time measurements, both single point and mapping are available. 2D, 3D, and SurfMAP are available with the upgrade. Data analysis of lifetimes is also accessible in Ramacle. |
| Internal auto-calibration reference | Si autocalibration feature for all lasers and gratings |