


Measuring Fluorescence and Phosphorescence Spectra at Low Temperature Using the FLS1000 Photoluminescence Spectrometer
Introduction
Fluorescence is the radiative relaxation that an excited molecule undergoes when it drops back from a singlet excited state (e.g., S1) to its electronic ground state (S0) after photoexcitation (Figure 1). A competing process is the radiationless transition from S1 to a triplet excited state (T1) through intersystem crossing (ISC). From T1, the excited molecule can return to S0 radiatively. This process is known as phosphorescence and although both transitions (S1→T1 and T1→S0) are “forbidden“ in terms of quantum mechanics principles, they still occur due to spin-orbit coupling. Measuring the spectral profile of the fluorescence and phosphorescence transitions of a molecule reveals important information on its electronic structure and enables the S1 – T1 energy splitting to be calculated.
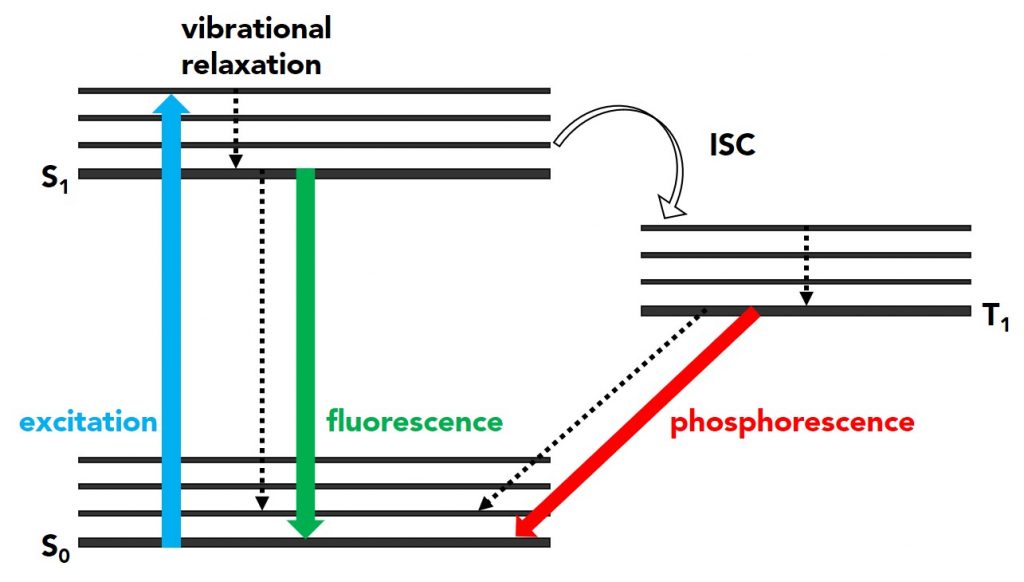 Figure 1: A Jablonski diagram for an excited molecule. The radiative (fluorescence and phosphorescence) and non-radiative (vibrational relaxation and ISC) processes are shown.
In this technical note, an Edinburgh Instruments FLS1000 Photoluminescence Spectrometer was used to acquire the fluorescence and phosphorescence spectra of a fluorescent emitter at 100 K. The note guides the reader through the recommended measurement and data analysis sequence to obtain accurate photoluminescence (PL), fluorescence and phosphorescence spectra, and a summary of the procedure that will be followed is shown in Figure 2.
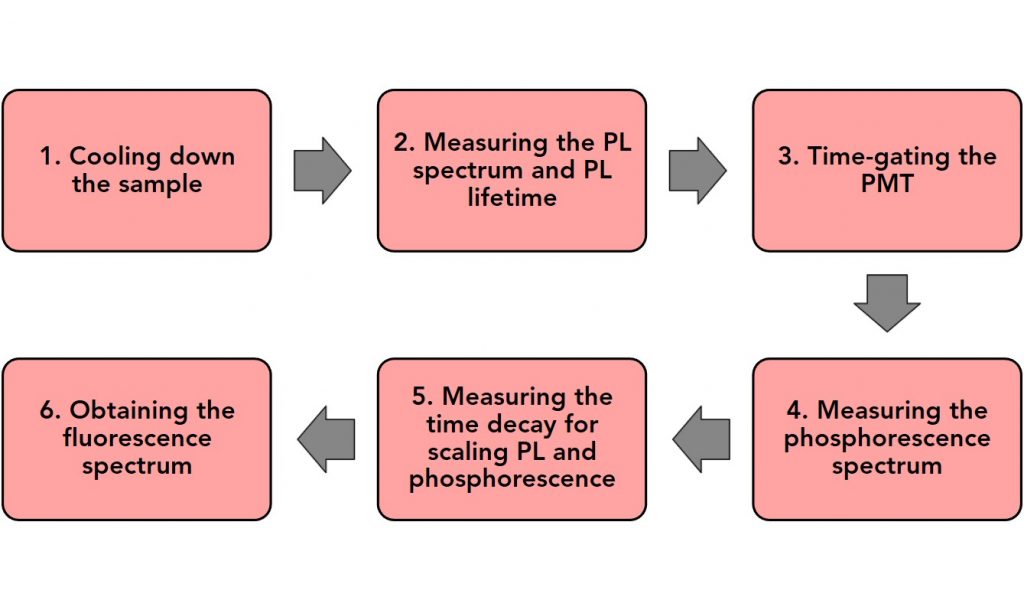 Figure 2: The steps followed for the acquisition of the fluorescence and phosphorescence spectra.
Experimental Setup
Measurements were carried out using a FLS1000 that was equipped with a 450 W continuous Xenon lamp and a VPL-375 variable pulse length laser diode, as excitation sources. The fluorescent emitter was held in an Optistat DN liquid nitrogen cryostat (Figure 3), whilst all data were acquired using a PMT-980 equipped with a N-G11 gating circuit. The analysis of the acquired spectra was performed in Fluoracle®, the FLS1000’s operating software.
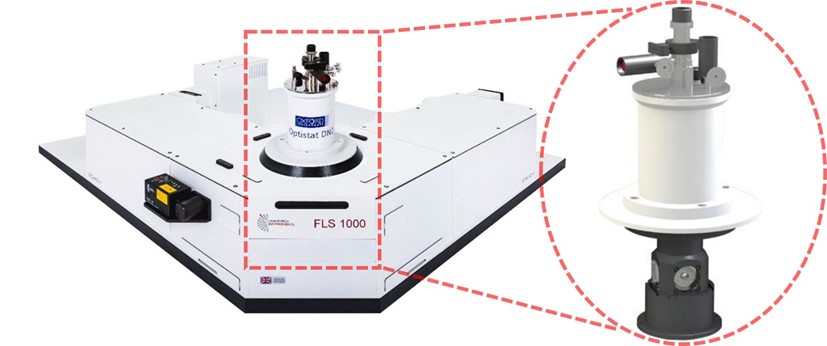 Figure 3: The FLS1000 photoluminescence spectrometer with the Optistat DN Cryostat.
Measuring the Low-Temperature Photoluminescence Spectrum
Measuring the spectra of both, fluorescence and phosphorescence, is important depending on the potential application. However, at room temperature it is challenging for phosphorescence to be measured as T1 is depopulated by non-radiative relaxation. By cooling down the sample the non-radiative relaxation rate is decreased, and therefore, the phosphorescence can be observed. The temperature of the cryostat was set to 100 K in Fluoracle® and the PL emission spectrum of the sample was acquired (Figure 4).
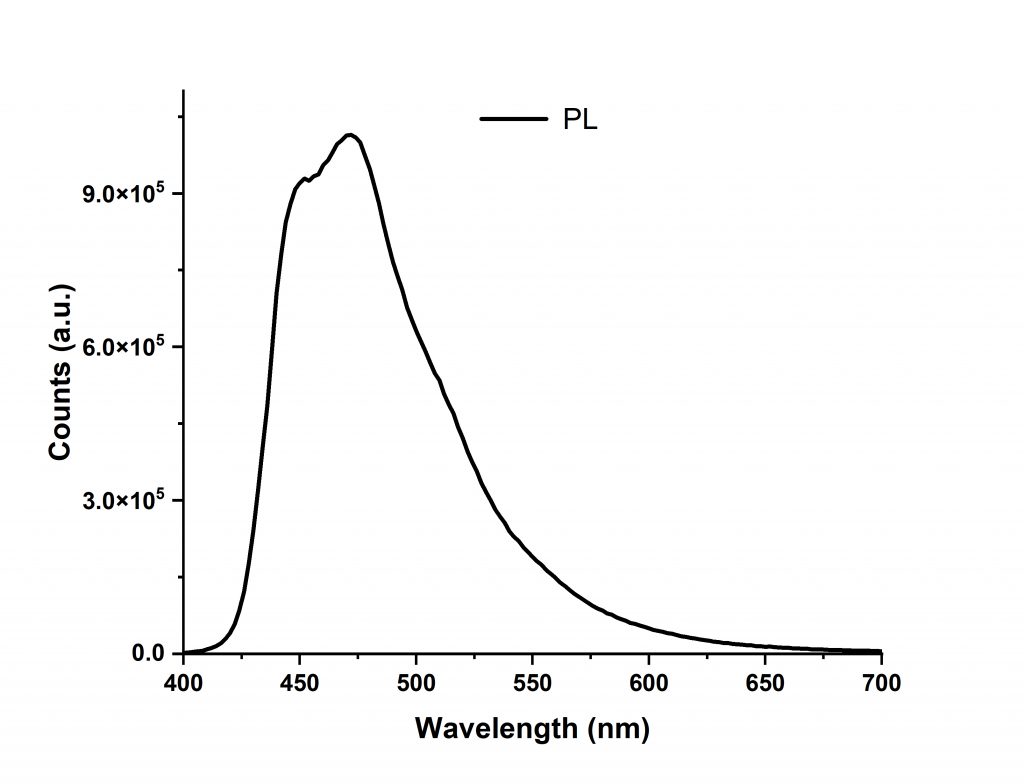 Figure 4: The PL spectrum at 100 K. λex=375 nm (Xenon lamp), Δλex=1 nm, Δλem=1.5 nm, step=2 nm, dwell time=0.2 s.
Measuring the Low-Temperature Phosphorescence Spectrum
In this step, the phosphorescence of the sample was acquired at 100 K by time-gating the photomultiplier tube (PMT) of the FLS1000. A detailed technical note focused on the principles of the PMT time-gating in FLS1000 can be found here.
Time-gating the PMT enables the separation of phosphorescence from fluorescence as the photodetector can be switched off during the fluorescence emission so that only the phosphorescence is acquired. The PMT time-gating parameters can be setup independently for each pulsed excitation source installed in the FLS1000 through the “Setup” menu. Here, a VPL-375 diode was used as the excitation source and the gating parameters for this source are accessed by selecting Setup → EPL (MCS) Laser Setup, in Fluoracle® (Figure 5a). In EPL (MCS) Laser Setup window the repetition rate of the excitation source can be modified (red frame in Figure 5b) and time-gating can be enabled by checking the “Gating On” tick box (green frame). The “Delay” (purple frame) is defined as the time after the start of the MCS acquisition window when the PMT turns ON and “Gate Width” (blue frame) indicates how long the PMT is ON for the data acquisition.
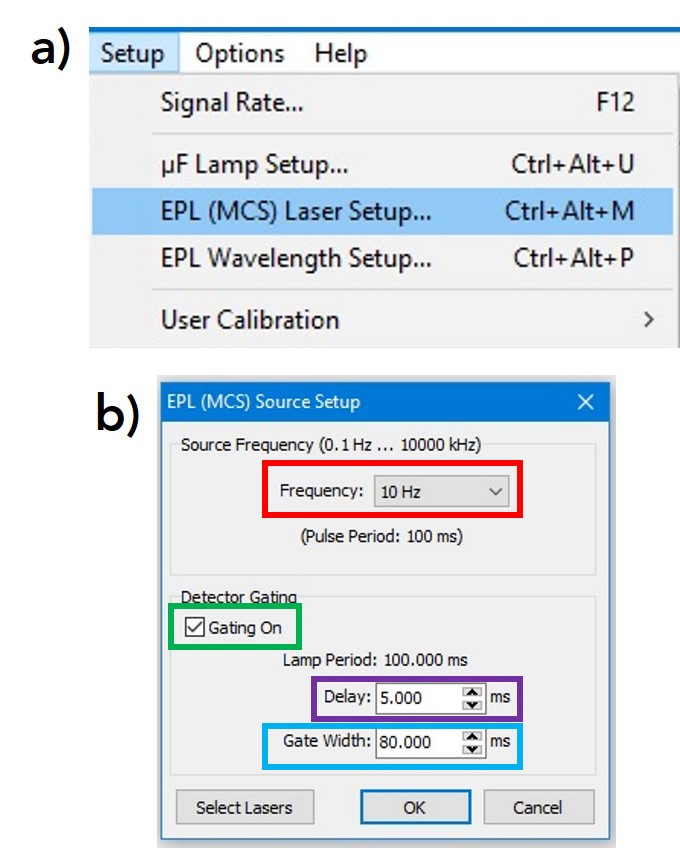
Figure 5: Time-gating user interface in Fluoracle®.
To find the correct gating parameters a PL decay was first measured using the VPL-375 laser with the gating disabled which allowed the location and duration of fluorescence to be observed. For phosphorescence spectra measurements the repetition rate of the VPL-375 and the pulse width were set to 10 Hz and 1 ms, respectively. The time-gating parameters were then set in Fluoracle® so that the PMT-980 was switched ON 5 ms (Delay) after excitation by the VPL-375 which ensured that the fluorescence had completely decayed, and remained ON (Gate Width) for 80 ms in total. The gated phosphorescence spectrum was acquired as shown in Figure 6. It is worth mentioning that the VPL is an ideal excitation source for measuring weak phosphorescence spectra due to the high excitation power it can deliver.
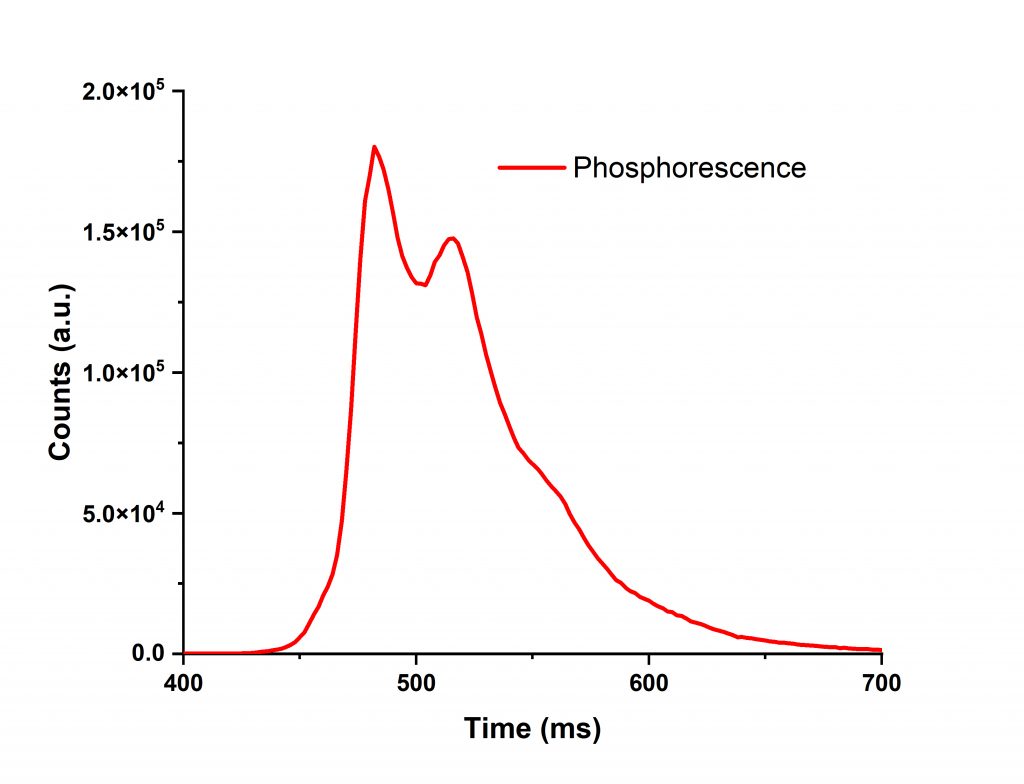 Figure 6: Gated phosphorescence spectrum at 100 K. λex=375 nm (VPL-375), Δλem=3 nm, step=2 nm, dwell time=10 s.
At this point, it should be noted that the phosphorescence lifetime at 100 K is ~ 200 ms (see Figure 7) and the chosen 10 Hz repetition rate therefore does not allow the phosphorescence to completely decay prior to re-excitation. This incomplete decay has no negative effect when measuring the phosphorescence spectrum and is actually recommended in order to acquire the phosphorescence spectrum more rapidly and improve the signal-to-noise ratio.
Obtaining the Low-Temperature Fluorescence Spectrum
The low-temperature PL (Figure 4) and phosphorescence (Figure 6) have now been acquired. The simplest way to obtain the corresponding low-temperature fluorescence spectrum is to subtract the phosphorescence spectrum from the PL spectrum. However, the two spectra were measured using different acquisition parameters and therefore have arbitrary relative intensities. The spectra must first be correctly scaled using the ratio of the fluorescence to phosphorescence at a chosen wavelength. This ratio can be calculated by measuring the PL decay and integrating the regions of fluorescence and phosphorescence.
The PL decay was acquired at an emission wavelength of 482 nm (peak of the phosphorescence) using the VPL-375 and is shown in Figure 7. The repetition rate of the VPL-375 was set to 0.1 Hz (10 s) to ensure that the phosphorescence has time to completely decay which is essential for accurate integration and scaling.
The spike at 0 ms is the fluorescence decay which occurs almost instantaneously on this timescale and the longer component is the phosphorescence. The ratio between the fluorescence and phosphorescence at 482 nm can be calculated by integrating the area of the fluorescence (green) and phosphorescence (pink), and therefore, Phosph/Fluor=0.241.
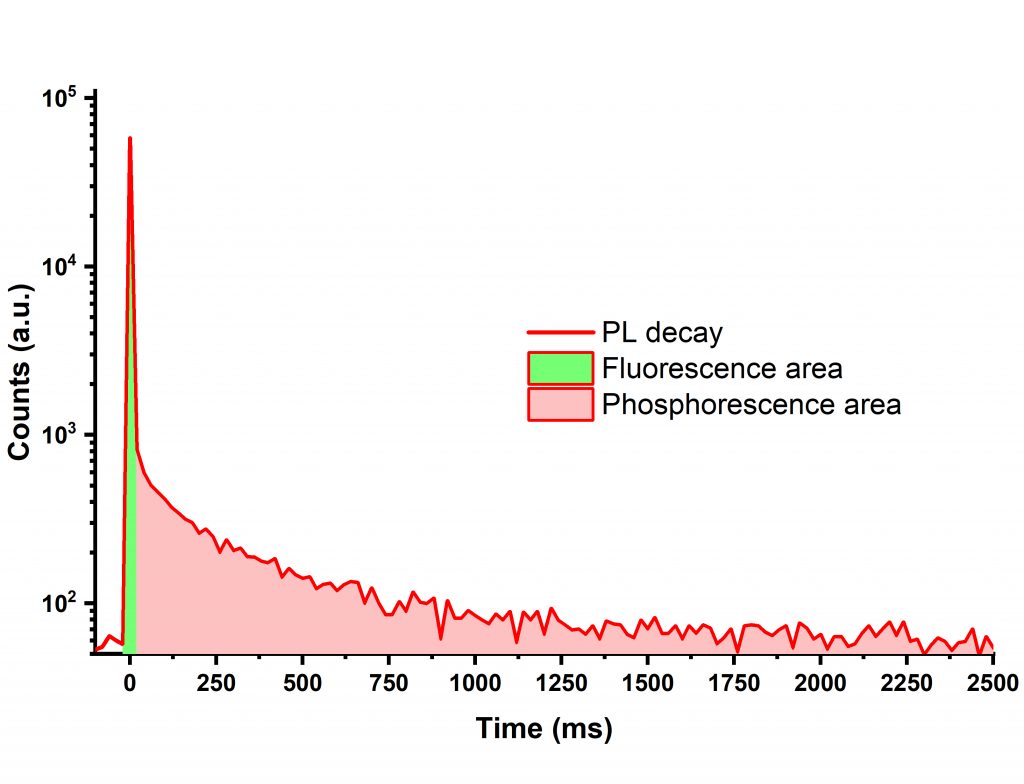 Figure 7: Lifetime decay at low temperature using the VPL-375 as excitation source.
To scale the spectra the PL and phosphorescence were first normalised to the decay acquisition wavelength (482 nm) by selecting Data → Normalise → At Wavelength, in Fluoracle®. The phosphorescence spectrum is then multiplied by the Phosphor/Fluor ratio of 0.241 (Data → Scale) to correctly scale its intensity relative to the PL spectrum. The normalised PL, phosphorescence and scaled phosphorescence are shown in Figure 8.
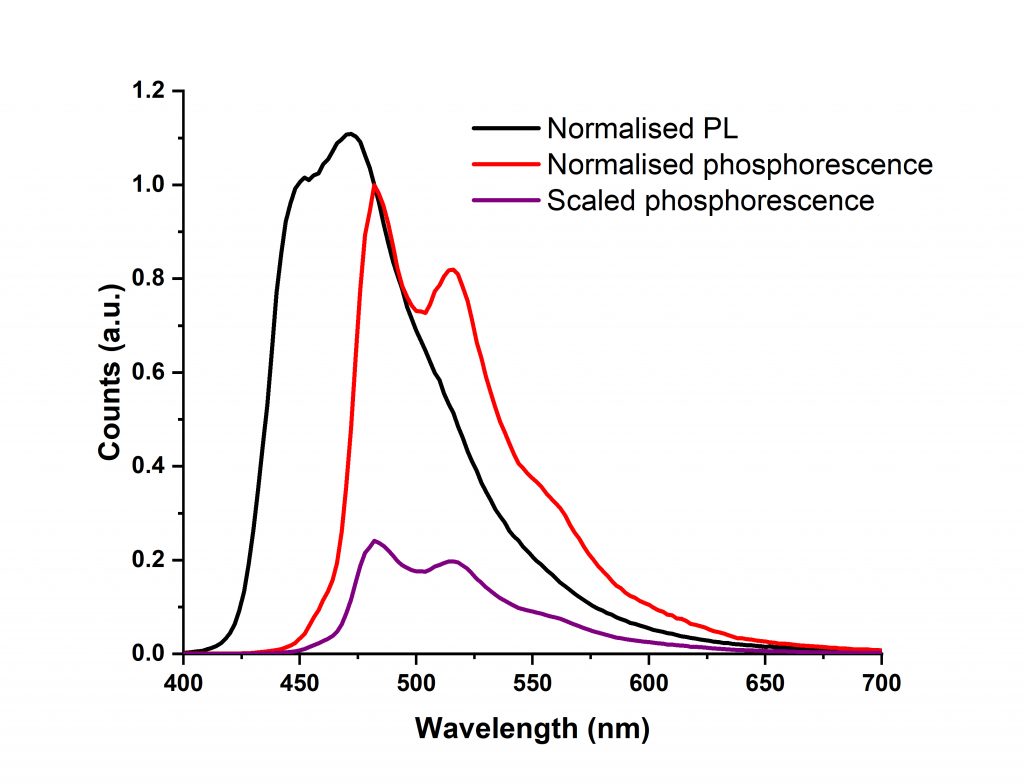 Figure 8: Normalised PL, phosphorescence and scaled phosphorescence by a factor of 0.241.
Now that PL and phosphorescence are correctly scaled, the low-temperature fluorescence spectrum can be obtained (Figure 9, in blue) by subtracting the scaled phosphorescence spectrum from the PL spectrum using Data → Combine → Subtract, in Fluoracle®.
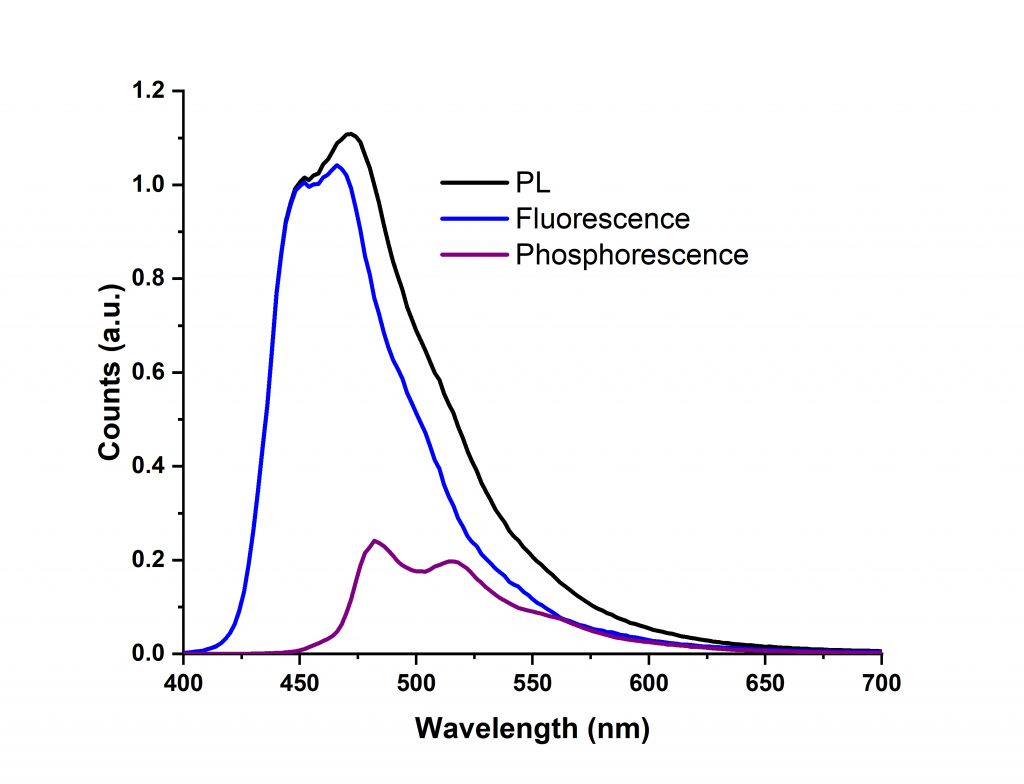 Figure 9: PL, fluorescence and phosphorescence spectra.
Conclusion
This technical note detailed the procedure for obtaining the fluorescence and phosphorescence spectra of a fluorescent emitter at low temperature, by using a FSL1000 Photoluminescence Spectrometer equipped with a gated PMT and a cryostat accessory. All data acquisition and analysis were conducted in Fluoracle®.
