


Confocal Raman and Photoluminescence Microscopy for Forensic Investigations
Introduction
Forensic investigations often study extremely small samples which may need analysed by multiple techniques. Confocal Raman and Photoluminescence (PL) Microscopy are well-suited techniques for dealing with forensic science samples. Only microscopic amounts of sample are required, and the techniques are non-destructive and non-contact meaning the sample can be further analysed using complimentary techniques. No sample preparation is required, and the results provide chemical and spatial information on sample components. This application note details how Raman and PL microscopy can be used as a forensic analysis tool in any laboratory.
Materials and Methods
All experiments were performed with either an RM5 or RMS1000 Raman Microscope. Both these microscopes are truly confocal in nature and offer a range of excitation wavelengths to cover all applications in forensic science.
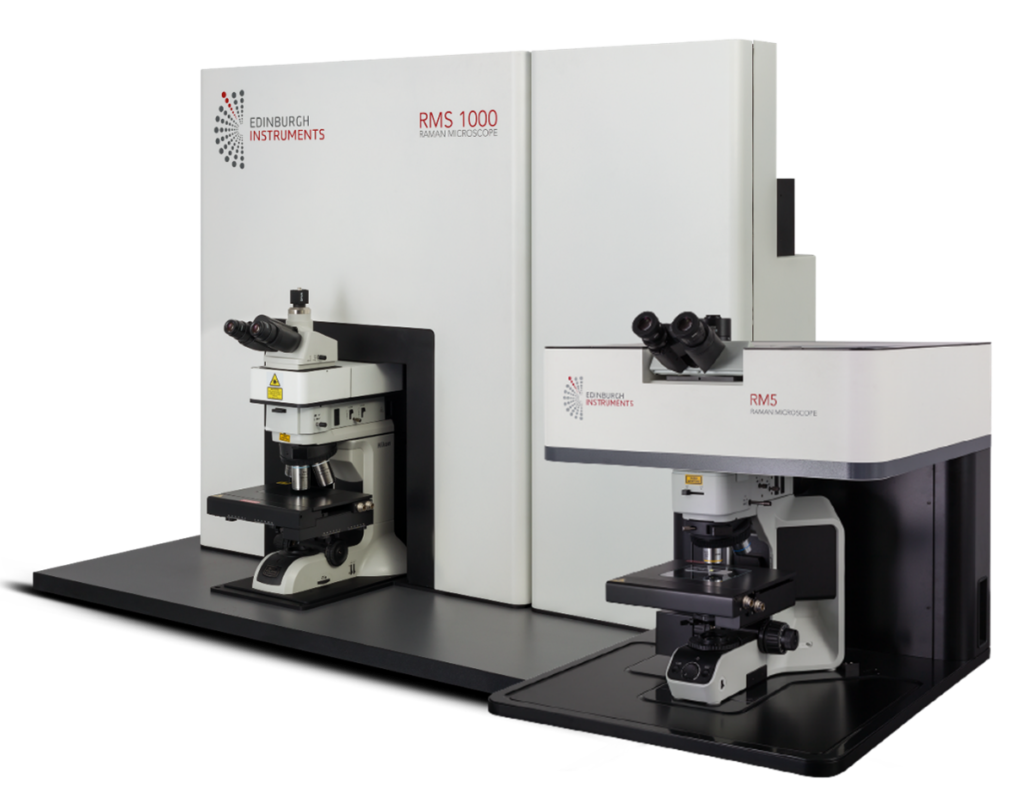
Figure 1: RMS1000 and RM5 Raman Microscopes.
The RM5 can host up to 3 lasers, and the RMS1000 up to 5 internal lasers plus additional external lasers. For these investigations 532 nm, 638 nm, and 785 nm lasers were used and gratings were chosen to compliment the laser choice with both instruments able to hold up to 5 computer-controlled gratings per spectrograph. In each example a back-illuminated CCD was used to acquire the Raman and PL spectra. False coloured maps were produced using the Ramacle operating software of the RM5 and RMS1000 to provide insight into sample components and distribution.
Forensic Analysis of Fingerprints
Whilst fingerprints are most famously used to identify a person during forensic analysis, they can also prove for the identification of trace chemical residues. When someone leaves behind a fingerprint, they typically deposit oils present on the skin, additionally, small amounts of solids may also be transferred, indicating what the person most recently touched or handled. Fingerprints are investigated in such a way to reveal any trace amounts of illicit substances such as drugs or explosives. To demonstrate this, a scientist in the lab handled small amounts of crushed paracetamol and then left a fingerprint on some aluminium foil. To the naked eye there was no powder present on the scientist’s hands. The fingerprint was then placed under the microscope on an RM5, equipped with a 785 nm laser, for trace evidence analysis.
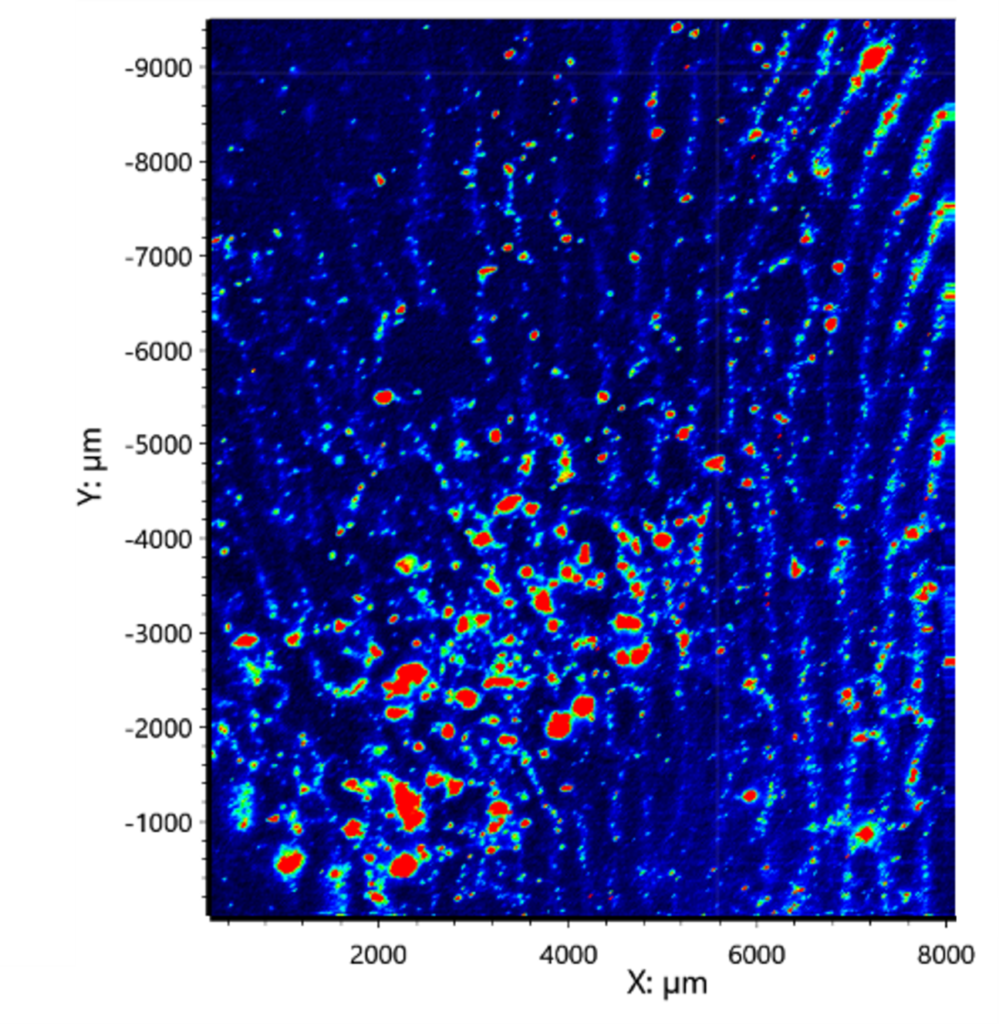
Figure 2: Raman map of a fingerprint on aluminium foil with trace amounts of paracetamol. The Raman map is coloured as a heatmap with areas in red high in Raman intensity at approx. 90 cm-1, a known peak from paracetamol, and blue represents areas with no paracetamol.
Figure 2 reveals a different story to what the human eye could see. We can now see deposits of small particles over the fingerprint, shown in red. The microscope has done its job in allowing the investigator to see the trace particles present, now the spectroscopic identification comes in to play. Thanks to Raman spectroscopy’s fingerprint-like chemical identification, the Raman spectrum from these particles can easily be identified as paracetamol (Figure 3), by comparing against a library of known drug spectra. This same principle can be applied for identified traces of drugs and explosives left behind in a fingerprint during forensic analysis.
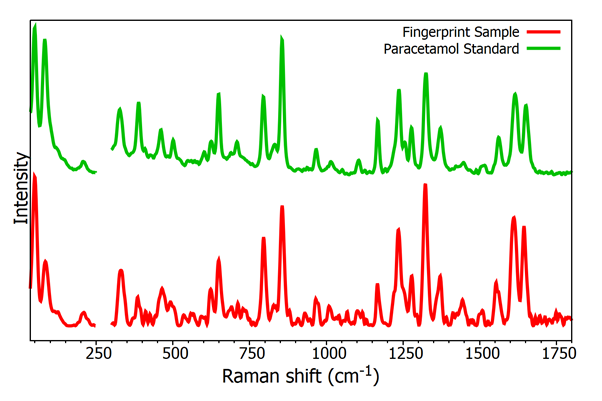
Figure 3: Raman spectra from the fingerprint and reference paracetamol.
Forgery and Photoluminescence in Forensic Analysis
A common line of investigation during forensics analysis is forgeries. Checking signatures, numbers, and specific dyes on items such as cheques and bank notes can be crucial for verifying the authenticity of a document. Typically dyes and inks are highly fluorescent in nature, which causes problems for Raman spectroscopy, however Edinburgh Instruments Raman Microscopes can be configured to also detect and measure PL spectra and provide identification characteristics.
The RM5 can easily be configured to measure PL maps, as well as Raman maps. PL spectra are typically much broader than Raman, and usually only one or two peaks are observed compared with numerous narrow peaks seen in a Raman spectrum. To capture the complete PL spectrum a low groove density grating is required, a higher groove density grating would be selected for Raman mapping due to the increased spectral resolution required to resolve the narrower peaks. Generally, a low laser power is needed as to not saturate the detector when measuring PL since PL intensity is usually much more intense than Raman scatter.
Document Analysis
Has this document been altered? A common question asked by police, custom officials, and even historians. It can prove tricky to analyse ink in-situ by commonly used forensic techniques such as chromatography without damaging the sample. Here we show an example of a document where the number 8 looks a bit suspicious. Was it always an 8, or has it been tampered with?
An RM5 Raman Microscope with a 638 nm laser at 0.1% power was used to investigate the document where forgery was questioned. From analysis we can instantly see the pen ink is highly fluorescent, therefore we measure the PL spectra instead of the Raman spectra. A 300 gr/mm grating was selected to observe the PL peak for reasons discussed above, at 638 nm excitation if we were measuring a Raman spectrum a 1200 gr/mm grating would typically be used. Edinburgh Instruments Raman Microscopes can host up to 5 software-controlled gratings making it simple to configure a system where the same laser may measure Raman and PL.
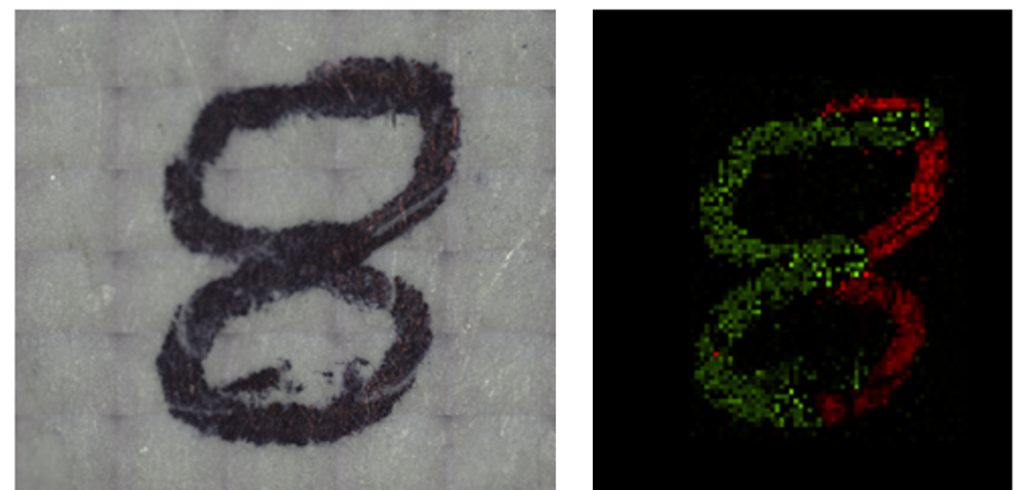
Figure 4: Left- white light stitched image of a document. Right- false coloured PL map
First, a white light stitched image across the full sample was taken over the number 8, left image in Figure 4. To the human eye, even under the microscope, the number 8 looks like it could be genuine and from one ink source. However, the PL map shown on the right of Figure 4 clearly identifies two different ink sources based on their different peak wavelengths. Figure 5 shows the PL spectra extracted from the red and green regions of the map; we can see from the map how the ink represented in green was applied to turn the 3 into an 8 using the difference in PL peak position.
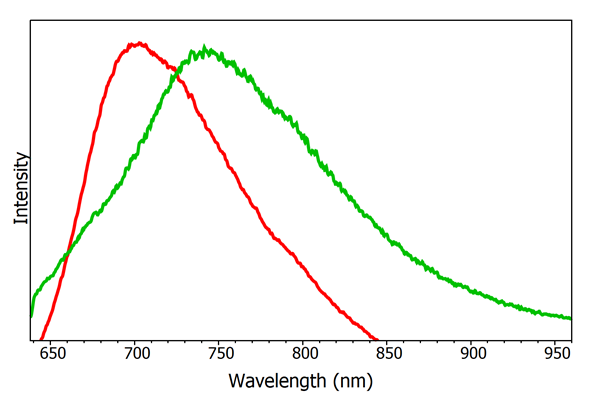
Figure 5: PL spectra extracted from the red and green areas of the map.
Bank Notes
Manufacturers of bank notes will use specific and unique dyes which helps keep authentic bank notes in circulation and aids the identification of forgeries. A second way we can utilise PL on our Raman microscopes can be highlighted by the investigation of bank notes. Using an RMS1000 Raman Microscope equipped with a 532 nm laser at 0.1% power and a 300 gr/mm grating, we looked at a Scottish Bank note to show how PL can distinguish between the two fluorophores in the sample.
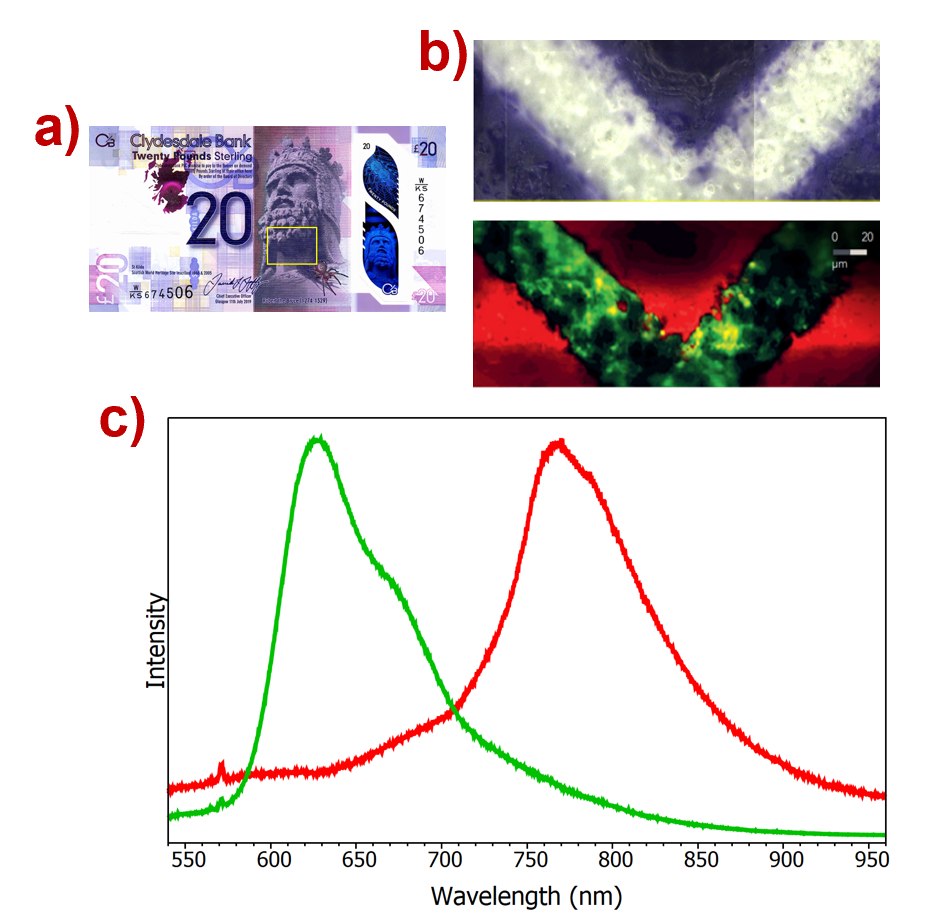
Figure 6: a) Clydesdale Bank note, b) top – image of area to be mapped, bottom – PL map, c) spectra from the PL map.
Figure 6a) shows the sample that was placed under the microscope, a £20 Clydesdale Bank polymer note bearing the portrait of Scottish king Robert the Bruce. An area of his beard, top figure 6b), was chosen for PL mapping. The PL map, bottom figure 6b), is coloured with the two PL contributions, one in green and one in red based on their peak wavelengths. These spectra are shown in Figure 6c) where it is clear to see the two PL contributions have significantly different peak positions. This a rapid way to check the authenticity of a bank note during forensic analysis under a Raman microscope to show the PL is occurring at the expected wavelength.
Conclusion
This application note presented some of the uses of confocal Raman microscopy for forensic analysis applications with the RM5 and RMS1000 Raman Microscopes. Firstly, the RM5 was used to demonstrate how the confocal microscope provides excellent spatial resolution allowing detection of trace materials deposited in fingerprints. The ability to easily take PL maps with Edinburgh Instruments Raman microscopes was then highlighted by investigating documents for any signs of forgeries. Confocal Raman and PL microscopy is an ideal tool for any forensic laboratory to provide chemical identification and spatial distribution information.
Keep in Touch
If you have enjoyed reading this application note, why not sign-up to our monthly eNewsletter via the button below or follow us on your favourite social media channel in the footer below to keep up to date with our latest news and research.
