


Identifying Thermally Activated Delayed Fluorescence (TADF) using an FS5 Spectrofluorometer
Introduction
Thermally activated delayed fluorescence (TADF), also known as E-type delayed fluorescence, was first observed in 1924 by Francis Perrin.1,2 In 2012 it received a resurgence in attention, and exposure to a wider audience, when Professor Chihaya Adachi and colleagues at Kyushu University used the TADF mechanism to harvest triplet excitons in organic light emitting diodes (OLED) and create a new type of high-efficiency OLED that does not require the use of heavy metals.3 TADF has since become one of the most popular approaches to harvest triplet excitons in OLEDs, and new TADF emitters with good stability and attractive colour coordinates are being intensely researched in both academia and industry.
The Triplet Exciton Problem
OLEDs are one of the most popular display types for televisions and smartphones, offering higher contrast ratios and lower power consumption than conventional LCD displays. In an OLED, layers of organic (carbon-based) semiconductors are sandwiched between two electrodes and electrons and holes are injected into the organic semiconductor under an applied bias. Upon encountering, the electrons and holes first form Coulombically bound electron-hole pairs called excitons which can then recombine to generate light. Due to spin statistics, 25% of the excitons formed will be in the singlet state (S1) and 75% in the triplet state (T1). In the first OLED designs, which used fluorescent molecular emitters, only the S1 state was emissive; with the T1 S0 radiative transition being forbidden due to conservation of spin angular momentum. These 1st generation OLEDs were therefore limited to a maximum internal quantum efficiency (IQE) of 25%.
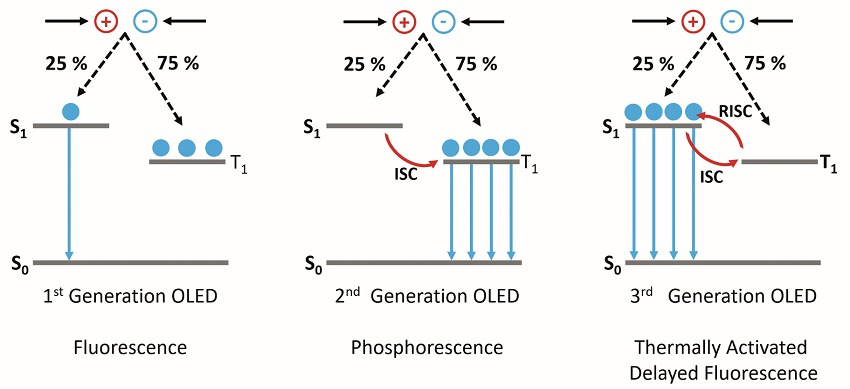
Figure 1: The operating mechanisms behind 1st, 2nd and 3rd generation OLEDs.
To overcome this limitation; heavy metals, such as platinum and iridium, were incorporated into the molecular emitters to make 2nd generation phosphorescent OLEDs. The presence of heavy metals in the molecule increases the strength of the spinorbit coupling between the spin angular momentum and the orbital angular momentum and the T1 > S0 radiative transition becomes allowed. This approach enables IQEs of 100% to be achieved; however, the use of heavy metals has several significant drawbacks. The metals are rare and expensive and are therefore impracticable for high production volumes. In addition, phosphorescent OLEDs suffer from poor stability, particularly in the blue, and to date, no stable deep blue phosphorescent emitter has been found.
3rd Generation TADF OLEDs
These shortcomings led to the development of heavy metal free 3rd generation OLEDs which operate using the TADF mechanism. In a TADF emitter, the S1 and 1 states are designed to be close in energy and strongly coupled, which enables excitons generated the T1 state to undergo a thermally assisted reverse intersystem crossing (RISC) to the S1 state where they can then radiatively decay to the S0 resulting in delayed fluorescence emission (Figure 1). Using TADF, IQEs of 100% can be achieved without the need for heavy metals. New TADF emitters with high quantum yields, good stability and desirable colour coordinates need to be developed. During the development of new emitters, the emission properties must be fully characterised and this information then used to refine subsequent molecular designs. In this application note, the capability of the FS5 Spectrofluorometer for providing a complete characterisation of TADF emitters is demonstrated by investigating the recently published emitter CzDBA, 4 and confirming the presence of TADF emission.
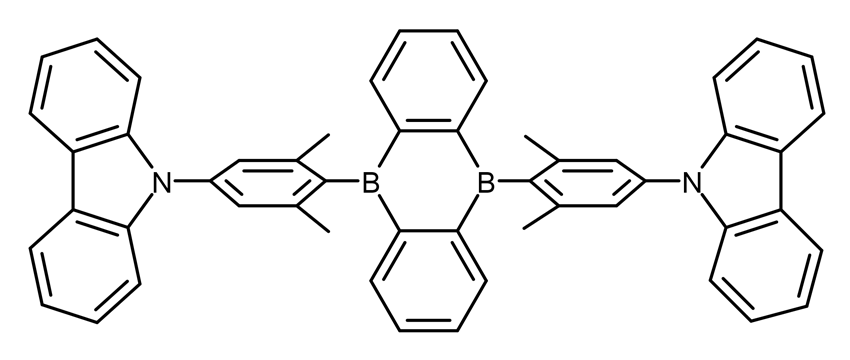
Figure 2: Chemical structure of the CzDBA TADF emitter.4
Materials & Methods
CzDBA was dissolved in toluene at a concentration of 2 x 10 –5 M. The solution was then degassed using freeze-pump-thaw and the cuvette backfilled with nitrogen to prevent the ingress of oxygen. Absorption and photoluminescence measurements were performed using the FS5 Spectrofluorometer equipped with a PMT-900 detector, multichannel scaling (MCS) lifetime electronics, a 150 W Xenon lamp, a 5 W microsecond Xe flashlamp and a 375 nm picosecond pulsed diode laser (EPL-375). Room temperature measurements were made using the SC-25 Thermoelectric Cuvette Holder Module, while cryogenic measurements utilised the SC-70 Liquid Nitrogen Dewar Module. To measure the PLQY, the SC-30 Integrating Sphere Module was used.
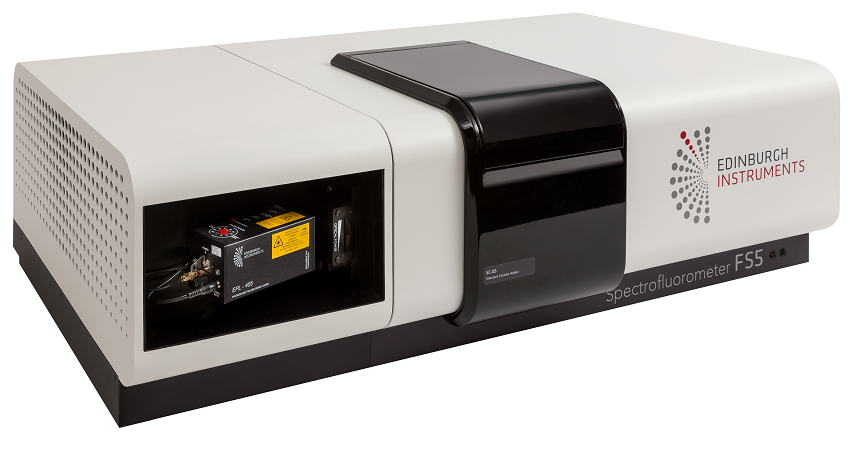
Figure 3: FS5 Spectrofluorometer.
Results & Discussion
Absorption & Emission Spectra
The first step in the characterisation of a TADF emitter is an accurate determination of its absorption and emission spectra. The FS5 Spectrofluorometer contains a transmittance detector as standard which enables absorption and emission spectra to be measured using a single instrument (Figure 4). The absorption of CzDBA has maxima at 290 nm and 340 nm with a long tail extending out to 500 nm. The emission spectrum is broad and featureless with an emission maximum at 550 nm and a FWHM of 95 nm, which corresponds to colour coordinates of 0.37, 0.58 in CIE 1931 colour space.
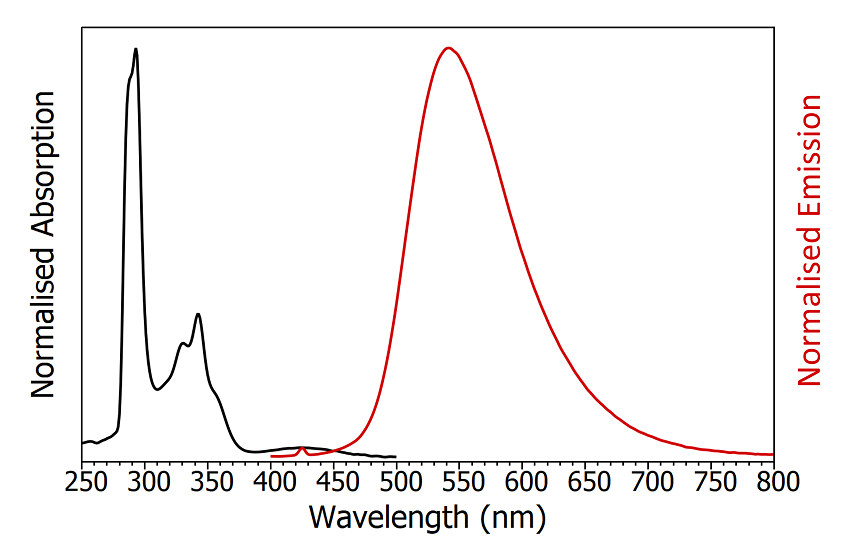
Figure 4: Absorption (black) and emission (red) spectra of degassed CzDBA in toluene. The small peak in the emission spectrum at 425 nm is the Raman scatter from the solvent. Absorption parameters: Δλ ex = 2 nm. Emission parameters: λex = 375 nm, Δλex = 2 nm, Δλex = 2 nm.
Oxygen Quenching of the Photoluminescence Quantum Yield
An initial check for the presence of TADF emission is the measurement of the photoluminescence quantum yield in the absence and presence of oxygen. Since TADF involves RISC from the T1 state then any mechanism that removes population from the T1 state will decrease the intensity of the TADF emission. Molecular oxygen has a triplet ground state and will therefore readily remove population from the T1 state through energy transfer and quench the TADF emission. The change in emission intensity when the CzDBA solution is exposed to oxygen is shown in Figure 5. The photoluminescence quantum yields were measured using the SC-30 Integrating Sphere Module of the FS5. The substantial 50% reduction in quantum yield when the solution is exposed to oxygen suggests that the T1 state is involved in the emission process and is the first indicator that the emission could contain TADF.
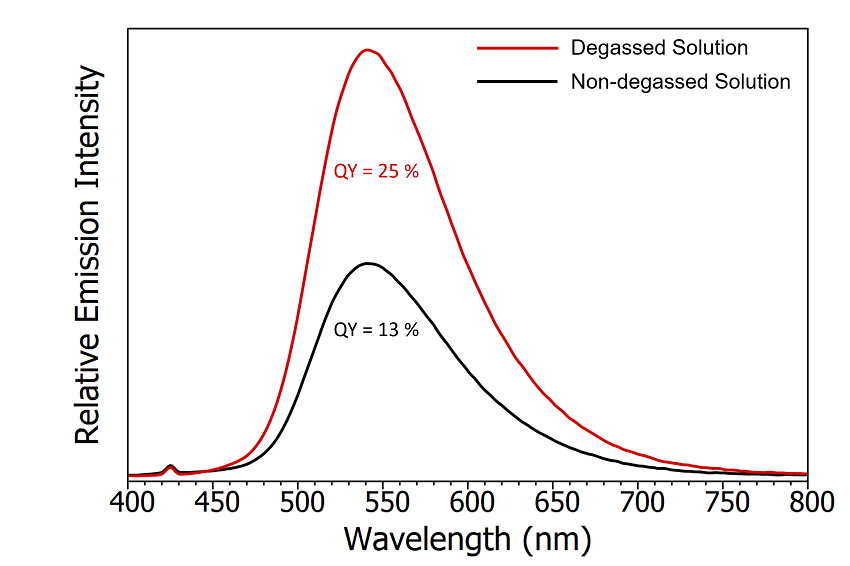
Figure 5: Emission spectra of degassed CzDBA solution (red) and nondegassed CzDBA (black). The quantum yield of the non-degassed solution was measured using the SC-30 Integrating Sphere module and the degassed quantum yield extrapolated based on the relative intensity of the emission. Experimental parameters: λex = 375 nm, Δλ ex = 5 nm , Δλem = 0.5 nm.
Emission Decay
To conclusively check for the presence of TADF, the temporal response of the emission must be measured. The FS5 can be equipped with lifetime counting electronics, flashlamps and a wide range of pulsed diode lasers and LEDs for measuring the fluorescence, delayed fluorescence and phosphorescence of materials. The emission decay of CzDBA was measured by exciting the solution with a pulsed diode laser and measuring the decay using multichannel scaling single photon counting (MCS) (Figure 6).
MCS is a complementary time-resolved technique to the more widely known time-correlated single photon counting (TCSPC). TCSPC is the method of choice for acquiring fast fluorescence decays at high laser excitation rates; but when the emission is long (>μs) and the excitation rate must be lowered, TCSPC becomes slow due to the requirement that the detection count rate must be <5% of the excitation rate. In MCS acquisition the detection window is split into time intervals and all photons that arrive within a specified time interval are counted, the photons in the next internal are then counted and so on until the entire time range has been covered. This multiple stop mode detection enables higher detection count rates to be used than in TCSPC which reduces the acquisition time of longer decays and is, therefore, the method of choice for measuring delayed fluorescence. The FS5 can be switched seamlessly between TCSPC and MCS acquisition modes with the Fluoracle software which enables the optimum detection method for the desired time change to be chosen.
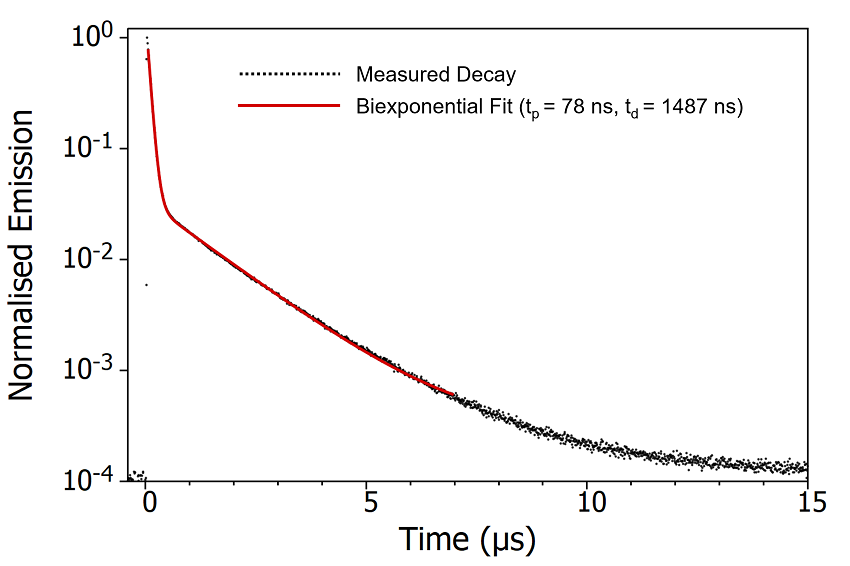
Figure 6: Emission decay of degassed CzDBA solution measured using MCS. Experimental Parameters: Source = EPL-375, Rep Rate = 50 kHz, λex = 375 nm, λem = 550 nm, Δλem = 20 nm.
The decay of the CzDBA emission has a characteristic biexponential behaviour consisting of a prompt component with a lifetime of 78 ns and a delayed component lifetime with a lifetime of
1487 ns. The prompt component can be assigned unambiguously as fluorescence arising from the S1 > S0 transition (Figure 7). The delayed component could either be delayed S1 > S0 fluorescence following repopulation of the S1 through RISC from the T1, or direct T1 S0 phosphorescence. It is not possible to conclusively distinguish between these mechanisms from the time scale of the emission alone.
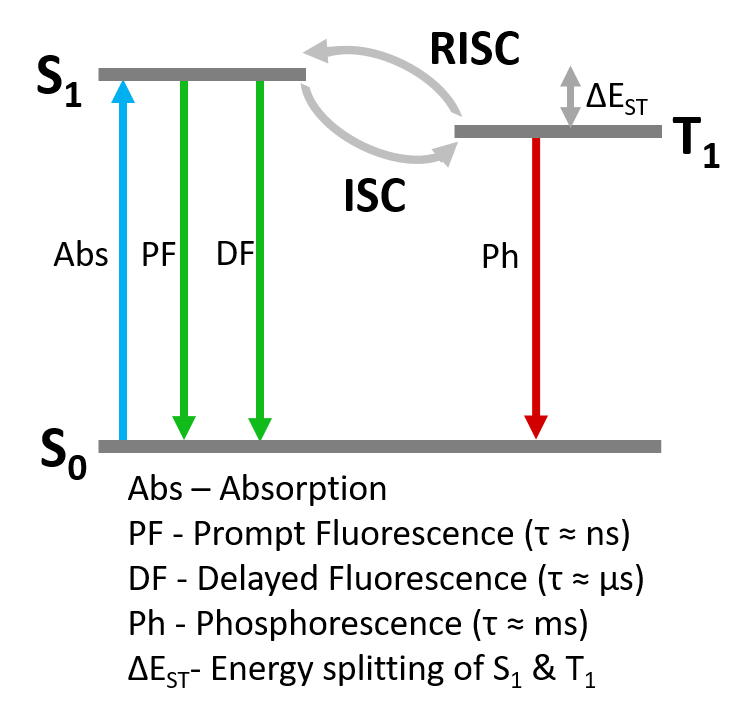
Figure 7: Simplified Jablonski Diagram of TADF photophysics.
Time-Resolved Emission Spectrum (TRES)
One method to determine whether the origin of the delayed component is delayed fluorescence or phosphorescence is comparing the spectral shape of the prompt and delayed components by acquiring a time-resolved emission spectrum (TRES). In a TRES measurement, the emission decay is measured as a function of emission wavelength to build up a three-dimensional time-resolved spectrum (Figure 8a). The TRES data can then be sliced to generate a snapshot of the emission spectrum at a specified time after the laser flash. Two TRES slices showing the shape of the prompt component (100 ns after flash) and the delayed component (4 μs after flash) are shown in Figure 8b. It is clear that the spectra of the prompt and delayed components are identical which suggests that the delayed component is delayed fluorescence since phosphorescence from the T1 state would occur at a longer wavelength than the fluorescence due to the lower lying energy of the T1 state.
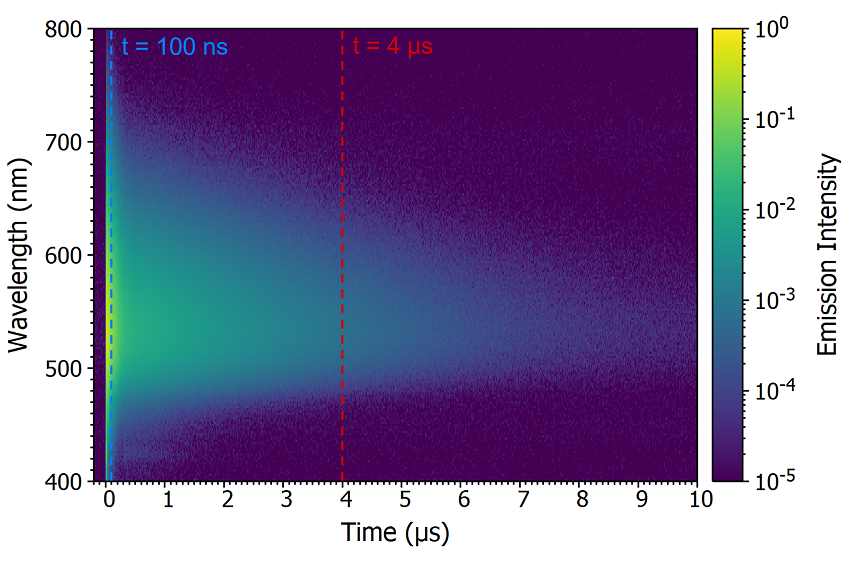
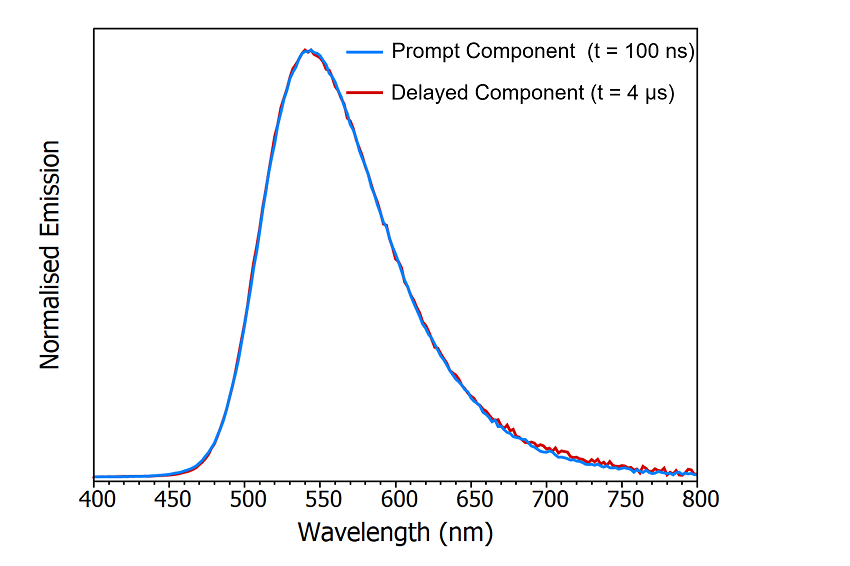
Figure 8: Time-resolved emission spectrum (TRES) of CzDBA solution measuring using MCS. TRES colour map (a) and TRES slices (b) of the prompt and delayed emission. Experimental Parameters: Source = EPL-375, Rep Rate = 50 kHz, λex = 375 nm, Δλem = 10 nm.
Temperature Dependence of the Emission Decay
The second method to determine the origin of the delayed component is measuring the temperature dependence of the decay. The FS5 can be equipped with a range of thermoelectric cuvette holders, heating stages, and cryostats which enable measurements to be carried out over a temperature range of 196°C (77K) to 600°C (873 K). The emission decays of CzDBA at 77 K and 300 K were measured using the SC-80 Liquid Nitrogen Dewar Module and are shown in Figure 9. It can be seen from Figure 9a that the delayed component is heavily suppressed when the sample is cooled to 77 K indicating that the delayed component arises from a thermally activated process. The decays were also measured on a longer timescale using the microsecond Xe flashlamp for excitation (Figure 9b) to check for longerlived millisecond phosphorescence emission. The long-lived phosphorescence shows the opposite trend, being present at 77 K but suppressed when the sample is warmed to 300K.
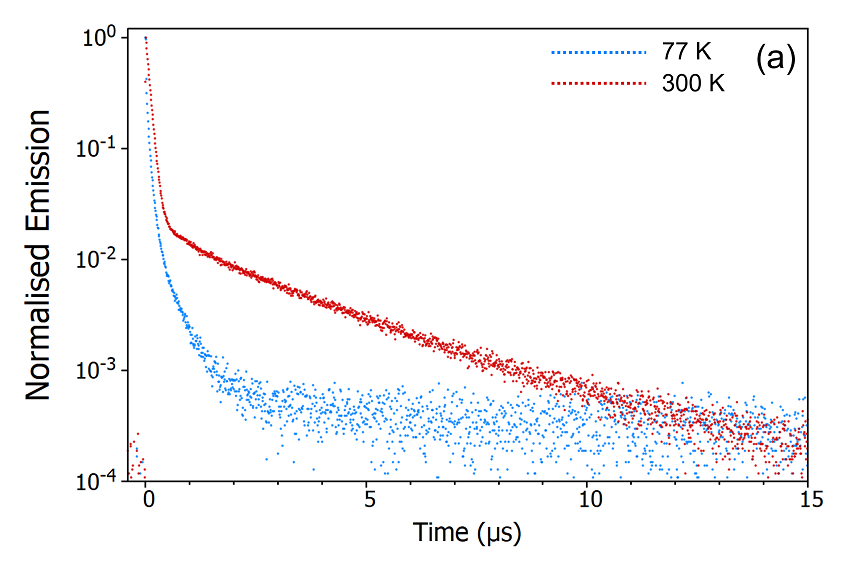
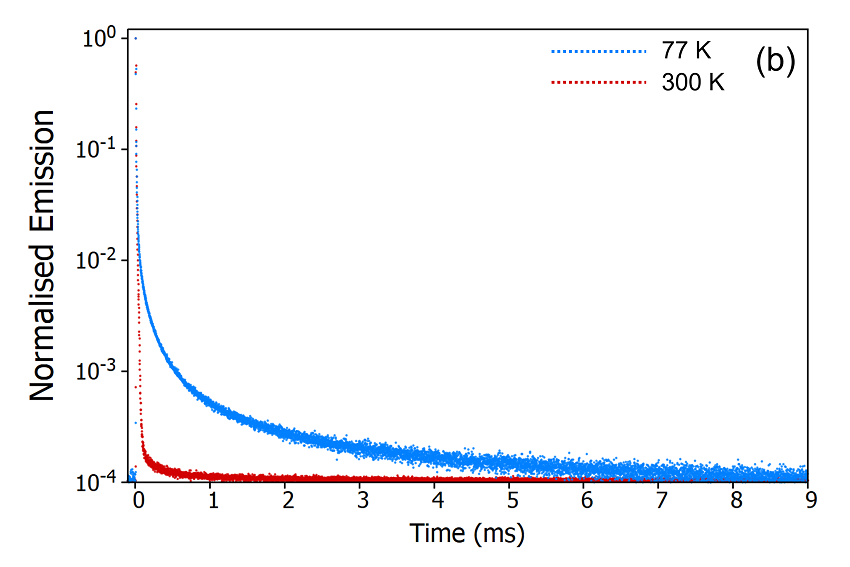
Figure 9: Variation of the delayed fluorescence intensity (a) and phosphorescence intensity (b) with temperature. Experimental Parameters (a): Source = EPL-375, Rep Rate = 50 kHz, λex = 375 nm, λ em = 550 nm, Δλem = 10 nm. Experimental Parameters (b): Source = μs Xe Flashlamp, Rep Rate = 100 Hz, λex = 375 nm, Δλ ex = 2 nm, λem = 550 nm, Δλ em = 2 nm.
These temperature dependent decays confirm the assignment of the delayed component as thermally activated delayed fluorescence. At 300 K the molecule has enough thermal energy to overcome the energy gap, ΔEST, between the S1 and the T1. RISC proceeds and repopulates the S1 state giving rise to delayed fluorescence and the depopulation of the T1 state suppresses the phosphorescence. When the sample is cooled to 77 K this situation reverses, the molecule no longer has enough thermal energy to overcome ΔE ST and RISC is switched off which results in suppressed delayed fluorescence and enhanced phosphorescence.
Conclusion
The absorption and emission properties of CzDBA were investigated using the FS5 Spectrofluorometer and the presence of TADF emission confirmed. This application note demonstrates the utility of the FS5 for investigating TADF emitters; being capable of characterising the absorption, emission, quantum yield and lifetime of new emitters in a single compact instrument.
References
1. F. Perrin, La fluorescence des solutions, Ann. Phys. 12 169–275 (1929)
3. H. Uoyama, K. Goushi, K. Shizu, H. Nomura and C. Adachi, Nature, 492, 234–238 (2012)
Acknowledgements
We are grateful to Dr Tien-Lin Wu and Prof. Chien-Hong Cheng at National Tsing Hua University, Taiwan for synthesising the TADF material used in this application note.
