Map of the Month – Document Forgery
Key Points
- The forgery of documents is a common problem for the police, customs officials, and historians.
- Forgeries are very difficult to detect by eye, and techniques such as chromatography will destroy the evidence.
- Photoluminescence spectroscopy can reveal differences between genuine and forged inks without damaging the evidence.
Welcome to Edinburgh Instruments’ blog celebrating our work in Raman, Photoluminescence, and Fluorescence Lifetime Imaging. Every month we aim to highlight our pick for Map of the Month to show how our Raman and fluorescence spectrometers can be used to reveal all the hidden secrets in your samples.
September
A common line of investigation during forensics analysis is forgeries. Checking signatures, numbers, and specific dyes on items such as cheques and banknotes can be crucial for verifying the authenticity of a document. Typically, dyes and inks are highly fluorescent in nature, which causes problems for Raman spectroscopists, however, Edinburgh Instruments Raman Microscopes can be configured to also detect and measure photoluminescence (PL) spectra and provide identification characteristics.
Has this document been altered?
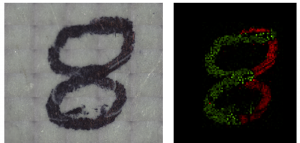
A common question asked by police, customs officials, historians, and us in this Map of the Month! It can prove tricky to analyse ink in situ by commonly used forensic techniques such as chromatography without damaging the sample or evidence! Here we show an example of a document where the number 8 looks a bit suspicious. Was it always an 8, or has it been tampered with?
An RM5 Raman Microscope was used to investigate the document where forgery was questioned. From the analysis we can instantly see the pen ink is highly fluorescent, therefore we measure the PL spectra instead of the Raman spectra.
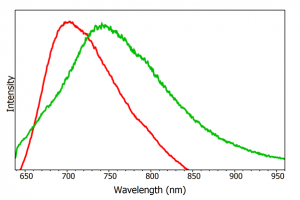
First, a white light stitched image across the full sample was taken over the number 8, left image above. To the human eye, even under the microscope, the number 8 looks like it could be genuine and from one ink source. However, the PL map shown on the right of the image clearly identifies two different ink sources based on their different peak wavelengths. The spectral plot below shows the PL spectra extracted from the red and green regions of the map; we can see from the map how the ink represented in green was applied to turn the 3 into an 8 using the difference in PL peak position.