


Molecular Beacon Probe Fluorescent Detection of DNA
Key Points
- Molecular beacon probes can identify target DNA and RNA sequences via fluorescence
- The FS5 Spectrofluorometer was used to determine an unknown concentration of target DNA using a molecular beacon probe
- The DNA and probe were incubated using the SC-27 Four Position Temperature Controlled Sample Module and the measurement of the four solutions automated.
Introduction
Molecular beacon probes are a sequence of nucleotides (the building blocks of DNA and RNA) that can be used to fluorescently detect the presence of a specific sequence of DNA or RNA. The molecular beacon (Figure 1) is designed so that a small number of nucleotide bases (between 5 and 7) at the sequence terminals are complementary to each other and get paired forming what is called the stem. The formation of the stem creates a loop of the unpaired bases, which is termed the stem-loop or hairpin loop. Finally, at one end of the nucleotide sequence there is a covalently attached fluorophore and a fluorescence quencher at the other end of the sequence. When the molecular beacon is in this hairpin form, the quencher heavily diminishes the fluorophore fluorescence through Förster Resonance Energy Transfer (FRET) quenching.
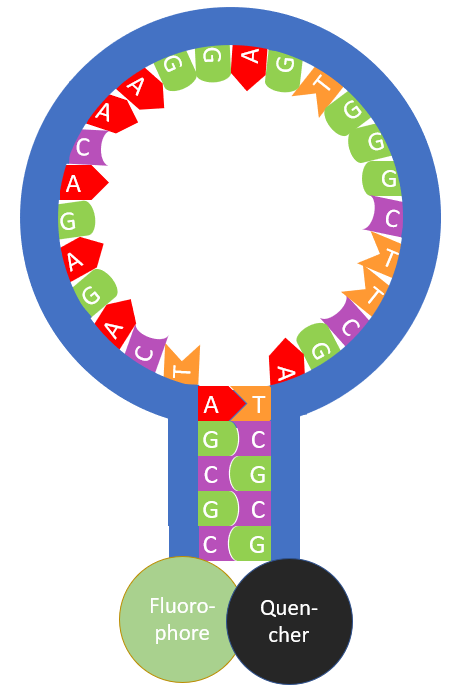
Figure 1: Molecular beacon probe.
A nucleotide sequence with complementary bases to the molecular beacon loop is called complementary DNA (cDNA). In the presence of its cDNA, the molecular beacon hairpin will open and hybridize with the cDNA to form a double stranded sequence (Figure 2). This hybridization results in the quencher and fluorophore moving further apart so that the fluorophore emission is no longer quenched. By monitoring the change in fluorescence from the fluorophore the presence of cDNA can be identified and quantified.
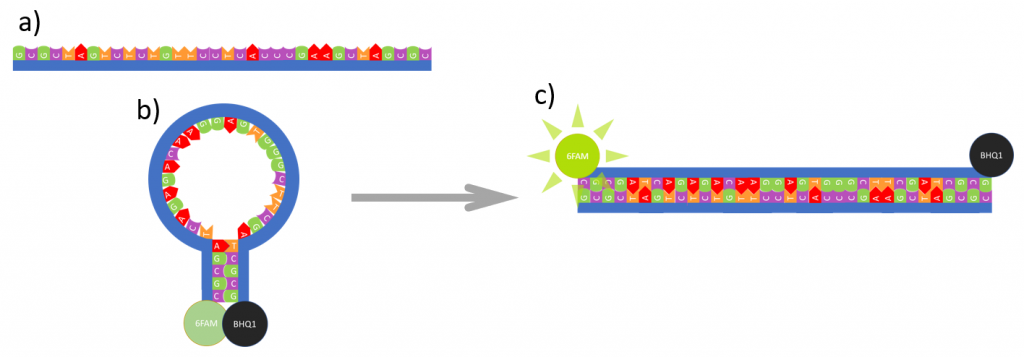
Figure 2: Reaction between molecular beacon and cDNA where a) is the cDNA, b) molecular beacon and c) their hybridization into a double strand sequence.
Molecular beacon probes can be custom designed to target specific DNA or RNA sequences, which allows molecular beacons to be used for real-time detection and quantification of DNA and RNA. Some real-world examples are PCR quantification, in vivo RNA detection, pathogen detection, viral load quantification and study nucleic acid-protein interactions. The use of molecular beacons, coupled with a sensitive spectrofluorometer and sample temperature control, facilitates the measurement of extremely low concentrations of DNA or RNA. In this application note, nanomolar concentrations of cDNA were quantified using a molecular beacon while controlling the temperature of incubation and measuring the sample emission with an Edinburgh Instruments FS5 Spectrofluorometer.
Experimental Setup
The molecular beacon and its cDNA were purchased from Merck. All measurements were acquired using an Edinburgh Instruments FS5 Spectrofluorometer equipped with the SC-27 4-Position Temperature Control sample module. The SC-27 was used to heat, while individually stirring, four solutions with different concentrations of cDNA and the molecular beacon. The beacon was excited using the FS5’s xenon lamp and its fluorescence detected using a PMT detector. Four solutions were analysed with a molecular beacon concentration of 100 nM and varying concentrations of cDNA: 0 nM, 20 nM, 40 nM, and 60 nM.
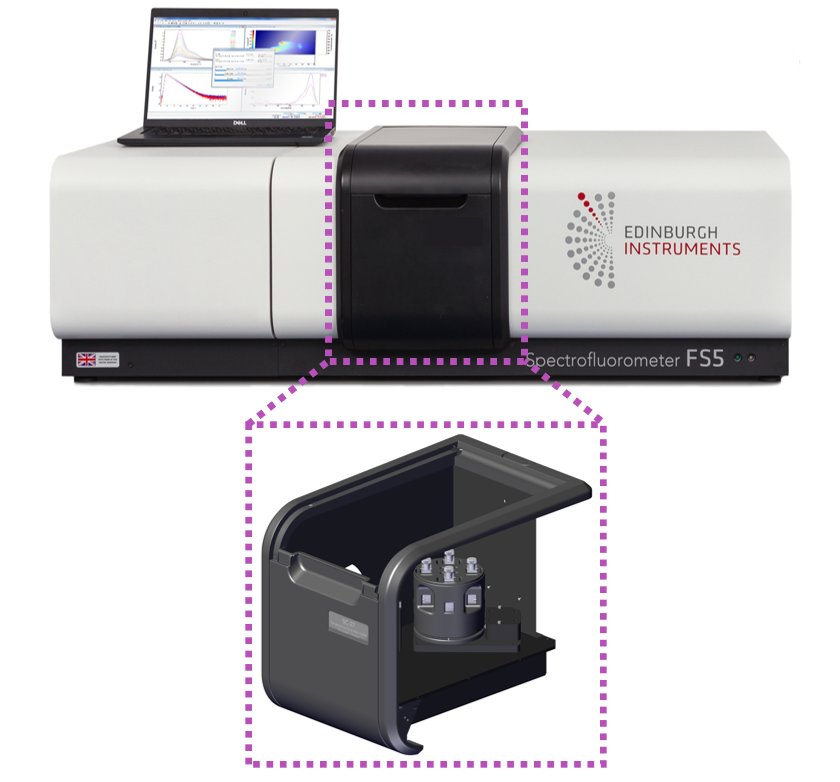
Figure 3: FS5 Spectrofluorometer with SC-27 sample holder.
Temperature Dependence of Hairpin Opening
Hybridization between the cDNA and molecular beacon can occur while the beacon is in the closed hairpin form but will proceed slowly. The hybridization can be accelerated by heating the molecular beacon to first open the hairpin structure. When heated the attraction between the stem base pairs of the hairpin structure is overcome, which is referred as denaturation or melting, and the hairpin opens. The temperature dependence of this opening can be studied using temperature dependent fluorescence, Figure 4.
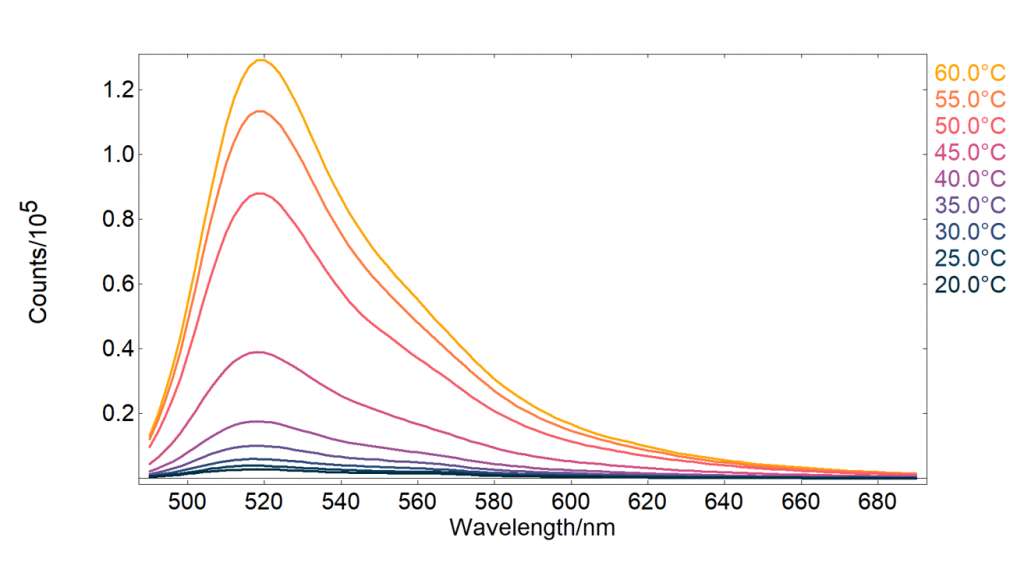
Figure 4: Molecular beacon fluorescence intensity at different temperatures.
The FS5 Fluoracle® software can automatically acquire temperature maps when a temperature-controlled sample module is used. The fluorescence temperature map, Figure 4, was acquired by heating the sample at each temperature for 20 minutes while stirring to ensure homogeneous heating of the sample, after the 20 minutes, the emission spectrum was measured before moving to the next temperature. It can be seen that the fluorescence intensity increases with temperature due to the hairpin opening and a reduction in FRET quenching. 60°C was found to be an adequate temperature for the hairpins to be completely open, with the emission at 60°C being 50 times higher than at 20°C. Based on these results 60°C was chosen as the incubation temperature for DNA detection.
DNA Detection
Four solutions of the molecular beacon with different cDNA concentrations were pipetted into cuvettes and placed in the four positions of the SC-27. To facilitate hybridization of the cDNA and beacon sequences, the solutions were incubated by heating at 60°C and holding at this temperature for 20 minutes. Then cooled back to 20°C and held at this temperature for a further 20 minutes. This incubation process of heating and cooling increases the hybridization rate between the molecular beacon and cDNA and is illustrated in Figure 5.
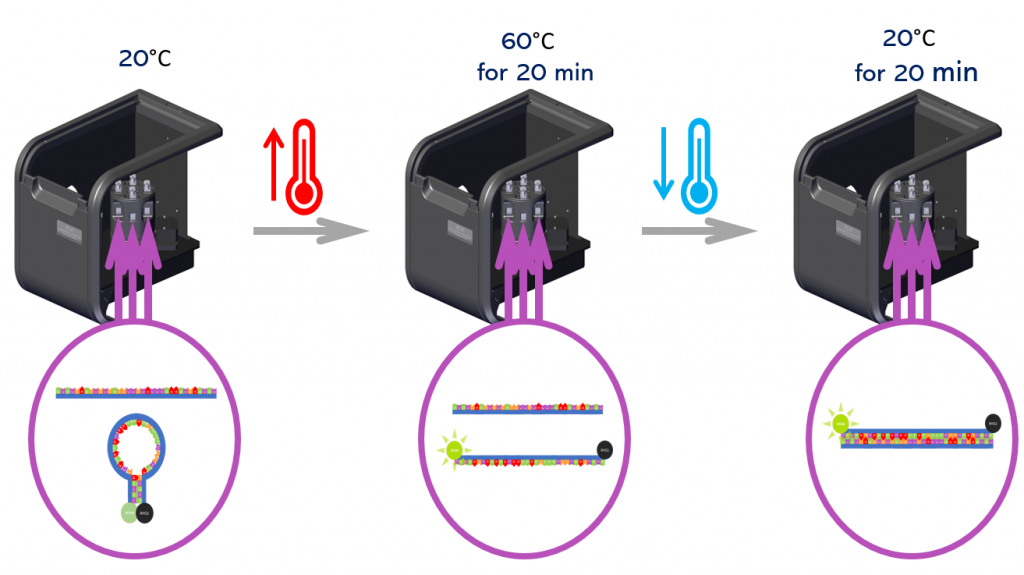
Figure 5: Schematic of the cDNA and molecular beacon hybridization incubation procedure in the SC-27.
The fluorescence spectra of the four solutions after incubation were measured sequentially and shown in Figure 6. The SC-27 enables the automated measurement of four samples with the same measurement parameters. It can be seen that the molecular beacon only solution shows its characteristic emission even without any presence of cDNA, which is due to a small amount of the fluorophore being free in the solution. As the concentration of cDNA is increased, the fluorescence intensity increases due to beacons hybridizing with the cDNA and the fluorophores on the beacon becoming unquenched.
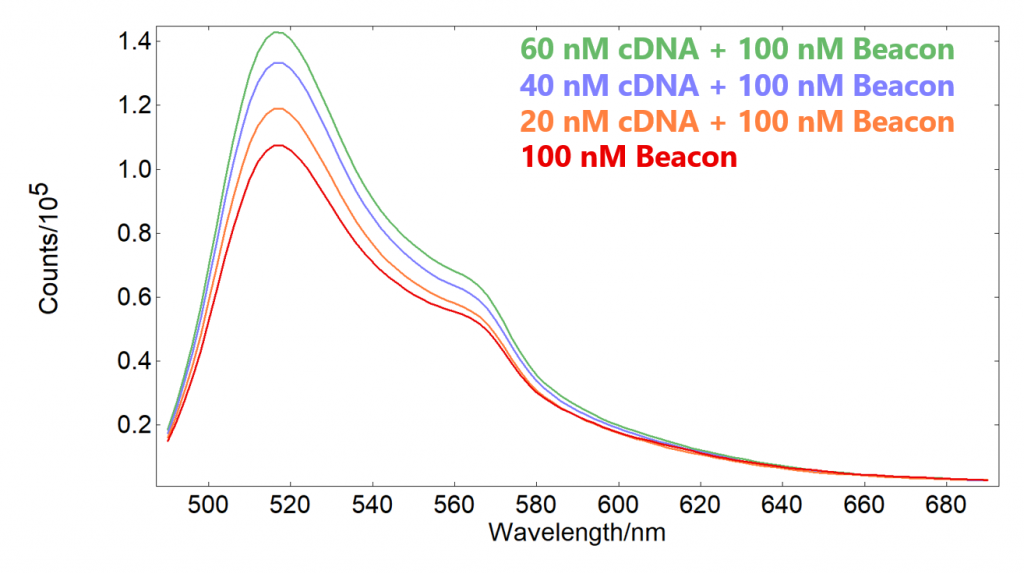
Figure 6: Fluorescence spectra of the molecular beacon solutions in the presence of different concentrations of cDNA.
Knowing the fluorescence intensity of samples of known cDNA concentration allows a mathematical correlation between the fluorescence intensity and cDNA to be established. Using the Trend Analysis feature of Fluoracle®, the measurements in Figure 6 were used to create a calibration curve relating the emission intensity at the 516 nm peak to the cDNA concentration (Figure 7).
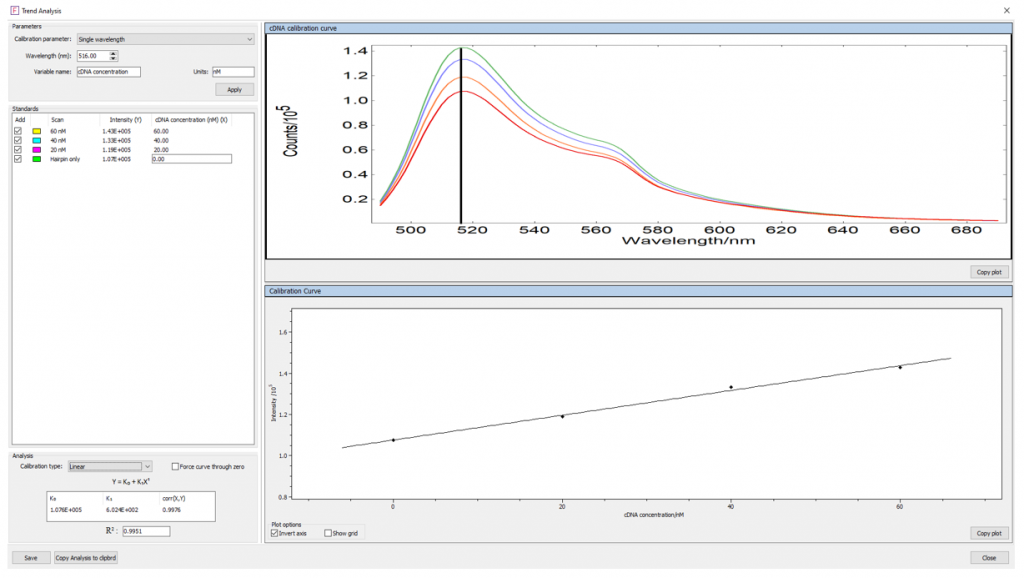
Figure 7: cDNA concentration trend analysis.
The following linear relationship between the cDNA concentration and fluorescence intensity was found:
Y = 1.076 × 10⁵ + 6.024 × 10² X
Where Y is the fluorescence intensity at 516nm, and X is the cDNA concentration in nM.
From this mathematical correlation, the concentration of cDNA in an unknown sample can be determined from its fluorescence intensity. To demonstrate this, a sample with 100 nM molecular beacon concentration and an unknown concentration of cDNA was incubated and the fluorescence at 516 nm measured, which returned a cDNA concentration of 27 nM (Figure 8).
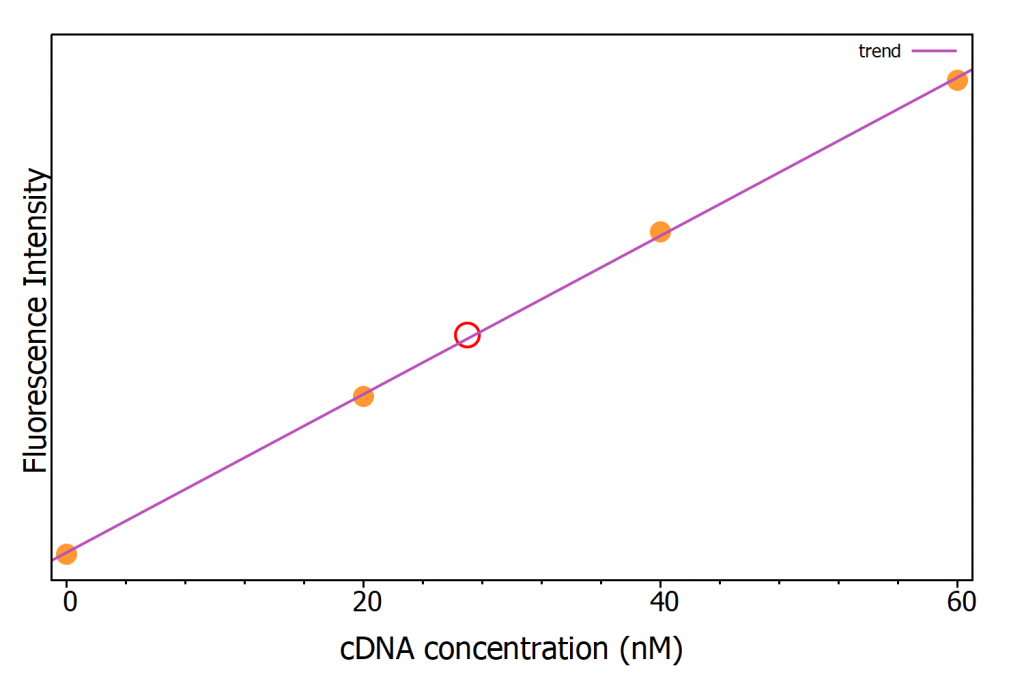
Figure 8: Calibration curve with cDNA known concentration samples (orange dots) and unknown cDNA concentration sample (red circle).
Conclusion
An Edinburgh Instruments FS5 Spectrofluorometer was used to determine an unknown concentration of DNA, in the order of nanomolar, using a molecular beacon probe. The DNA and probe solutions were incubated using the SC-27 Four Position Temperature Controlled Sample Module and the measurement of the fluorescence intensity of the four solutions automated. The results were analysed using the Trend Analysis feature of the FS5 Fluoracle® software.
FS5 Spectrofluorometer
Designed to achieve optimal sensitivity, resolution, and acquisition speed, the FS5 Spectrofluorometer provides the highest measurement specifications in the research and analytical markets. For further information on our FS5 Spectrofluorometer, or our research on fluorescence intensity and the quenching of fluorescence, why not contact one of our sales team at sales@edinst.com.
