Temperature-dependent (TD) Raman microscopy is a powerful and non-destructive method that can probe the thermal and electronic properties of semiconductor materials with sub-micron spatial resolution.
Higher temperatures influence crucial properties of semiconductors, leading to increased conductivity and reduced resistance.1 These properties are intimately linked to the performance of the final device. It is, therefore, essential to have sensitive and specific techniques that can be used to non-invasively investigate the temperature of devices to rationalise the observed performance.
TD Raman microscopy is capable of this because the Raman spectrum of a semiconductor material is highly sensitive to changes in temperature.2 More specifically, shifts in the peak position of the phonon modes in a semiconductor can be directly related to thermal expansion or contraction within the crystal lattice, and calibrations can be performed that directly link this to temperature. This technique is also known as Raman thermometry.
In this Application Note, we demonstrate the power of TD Raman microscopy by investigating the temperature-induced phonon mode shifts in a silicon (Si) chip with an Edinburgh Instruments RM5 Confocal Raman Microscope equipped with a temperature stage. We show that Raman thermometry can be used to non-invasively determine the temperature of Si-based devices.
The sample analysed was a 10 mm x 10 mm chip from an n-doped Si wafer. The chip was placed in a Linkam THMS600 Heating and Cooling Stage, which allows for temperature control in a range between 78 K and 873 K.
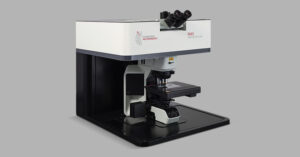
The stage was fixed underneath the microscope of an RM5 equipped with a 50X 0.5 NA long-working distance objective, a 532 nm laser and a 2400 gr/mm diffraction grating, Figure 1, which allowed for very high spectral resolution to be achieved. Spectral band positions were calculated using a twice-smoothed Lorentzian function in Ramacle® software. The temperature of the stage was controlled using Ramacle, and spectra were recorded between 173 K and 473 K in 25 K steps.
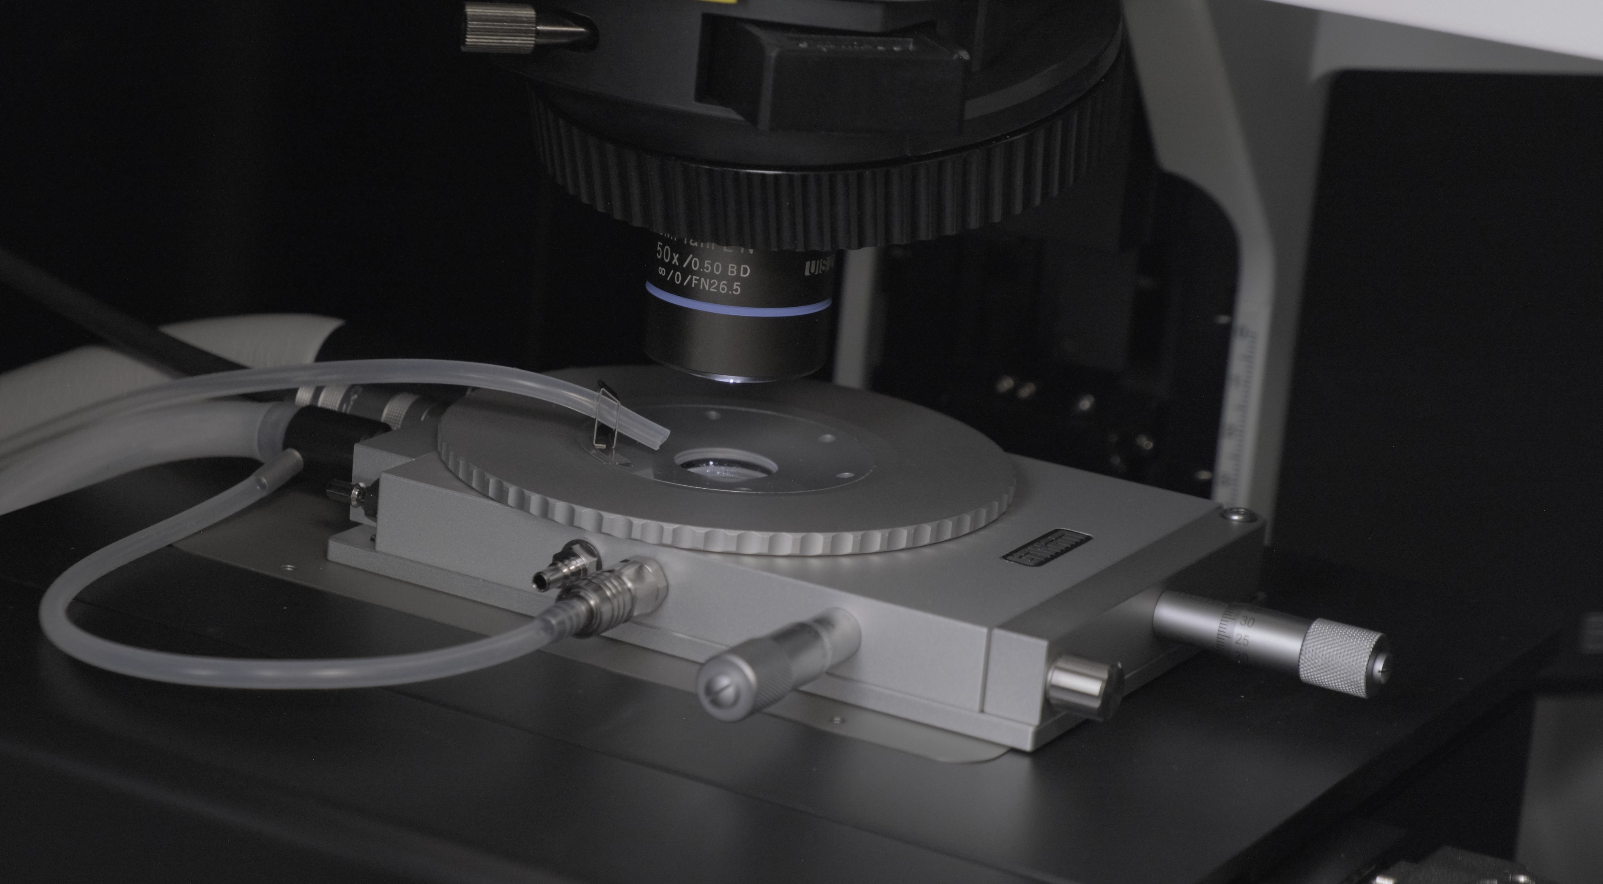
Figure 1. An n-doped Si wafer inside a Linkam THM600 fitted to an RM5.
Raman thermometry is the determination of the temperature of a sample using features of its Raman spectrum. The technique relies on the spectrometer having sufficiently high spectral resolution. This could potentially be a useful technique in a variety of applications, including microelectronics, materials science, and biomedical sensing. To achieve this, a calibration curve of Raman shift versus temperature is required. This is produced from spectra recorded at the same point of the sample at various known temperatures.
Figure 2 shows Raman spectra recorded on an n-doped Si chip between 173 K and 473 K in 25 K steps. These spectra show that as the temperature increases, the intensity of the dominant LO phonon band in Si (ca. 520.5 cm-1 at room temperature) decreases, and the position of the band gradually shifts to a lower wavenumber.
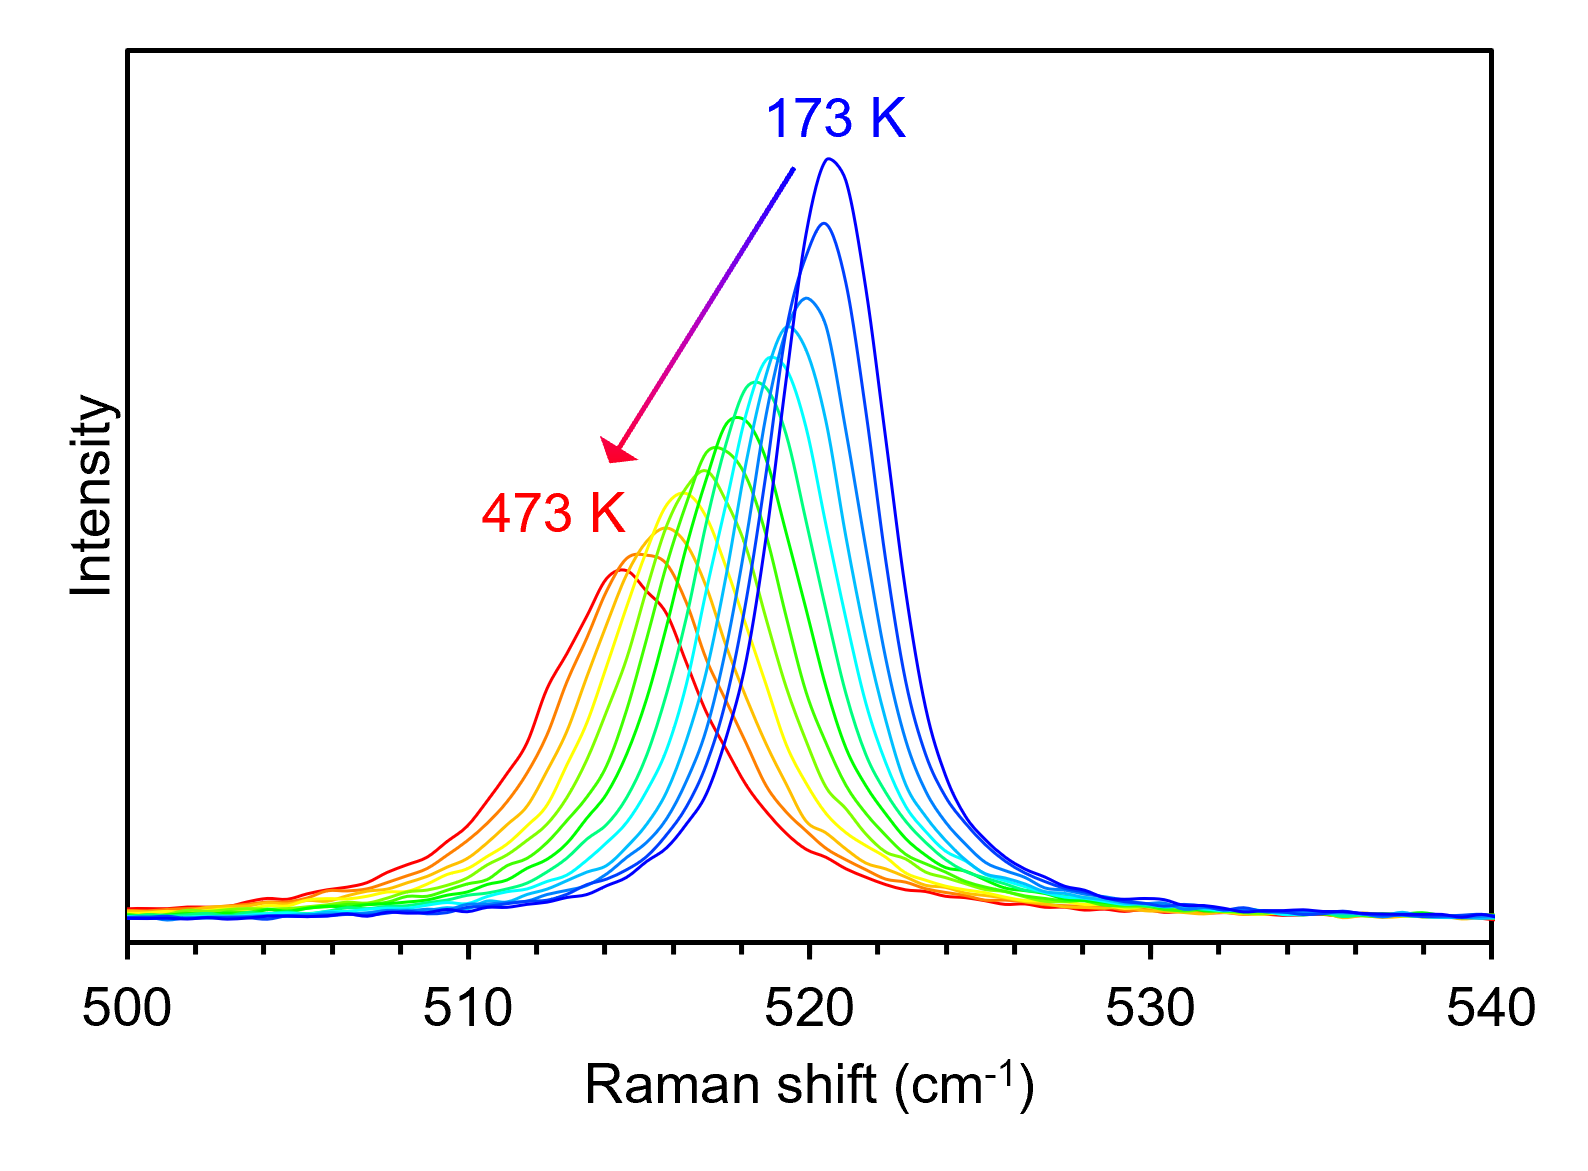 Figure 2. Raman spectra recorded from an n-doped Si chip between 173 K and 473 K in 25K steps.
The decrease in intensity of the LO phonon mode with increasing temperature can be understood using the Boltzmann distribution, Equation 1, which describes the statistical population of the ground and excited vibration energy levels relative to temperature.
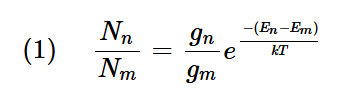
Nn and Nm are the number of molecules in the excited and ground vibrational energy levels, g describes the degeneracy of the energy levels and for the purposes of this work can be ignored, (En–Em) is the energy difference (kg m2 s-2) between the excited and ground vibrational energy levels, k is the Boltzmann constant (1.38065×10⁻²³ m2 kg s-2), and T is the temperature of the sample. To put this equation simply, the ratio of excited state to ground state populations is proportional to temperature.3
The spectra in Figure 2 show the Stokes Raman LO phonon band, which always has a positive Raman shift relative to the Rayleigh scattering line of the laser at 0 cm-1. Stokes Raman scattering can only occur when the material under investigation is in the ground vibrational level prior to optical excitation, and the Boltzmann distribution describes the decreasing population of the ground state as the sample temperature increases. It therefore follows that as the sample temperature increases, the Stokes intensity decreases because the sample is raised to a higher vibrational energy state by thermal excitation, Figure 3. Conversely, using the same logic, the intensity of anti-Stokes scattering will increase at higher temperatures.
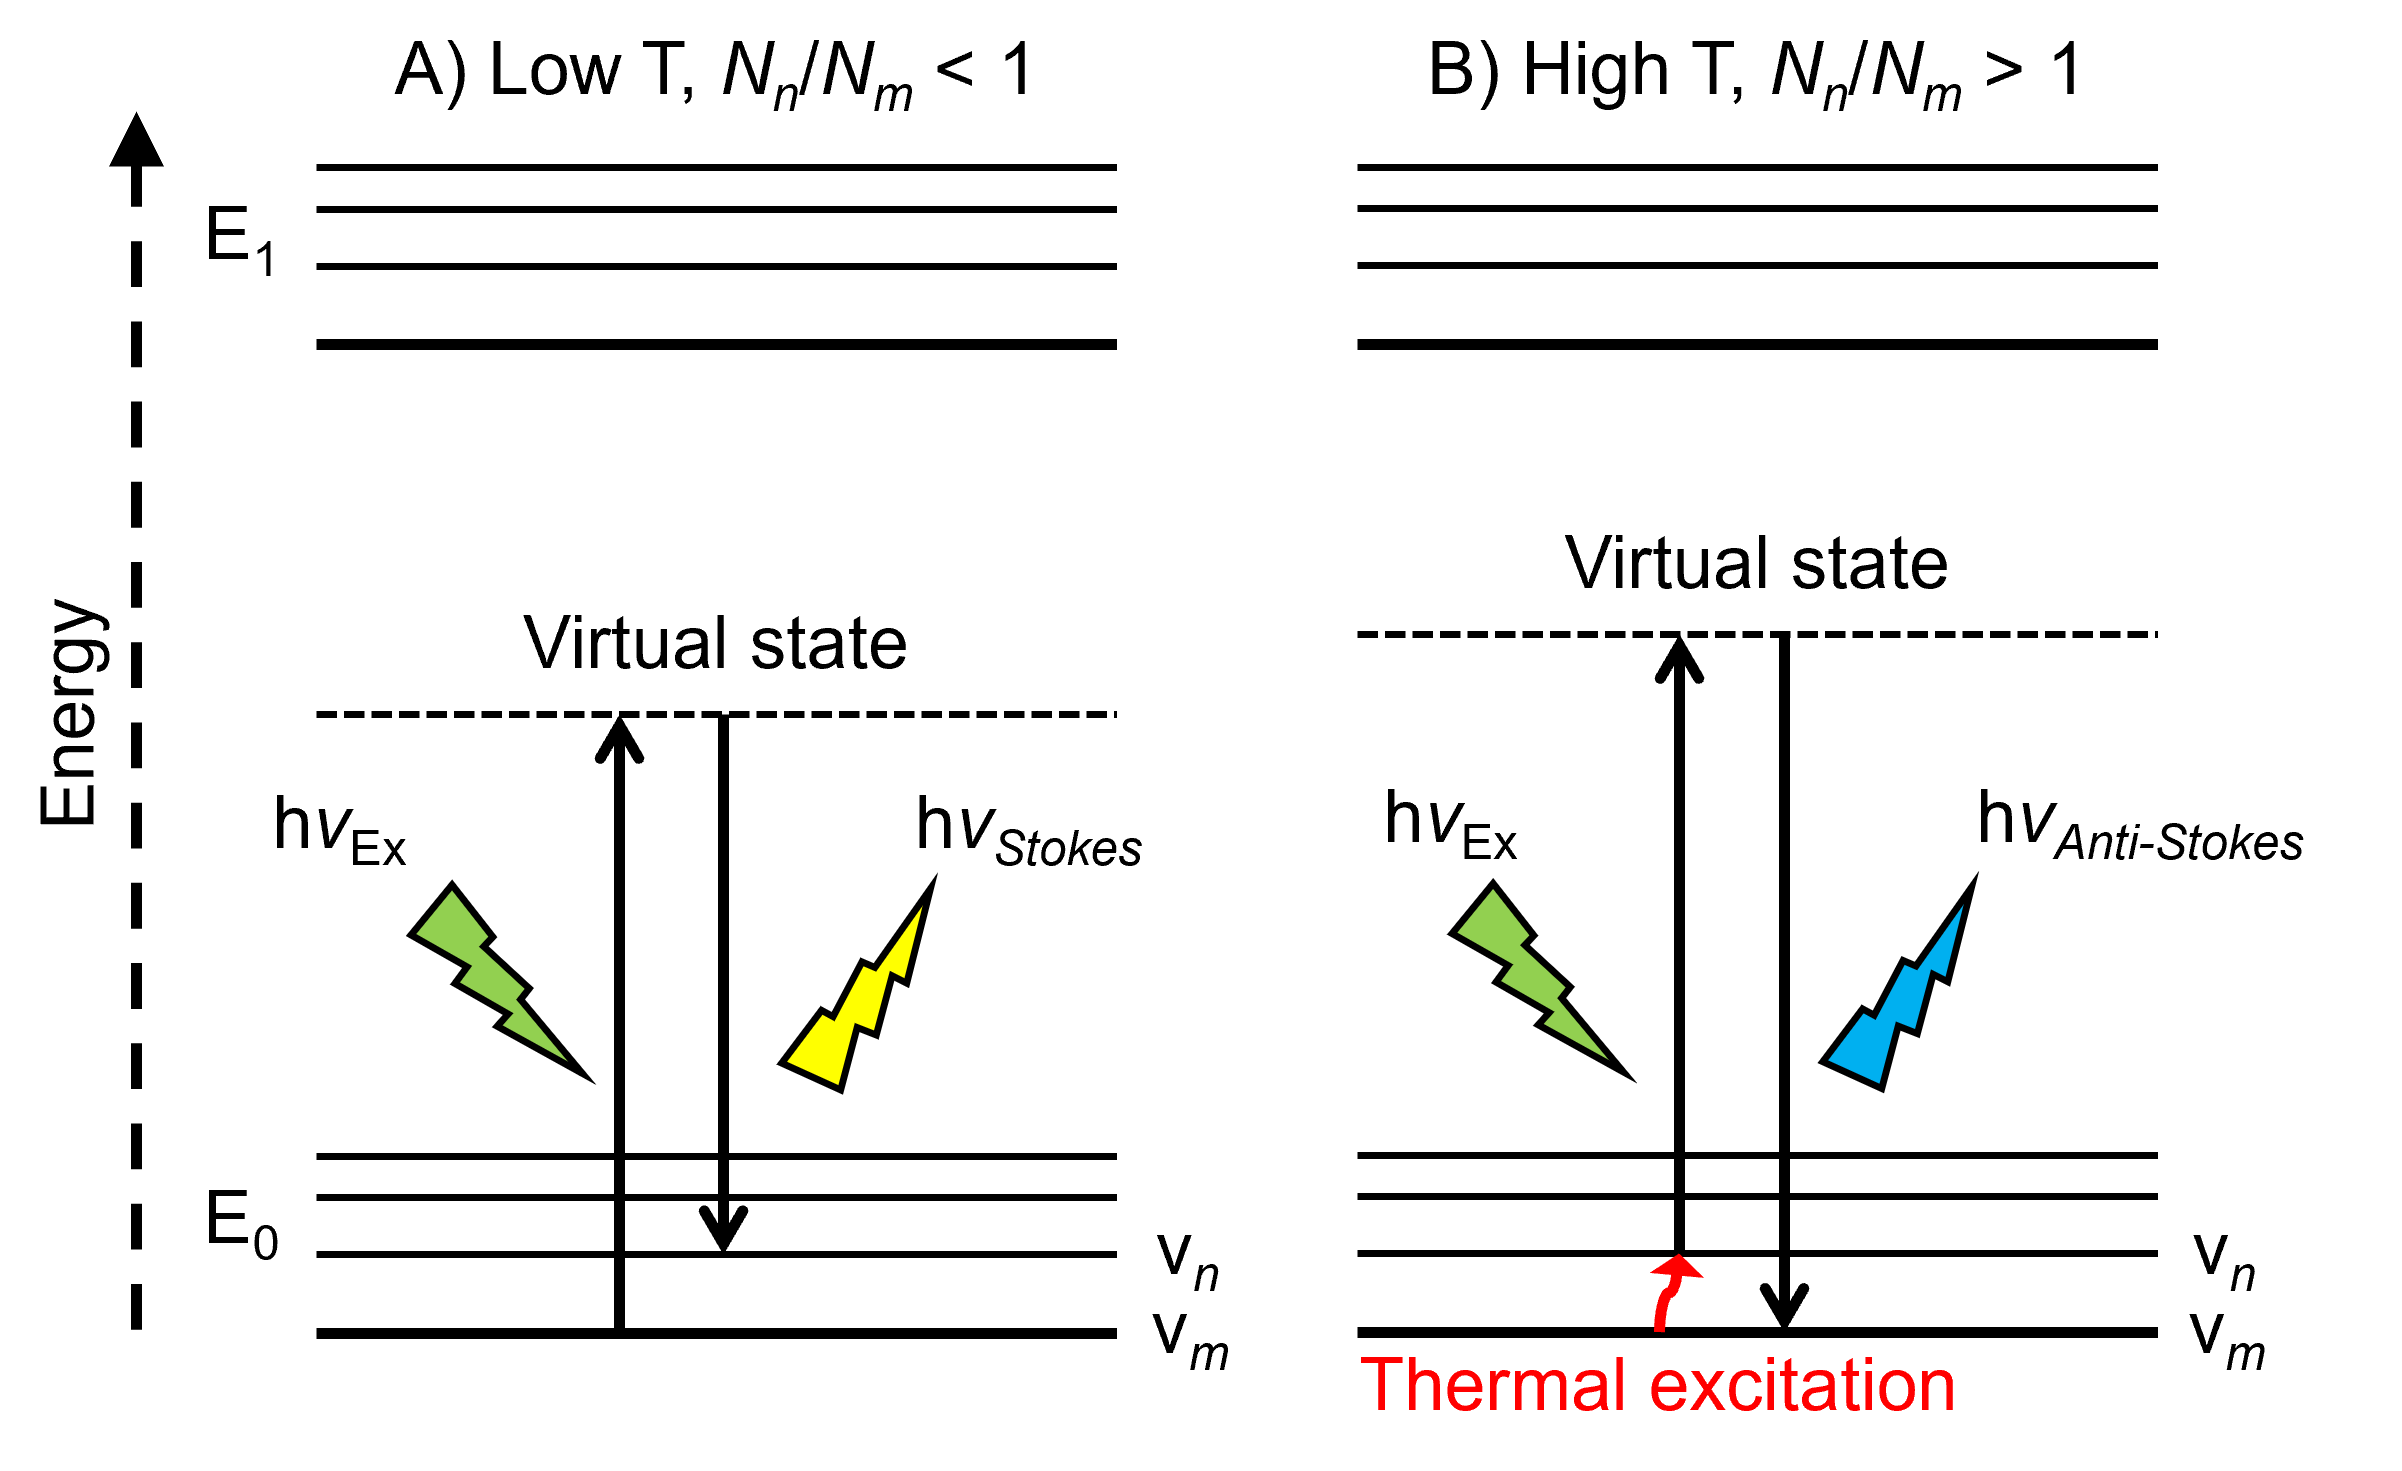
Figure 3. A Jablonski diagram showing the effect of (A) low and (B) high temperature on the population of ground and vibrational states, and the resulting Stokes and anti-Stokes Raman scattering intensity.
Tracking the ratio of anti-Stokes to Stokes scattering with increasing temperature for the same band is a potential method for determining the temperature of a sample. It requires the use of a notch filter in the microscope, in order to detect both Stokes and Anti-Stokes signals.4 In this work, the RM5 microscope used was equipped with an edge filter, which does not allow for anti-Stokes Raman scattering to be observed but enables lower-wavenumber detection than a notch filter. However, this is not the only method for determining the temperature of a sample with Raman microscopy.
The position of the LO phonon band changes with increasing temperature because of thermal expansion, which causes Si-Si bond lengths within the crystalline lattice to increase. The lengthening of the bond away from its equilibrium position decreases the energy of the bond. This leads to a decrease in the Raman shift of the LO phonon mode because it is proportional to the bonding energy within the lattice.5 This is why we observe the Raman shift of the LO phonon mode gradually decreasing between 173 K and 473 K. This phenomenon is only useful for temperature prediction if a quantitative relationship exists.
Figure 4 shows the peak position of the LO phonon mode plotted against the temperature. A strong linear relationship is observed between the two variables (R² = 0.9972). In a controlled environment with a defect-free, strain-free Si sample, the LO phonon band position can serve as a potential temperature indicator using simple linear regression. This level of accuracy is possible because of the extremely high spectral resolution achieved when using a 532 nm laser with a 2400 gr/mm diffraction grating.
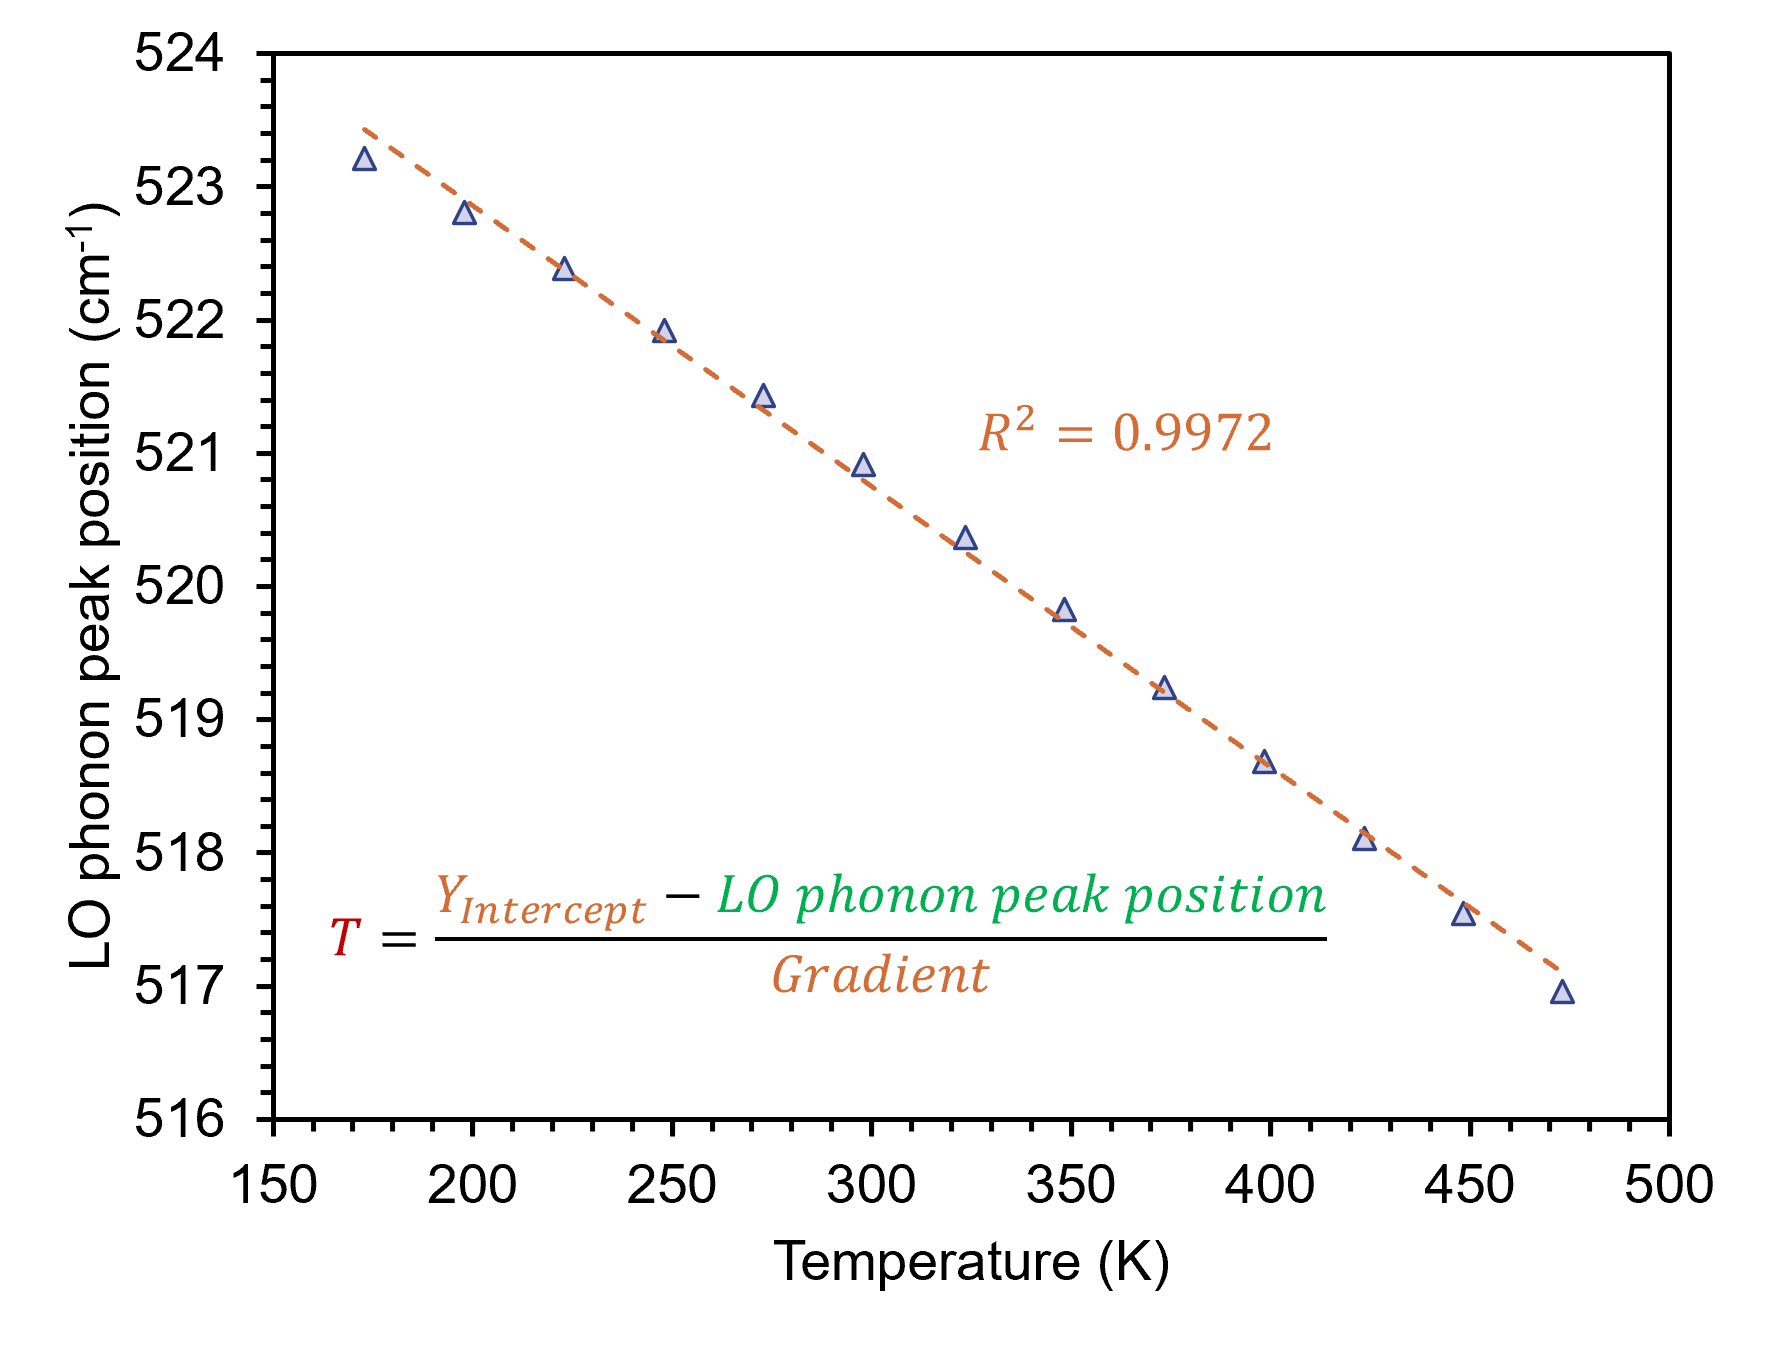
Figure 4. A plot showing the LO phonon peak position for an n-doped Si chip against temperature. The linear regression reveals a strong correlation between the two variables.
TD Raman microscopy is a powerful tool for probing the thermal and electronic properties of semiconductors. By monitoring the LO phonon mode in an n-doped Si chip from 173 K to 473 K, we demonstrated the ability to determine its temperature non-invasively.