Bismuth vanadate (BiVO₄) is an efficient photocatalyst for solar fuel generation, particularly hydrogen production through photoelectrochemical (PEC) water splitting. In a PEC cell, BiVO₄ absorbs sunlight and drives water oxidation to produce oxygen, enabling hydrogen to be harvested at the counter electrode (Figure 1).

Figure 1. Photoelectrochemical water splitting with BiVO4.
A key advantage of BiVO₄ is its visible-range band gap, approximately 2.4 eV, which enables absorption of light up to 520 nm. This absorption range is significantly broader than that of materials such as TiO₂, which are limited to the UV region. Combined with its chemical stability, abundance, and low cost, these properties make BiVO₄ a leading candidate for solar fuel applications.
However, the performance of BiVO4 can be limited by poor electron mobility, slow charge transport, and surface recombination of photogenerated holes. This can be overcome with strategies such as morphology control, doping, composite formation, and coupling with oxygen evolution catalysts (e.g., cobalt phosphate, FeOOH, NiOOH) to enhance charge separation and water oxidation kinetics.
To guide these improvements, detailed material characterisation is essential. Raman spectroscopy provides unique insights into BiVO₄ because it is highly sensitive to crystal structure, local bonding, and phase purity. It can distinguish between polymorphs (monoclinic scheelite, tetragonal scheelite, and zircon), with the monoclinic scheelite phase being the most photoactive. Raman analysis also reveals crystallinity, lattice defects, and interactions with co-catalysts or reaction intermediates under operating conditions.
We demonstrate how the high-resolution mapping capabilities of the Edinburgh Instruments RM5 Confocal Raman Microscope are essential for identifying performance-limiting heterogeneity in BiVO₄ crystals.
BiVO4 was synthesised by researchers from the Federal University of Uberlândia and Federal University of Goiás, Brazil. The BiVO4 crystals were deposited onto fluorine-doped tin oxide (FTO) substrates for analysis.
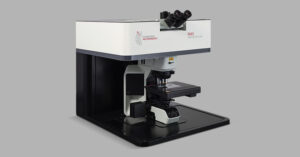
Raman measurements were performed using an RM5 Confocal Raman Microscope equipped with a 532 nm Nd:YAG laser, a 1200 gr/mm grating and a 100x/0.90 objective lens (Figure 2). A 2D Raman map of the sample was collected with 1 μm resolution to visualise structural variations across the crystal surface.

Figure 2. Edinburgh Instruments RM5 Confocal Raman Microscope.
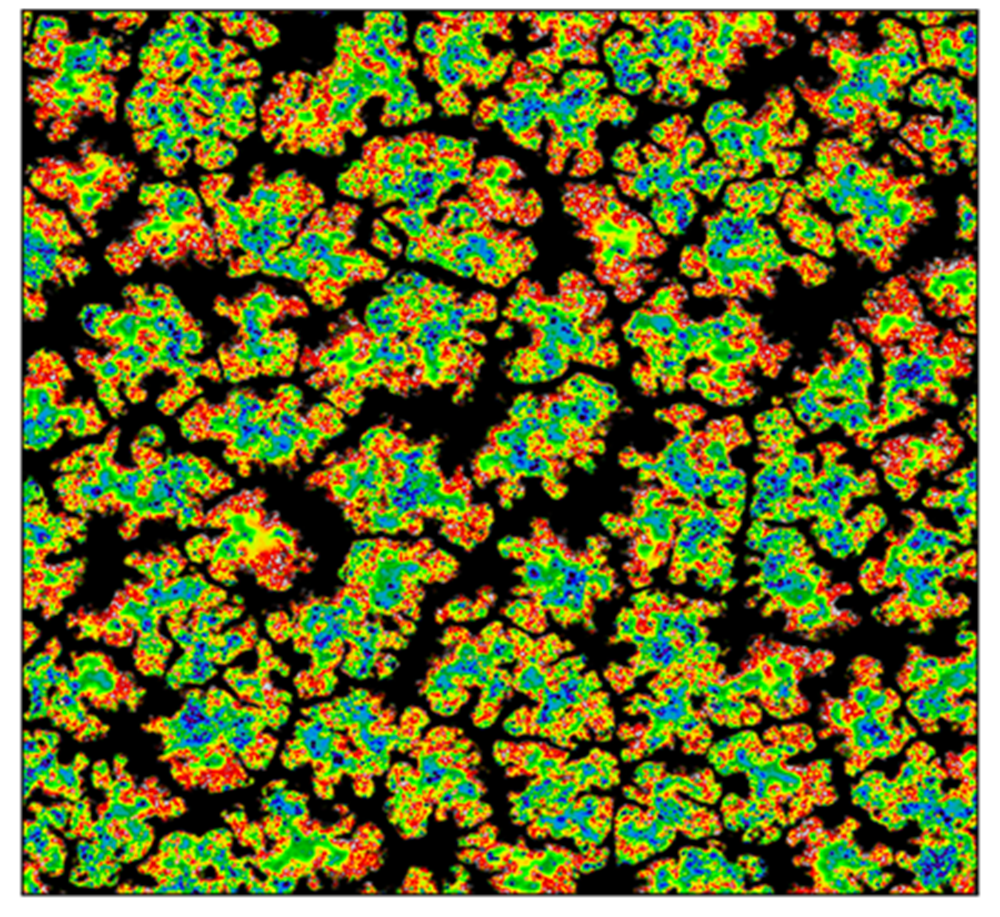
A Raman map of the BiVO4 sample was collected, focusing on the intensity of the characteristic band at 828 cm-1 which can be assigned to the symmetric stretching modes of the V-O bonds within the tetrahedra (Figure 3).
Raman bands were observed at 129, 212, 334, 371, 716 and 828 cm-1 (Figure 3A), which are the typical vibrational bands of BiVO4.1, 2 These correspond to the lattice modes and internal vibrations of the VO₄ tetrahedra, including external modes, bending modes, and antisymmetric and symmetric V-O stretching modes.
The lower bands at 129 and 212 cm-1 are attributed to lattice modes involving the rotation and translation of the [VO4] tetrahedra. The bands between 334 and 371 cm-1 correspond to the symmetric and antisymmetric bending vibrations of the V-O bonds. Finally, the weaker shoulder at 716 cm-1 and the most dominant peak at 828 cm-1 are assigned to the antisymmetric and symmetric stretching modes of the V-O bonds within the tetrahedra.
The Raman intensity varied across the map, with regions of higher intensity located near the centres of the crystal structures (Figure 3B). This variation may result from differences in crystal thickness, with thicker regions at the centre exhibiting stronger Raman signals.

Figure 3. Raman map of BiVO4 crystals. A) Example Raman spectrum of BiVO4, B) Intensity map of band at 828 cm-1. Measurement parameters: 532 nm laser, 100x objective, 5% laser power, 2mm pinhole, 50 μm slit, 1200 gr/mm grating, 0.01 s exposure time, 1 μm step.
The peak position of the dominant Raman signal at approximately 828 cm⁻¹ was observed to vary slightly across the sample. To investigate this, a peak position map was generated (Figure 4A), and representative spectra from two points were compared (Figure 4B).

Figure 4. Peak position of symmetric stretching mode of VO4 between 824-834 cm-1. A) Peak position map of BiVO4. B) Example spectra from two points of map (Inset: Peak position change).
The symmetric stretching mode of the VO₄ tetrahedra was found to shift between 826 and 834 cm-1. This variation is characteristic of subtle changes in V–O bond length and local strain within the crystal lattice.1
Such information is invaluable to correlate the structural heterogeneity of materials with their photocatalytic performance. Using Raman to spatially resolve these defects makes it an essential tool for optimising BiVO4 synthesis and enhancing photocatalytic performance.
BiVO₄ is a promising photoanode for solar fuel production but realising its potential demands structural uniformity to mitigate charge recombination. Raman spectroscopy is crucial for verifying the active monoclinic phase, detecting defects, and understanding structure–performance relationships.
The RM5 Confocal Raman Microscope provides powerful analytical capabilities for solar fuel research, enabling detailed characterisation of photocatalysts like BiVO₄ to uncover structure-performance relationships.
We would like to thank Dr Antonio Otavio Patrocinio and Dr Pablo José Gonçalves from the Federal University of Uberlândia and Federal University of Goiás, Brazil, for providing the BiVO4 sample used in this Application Note.