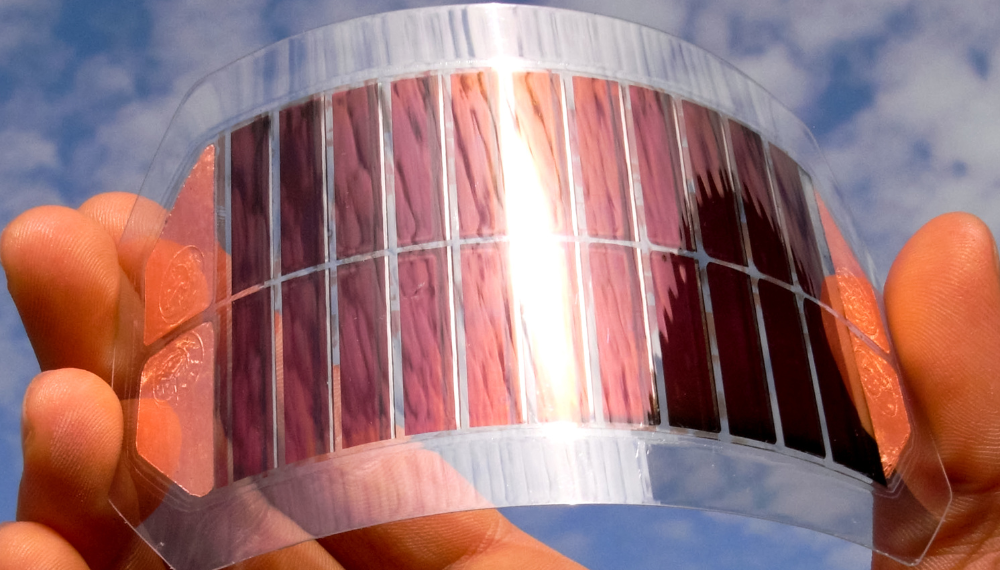
Organic solar cells (OSCs) are an alternative to silicon that use organic materials such as polymers to generate electricity. OSCs have lower environmental impact, are typically lightweight, and can be designed with high bending stability and conformability, making them highly versatile.1
However, OSCs currently have lower efficiency rates and stability when compared to silicon cells, and continued research and development are needed to make OSCs a viable, widespread technology for harnessing solar energy.
One method for the analysis of photovoltaic technologies is Raman spectroscopy. It has exceptionally high chemical specificity and can be used to obtain information about the various power efficiency-influencing properties of silicon, cadmium telluride, perovskite, III-V semiconductor, quantum dot, and organic cells.2 When combined with confocal microscopy, it is possible to obtain micron-resolution Raman images that can reveal how the properties of a material vary across a cell.
Furthermore, Raman microscopes can be configured for photoluminescence (PL) imaging, which is an industry standard for photovoltaic quality control. By adding the photocurrent imaging upgrade to the RM5 Raman Microscope, the change in Raman and PL properties across the cell surface can be directly correlated to cell performance.
This Application Note demonstrates Raman, PL, and photocurrent imaging of the same area on an OSC using an Edinburgh Instruments RM5 Confocal Raman Microscope. This correlative spectral and photocurrent imaging methodology is a powerful tool in the photovoltaic industry because it allows for an enhanced understanding of the properties of solar cells.
The OSC used was prepared by the Energy Engineering and Materials Devices (TEMD) Research Group at London South Bank University. A representative structure of the fabricated device is illustrated in Figure 1. The anode consists of a transparent indium tin oxide (ITO) electrode, while the anode interlayer comprises a blend of poly(3,4-ethylenedioxythiophene) and polystyrene sulfonate (PEDOT:PSS). The active layer is formed from a mixture of the donor polymer PM6 and the non-fullerene acceptor molecule Y6. The cathode interlayer features an aliphatic amine-functionalized perylene diimide (PDINN), and the cathode is silver.3 Two anodes and four cathodes intersected on the active layer of the structure to create eight OSC pixels.
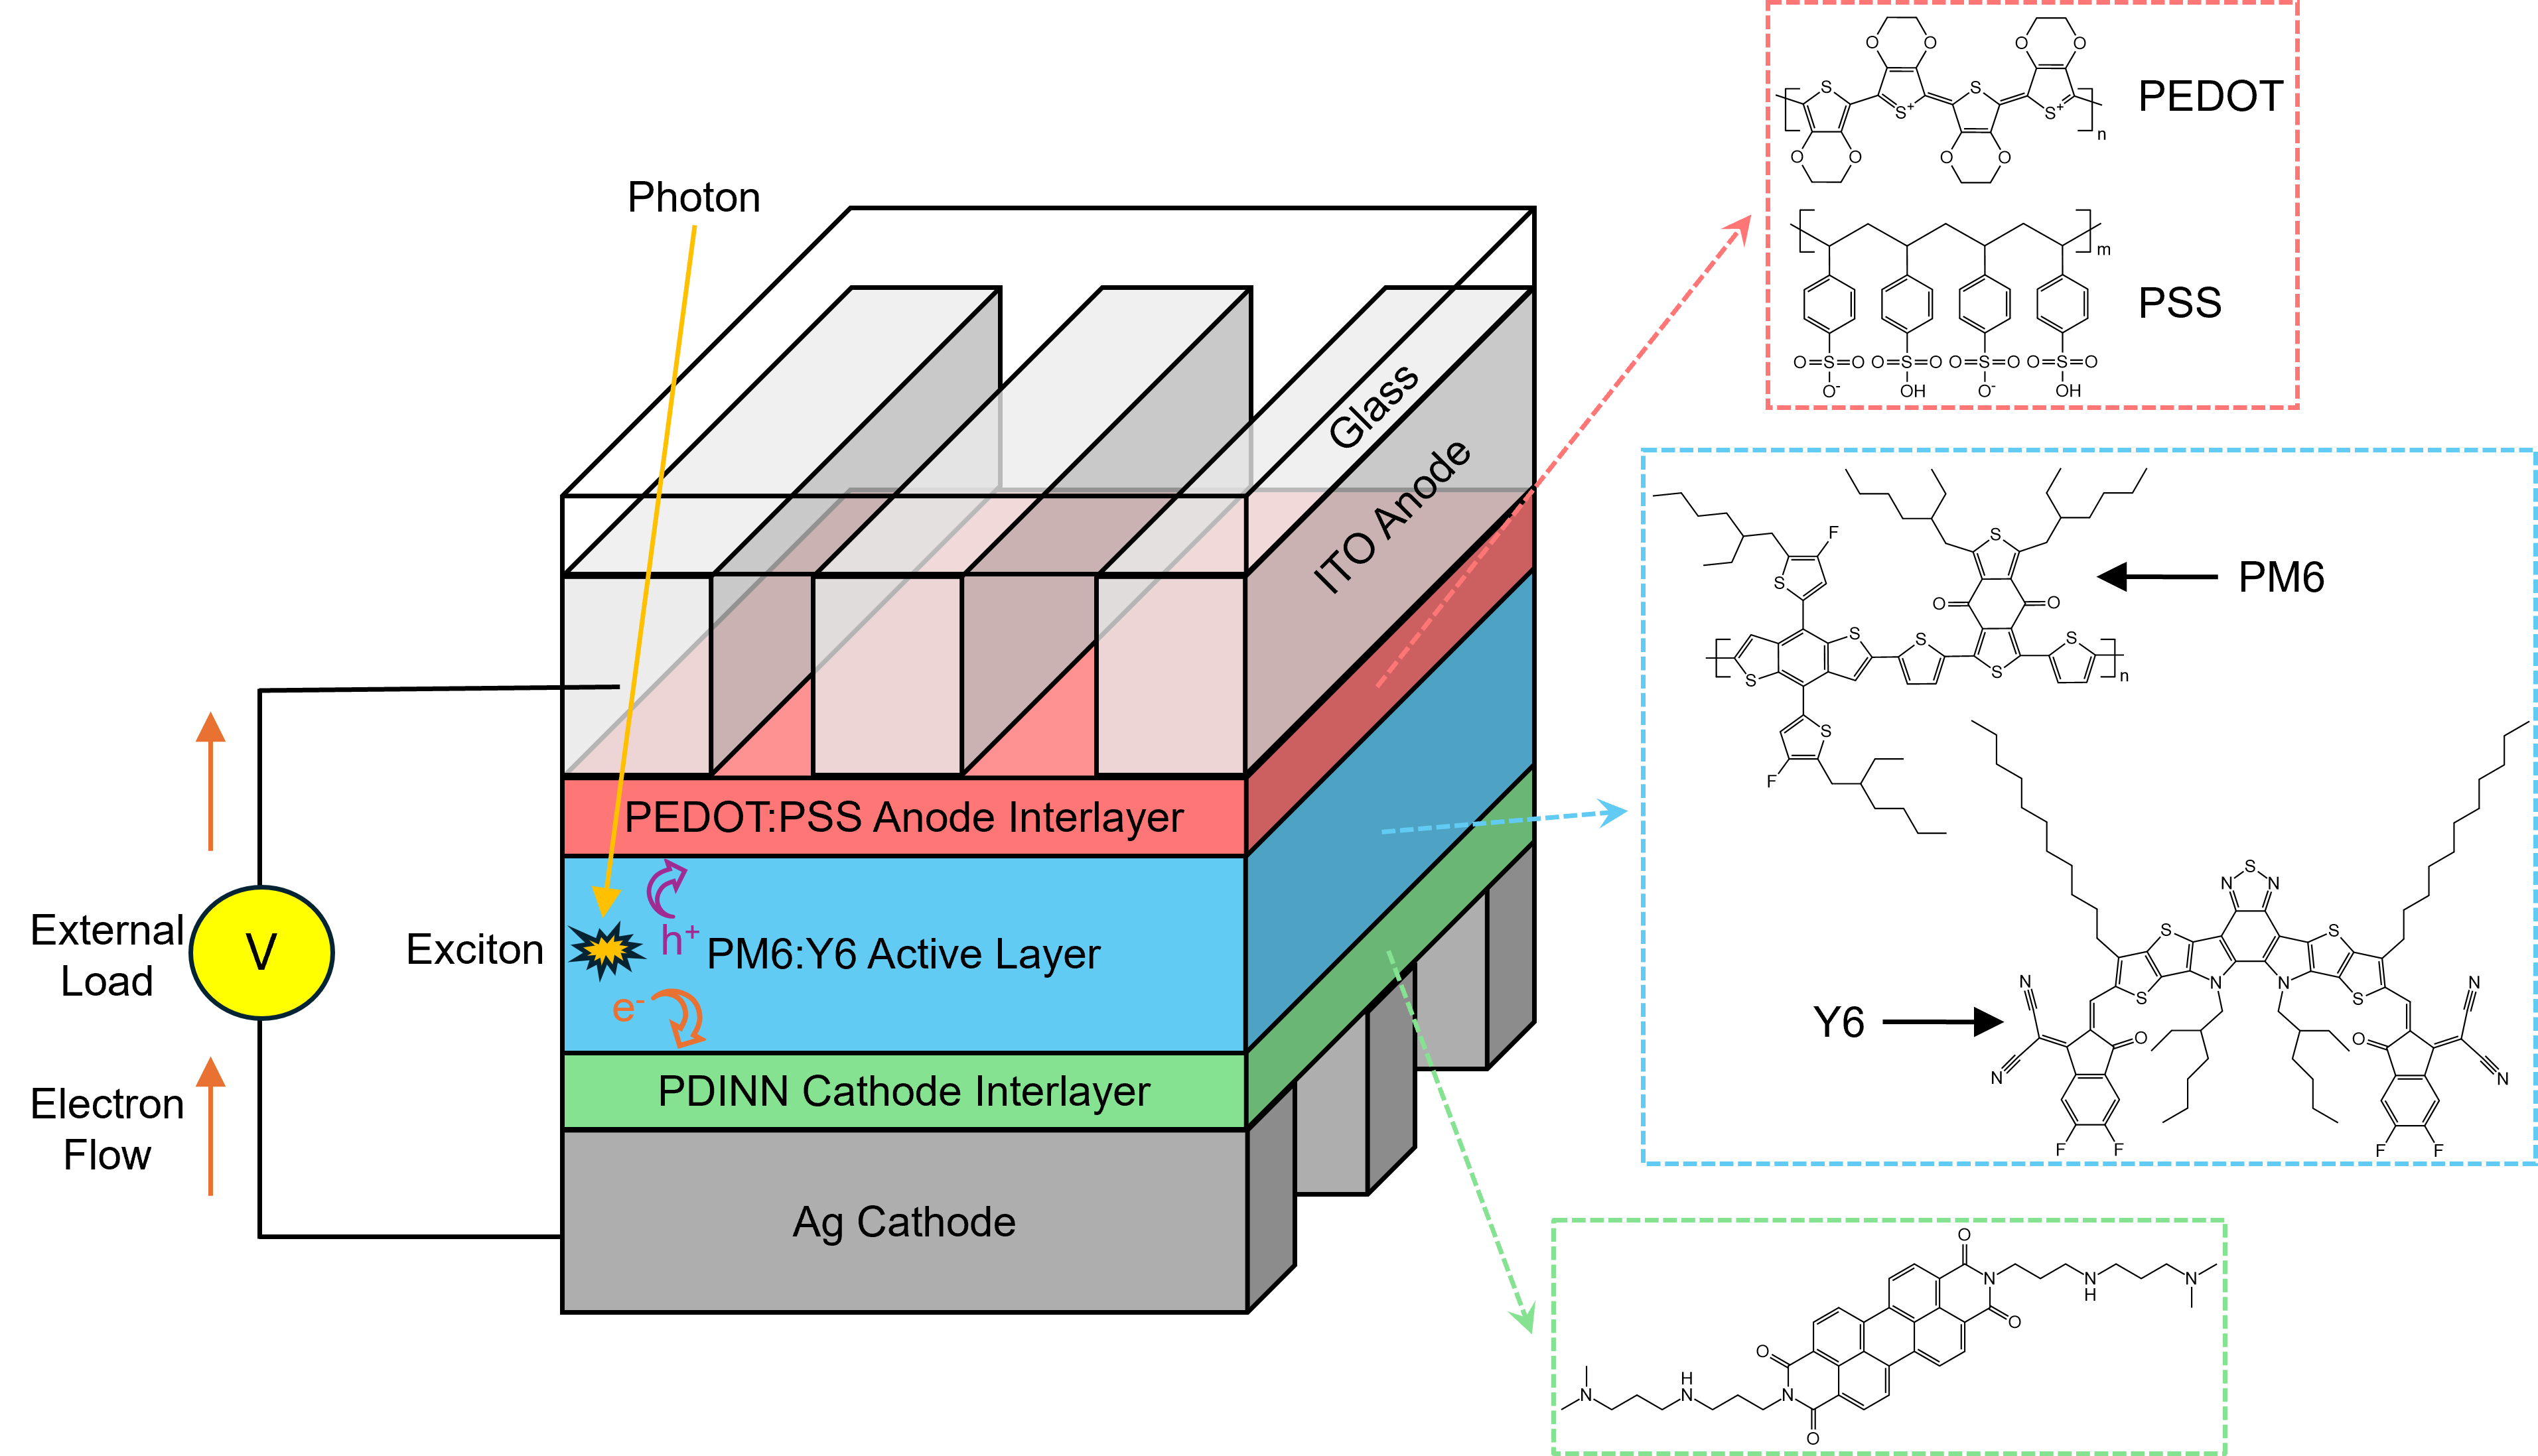
Figure 1. The structure of the organic solar cell used in this Application Note.
The OSC was mounted onto the motorised stage of the RM5, which is shown in Figure 2. Raman mapping was performed using a 532 nm laser and an 1800 gr/mm diffraction grating. The 532 nm laser was used with a 300 gr/mm diffraction grating for PL mapping over the same area. The photocurrent response from the OSC was measured using a transimpedance amplifier and an analogue-to-digital converter.
Figure 2. Edinburgh Instruments RM5 Confocal Raman Microscope.
The OSC was first imaged using reflected brightfield microscopy, Figure 3. In this image, the ITO anode runs horizontally, and the three Ag cathodes are arranged vertically. The locations of three pixels at the overlap of the anode and cathode are shown in red squares.
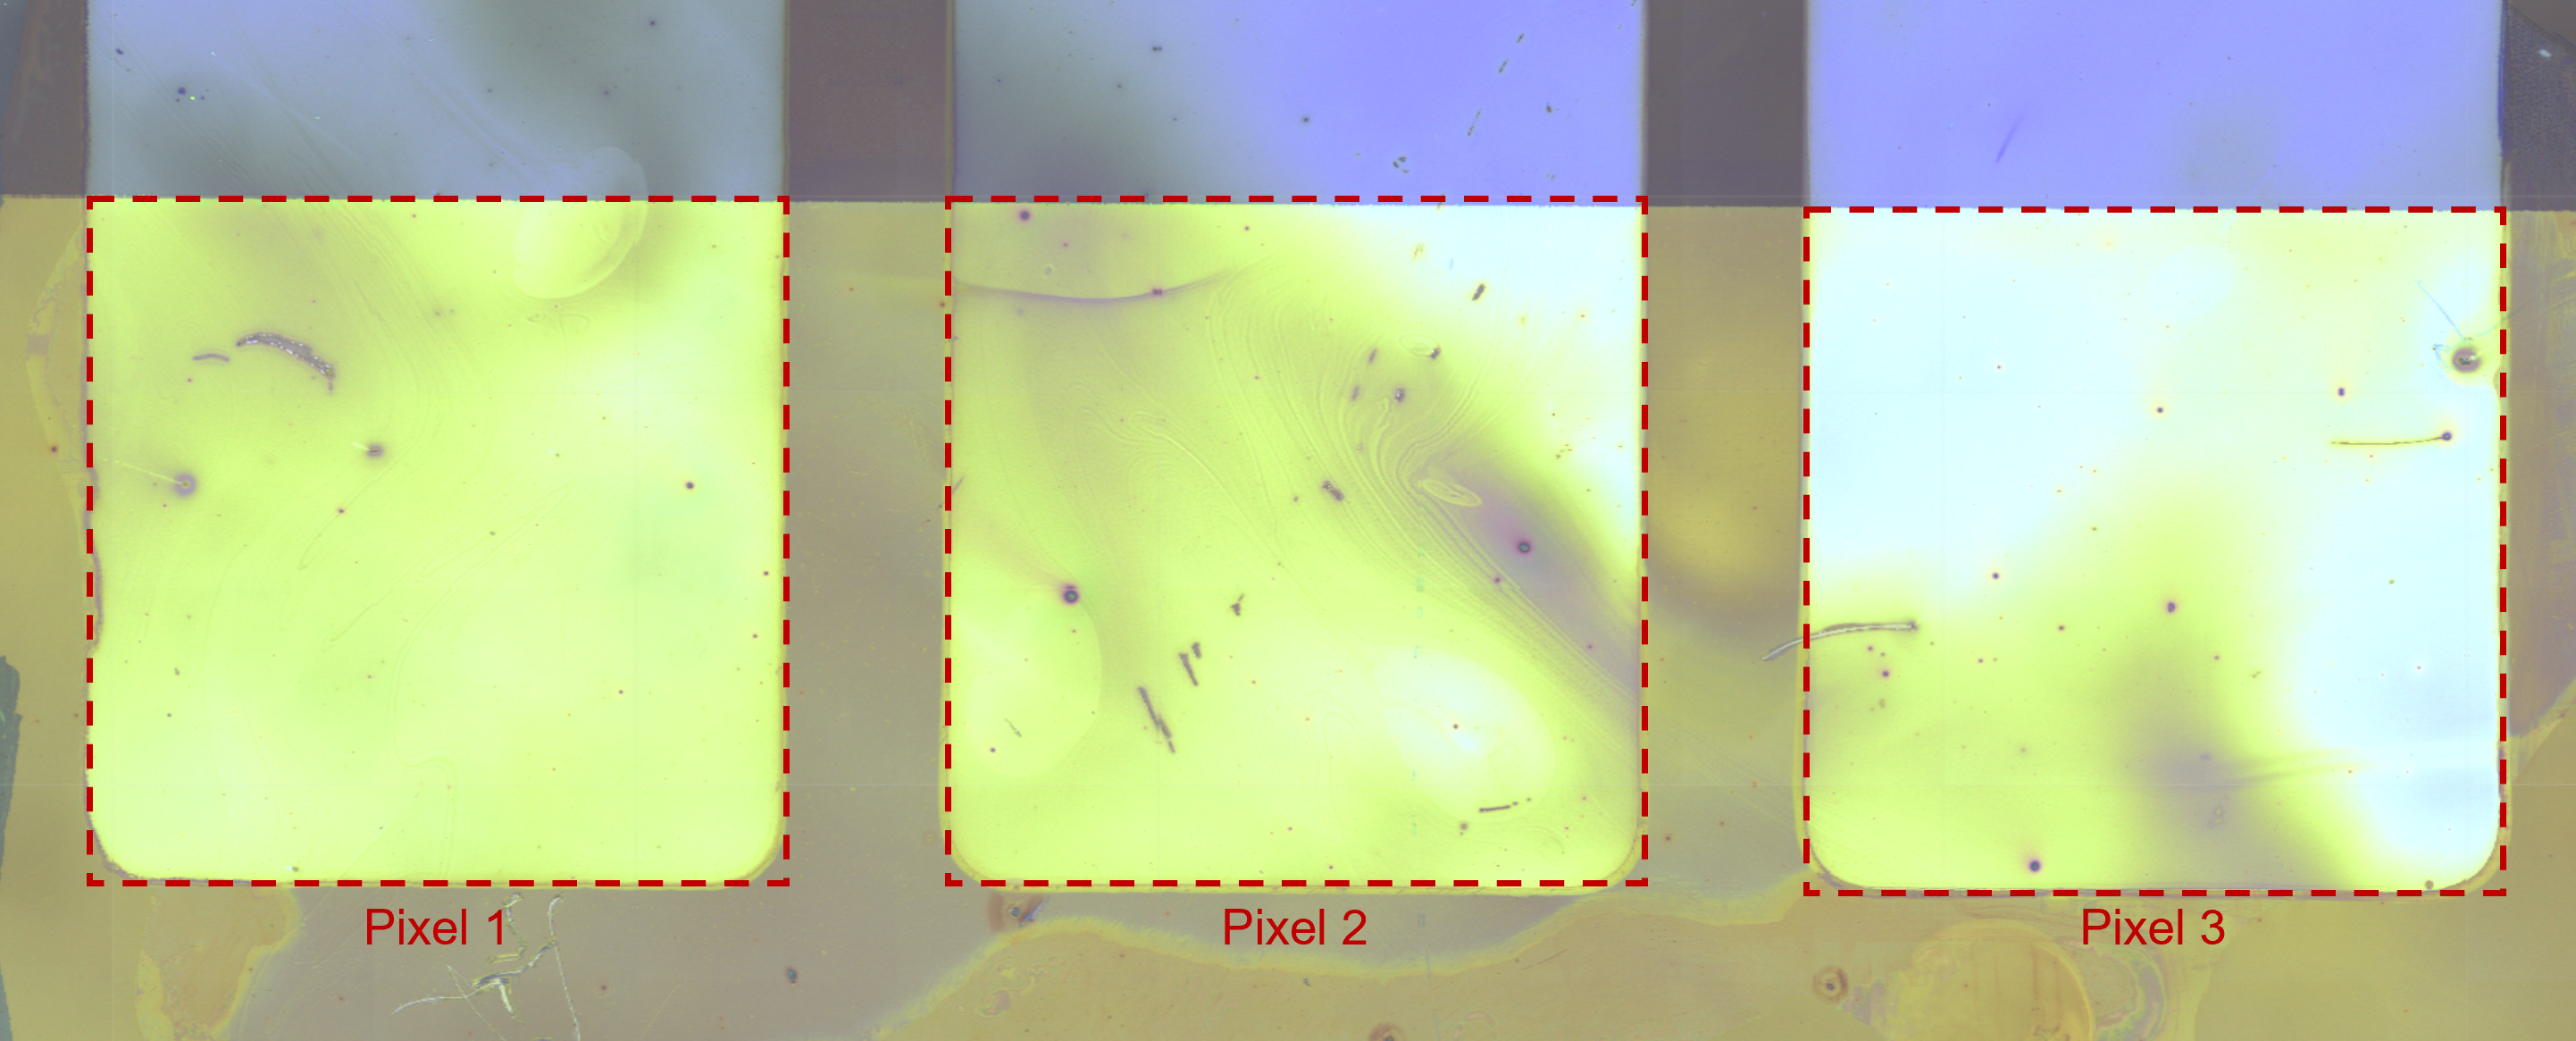
Figure 3. Reflected brightfield image of the OSC with the locations of pixels shown.
The OSC was then imaged using the correlative Raman and photocurrent technique, whereby Raman spectra and photocurrent were recorded simultaneously during the mapping procedure. The resulting photocurrent and Raman intensity images are shown in Figures 4a and b.
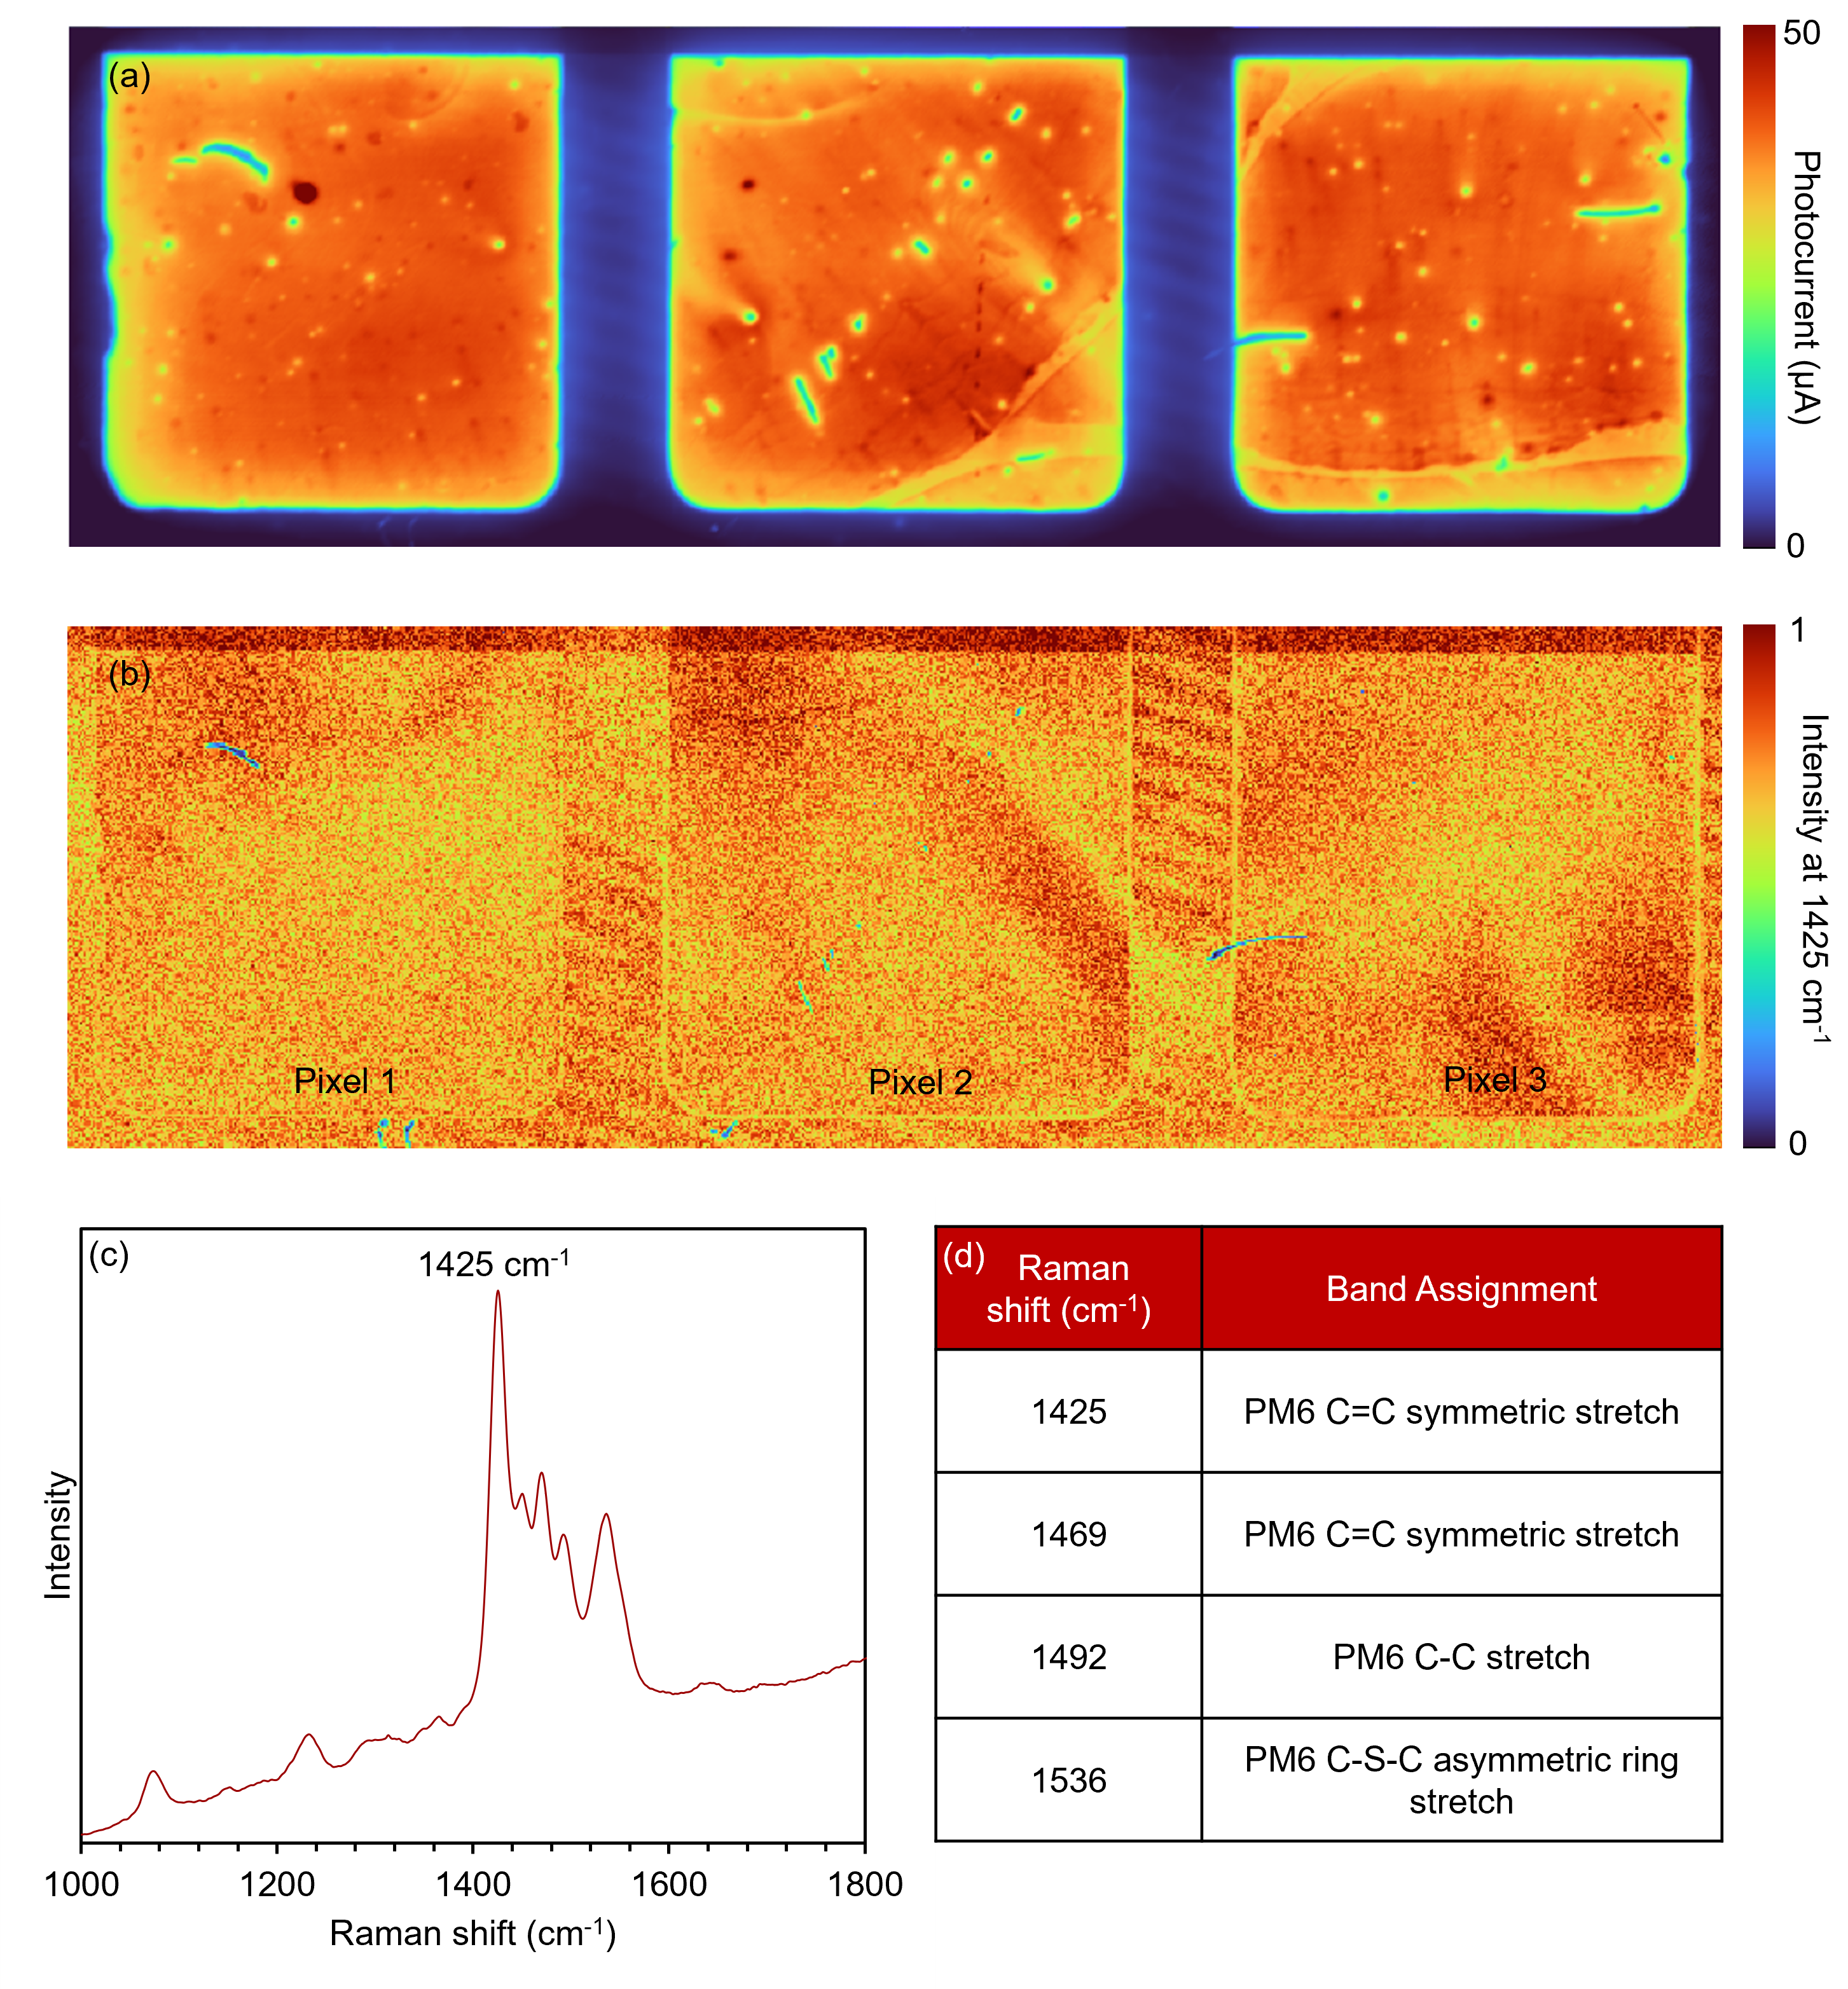
Figure 4. (a) Photocurrent and (b) Raman imaging of the OSC. (c) Representative Raman spectrum recorded from the OSC and (d) peak assignment table for the Raman spectrum.
The photocurrent image in Figure 4a shows that photocurrent is generated within the three pixels where the ITO and Ag cathodes intersect, and the Raman image in Figure 4b contains information about the chemical structure of the OSC. The Raman spectra recorded across the image were dominated by bands
at 1425 cm-1, 1469 cm-1, 1492 cm-1, and 1536 cm-1. These bands are typical of the PM6 polymer in the active layer and can be assigned as C=C asymmetric stretching, C=C symmetric stretching, C-C stretching, and C-S-C asymmetric ring stretching, respectively, as shown in Figure 4d.4,5 Variations in Raman intensity were attributed to the changing morphology of PM6 in the PM6:Y6 active layer. Large-scale variations in the Raman intensity, such as the high-intensity large diagonal streak in the middle pixel, were detected. Notably, it was observed that as the Raman intensity increased across the OSC, the photocurrent detected decreased. The small areas with very low Raman or photocurrent intensity are mechanical defects incurred during the OSC fabrication procedure.
Next, the same area on the OSC was mapped using PL spectroscopy, and the resulting image was compared with the photocurrent image, Figures 5a and b. PL spectroscopy is an essential technique in the optimisation of solar cells because it allows for the bandgap of the active layer to be probed, and it is proportional to the number of charge carriers. For PL to occur in the OSC, the photogenerated electrons and holes in the active layer must recombine. The extraction of charge carriers, or the transfer of electrons and holes into the adjacent layers, will inhibit radiative electron-hole recombination within the active layer and decrease the PL response. Therefore, the method can be used to research charge extraction efficiency.
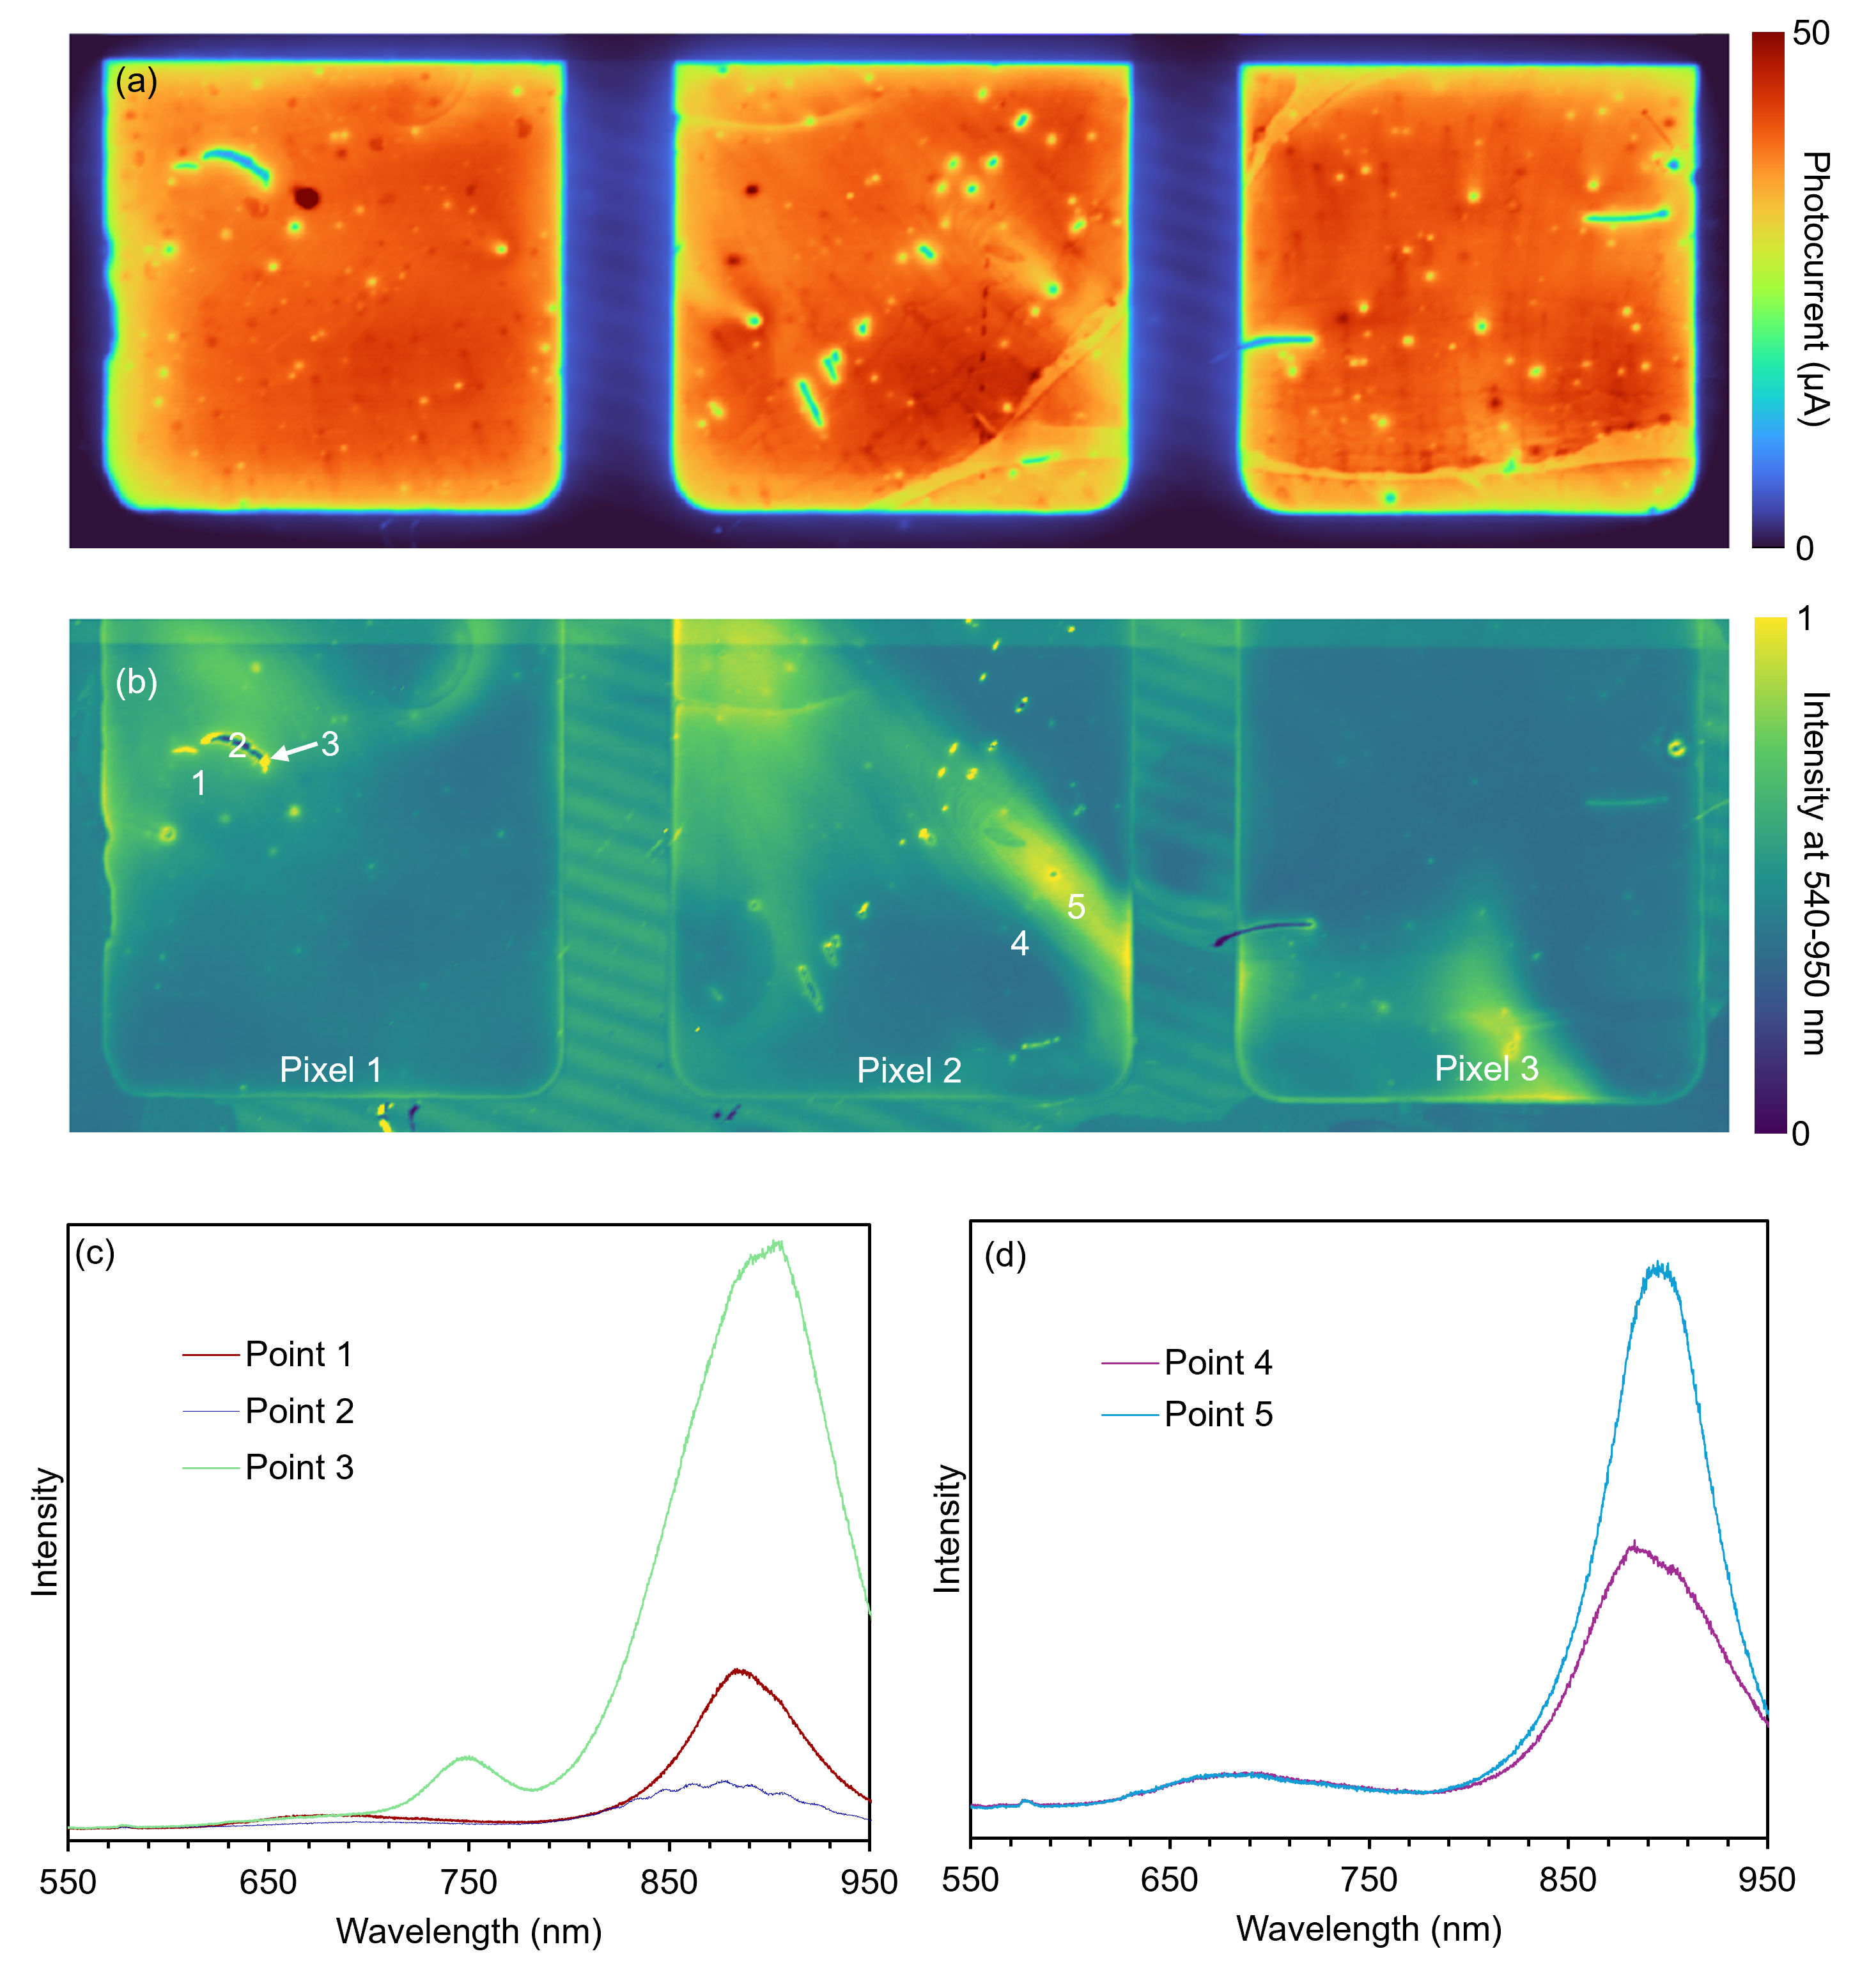
Figure 5. (a) Photocurrent and (b) PL imaging of the OSC. PL spectra from (a) Pixel 1 and (b) Pixel 2.
The PL image in Figure 5b indicates a significant degree of variation in intensity and, therefore, charge extraction efficiency across the cell. The spectra in Figure 5c were extracted from around the mechanical defect. The red PL spectrum extracted from point 1 shows bands at 677 nm and 883 nm, which can be assigned to electron-hole recombination within the PM6 donor and Y6 acceptor, respectively.6,7 The PL intensity is decreased within the mechanical defect (point 2). At the border of the defect, the PL intensity is increased, indicating poor charge extraction around the defect.
Spectra from Pixel 2 show regions where the photocurrent differs, but no defects are visible in the reflected brightfield image. The PL response at point 4 was lower than at point 5, and the photocurrent generated was larger, indicating less efficient charge extraction at point 5. The Raman data from the same points indicated that at point 5, the active layer morphology was different than at point 4. Also, the spectral profiles at points 4 and 5 differ significantly. At point 5, the ratio between the PM6 and Y6 bands is larger than at point 4, indicating that the mixing of the two materials is different. Phase separation of the donor and acceptor OSCs is crucial to improve exciton dissociation and charge transport efficiency.8 The combined Raman, PL and photocurrent data indicates that a less well-mixed active layer deposited in the OSC results in poorer charge extraction and lower photocurrent.
This Application Note highlights the power of correlative Raman, PL, and photocurrent imaging in the analysis of solar cells. Combining these techniques makes it possible to obtain information about the optical, structural, and electronic properties of organic photovoltaic devices. The three techniques revealed that variations in chemical composition and donor and acceptor phase separation led to variations in charge extraction efficiency across the device. Using this correlative imaging approach, the factors limiting efficiency can be investigated in solar cells, facilitating the development of more advanced solar energy technologies.
We would like to thank Bahattin Bademci and Dr Tariq Sajjad from the TEMD Research Group at London South Bank University for providing the OSC used in this Application Note.
1. E. K. Solak et al., RSC Adv., 2023, 13, 12244-12269.
2. P. K. Nayak et al., Nat. Rev. Mater., 2019, 4, 269-285.
3. Q. Guo et al., Mater. Chem. Front., 2021, 5, 3257-3280.
4. Z. Fu et al., Adv. Mater., 2024, 36, 2313532.
5. M. Hong et al., ACS Appl. Mater. Inter., 2023, 15, 20151-20158.
6. M. L. Keshtov et al., Energy Technol., 2023, 11, 2201211.