Skip to content
Skip to content
  • News
  • Events
  • eBooks
  • Blog
  • Careers
  • Contact
  • News
  • Events
  • eBooks
  • Blog
  • Careers
  • Contact
KNOWLEDGEBASE
  • About Us
  • Products

    Fluorescence Spectrometers

    • FLS1000 Photoluminescence Spectrometer
    • FS5 Spectrofluorometer
    • LifeSpec II Lifetime Spectrometer
    • Mini-tau Lifetime Spectrometer

    Raman Microscopes

    • RM5 Raman Microscope
    • RMS1000 Multimodal Confocal Microscope

    Transient Absorption

    • LP980 Transient Absorption Spectrometer

    FTIR Spectrometers

    • IR5 FTIR Spectrometer

    Lasers and LEDs

    • Pulsed Lasers
    • Gas Lasers
    • Customisation Options
    View All Products
  • Techniques
  • Applications
KNOWLEDGEBASE
Edit Content
  • About Us
  • Products
  • Techniques
  • Applications
  • Knowledgebase
  • eBooks
  • News
  • Events
  • Blog
  • Careers
  • Contact Us

RESOURCES

FTIR and Raman Spectroscopy for the Analysis of Microplastics

  • May 2, 2025

KEY POINTS

  • Procedures for understanding the chemical composition and size distribution of environmental microplastic samples are vital in the fight against pollution.
  • FTIR spectroscopy allows for simple and fast bulk measurement of players within a sample with high sensitivity and is excellent for chemical identification.
  • Using both IR and Raman can allow for the composition and distribution of microplastic samples to be studied.
Edit Content

Introduction 

Widespread microplastic pollution has become increasingly concerning because of the detrimental effects that they can have upon living organisms. They are now considered ubiquitous in the natural environment, and various studies report finding microplastics in food products, human organs, and biofluids.1,2  

In order to obtain accurate data on the distribution of plastics within the natural environment, testing procedures that enable the size distribution and chemical composition of microplastics to be determined are vital. 

Two of the most commonly used techniques in microplastic analysis are FTIR spectroscopy and Raman microscopy. Both methods rapidly provide spectra with high molecular specificity whilst being non-destructive, making them ideal for analysis where sample supply is limited.  

FTIR spectroscopy is best suited for fast bulk measurements to identify the chemical structure of polymers present within a sample. Raman microscopy can build upon the information obtained with FTIR by combining data on the chemical identity and morphological characteristics of each individual particle within the sample. 

This Application Note demonstrates how both bulk and in-depth analysis can be performed on mixed microplastic samples using the IR5 FTIR Spectrometer and the RM5 Raman Microscope.  


Materials and Methods  

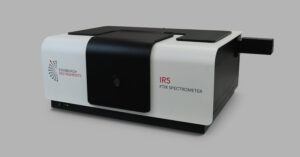
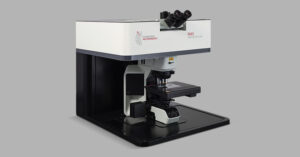
The microplastic sample was made by mixing polyethylene (PE) and polytetrafluoroethylene (PTFE) powders purchased from Sigma Aldrich. An IR5 fitted with a Germanium ATR crystal was used for FTIR measurements. An RM5 equipped with a 532 nm laser and a 10X objective was used for the Raman analysis performed on the sample. Both instruments are shown in Figure 1. 

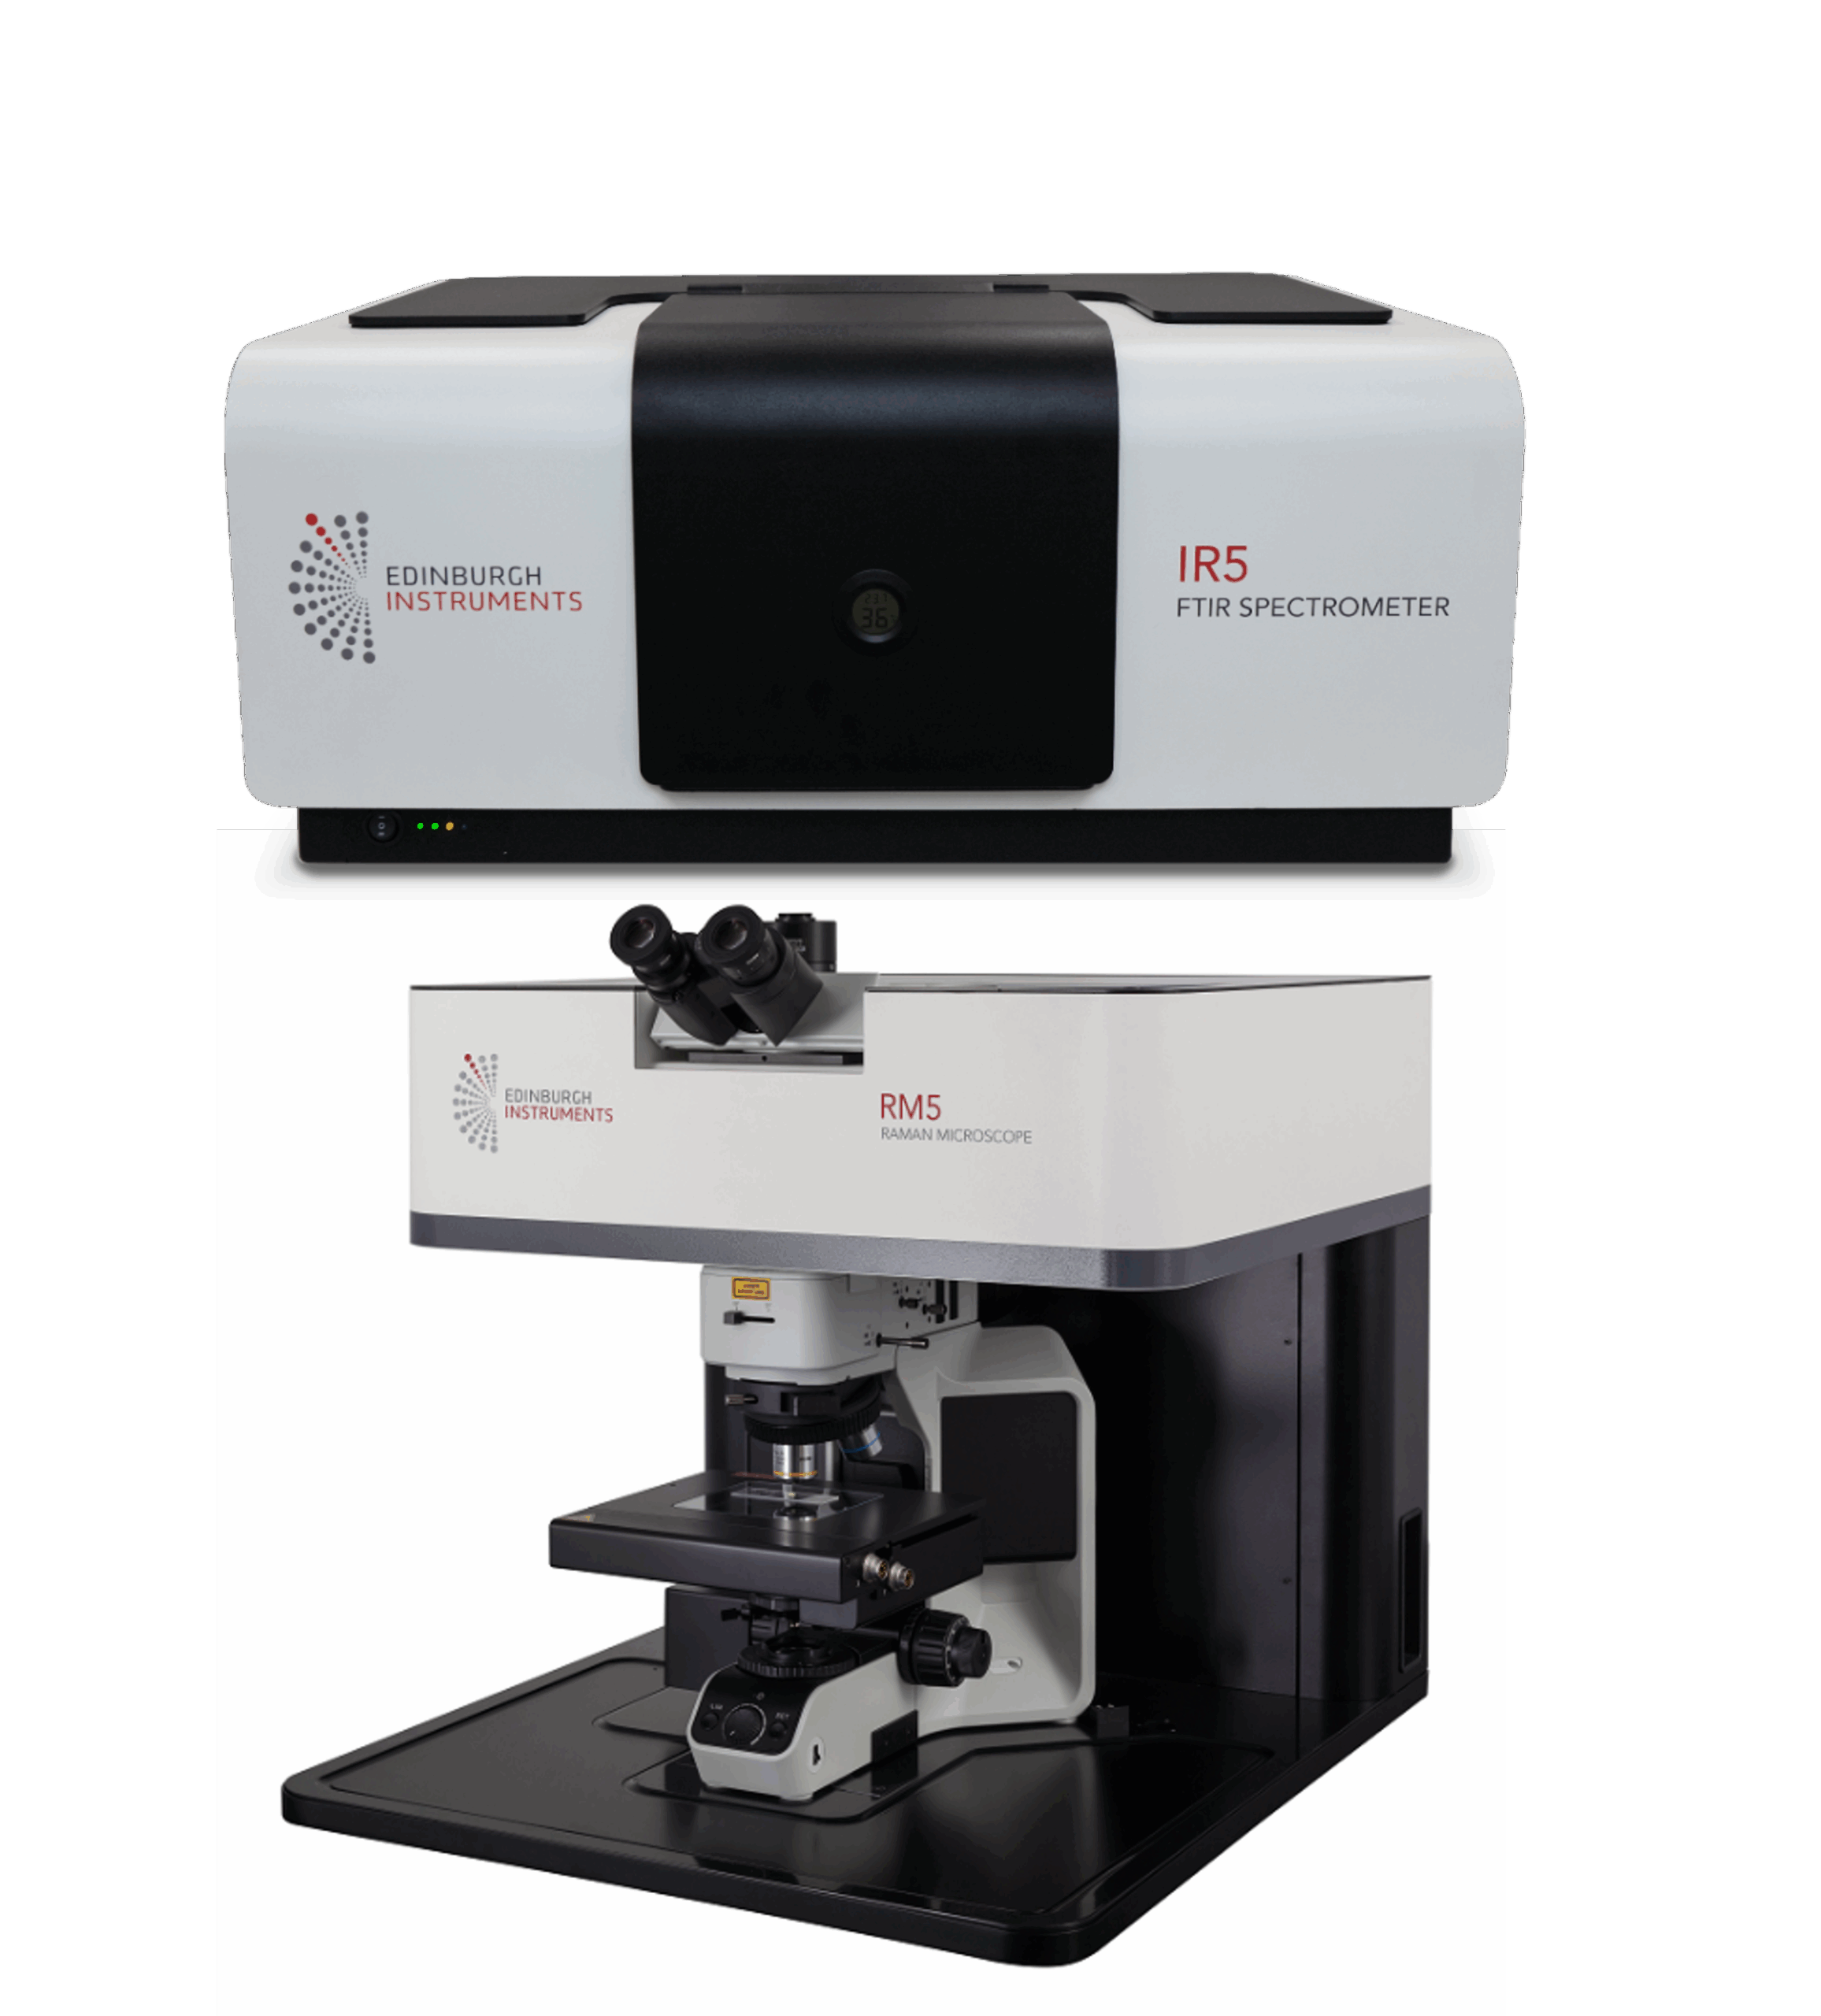
Figure 1: A) IR5 FTIR Spectrometer and B) RM5 Raman Microscope.  


Rapid Bulk Analysis using FTIR Spectroscopy  

To analyse the microplastic mixture by FTIR spectroscopy a mixture of PE and PTFE was placed directly onto the ATR crystal and a spectrum was taken. PE is one of the most commonly used and produced plastics in the world, used in a vast array of products from plastic bags to pipes and medical implants. PTFE, also known by the brand name Teflon, is commonly used in cookware production due to its non-stick properties. Their chemical structures are shown in Figure 2. 

Figure 2: Chemical structure of PE and PTFE 


Figure 3 shows the spectrum of the sample along with the spectra of pure PE and PTFE.  

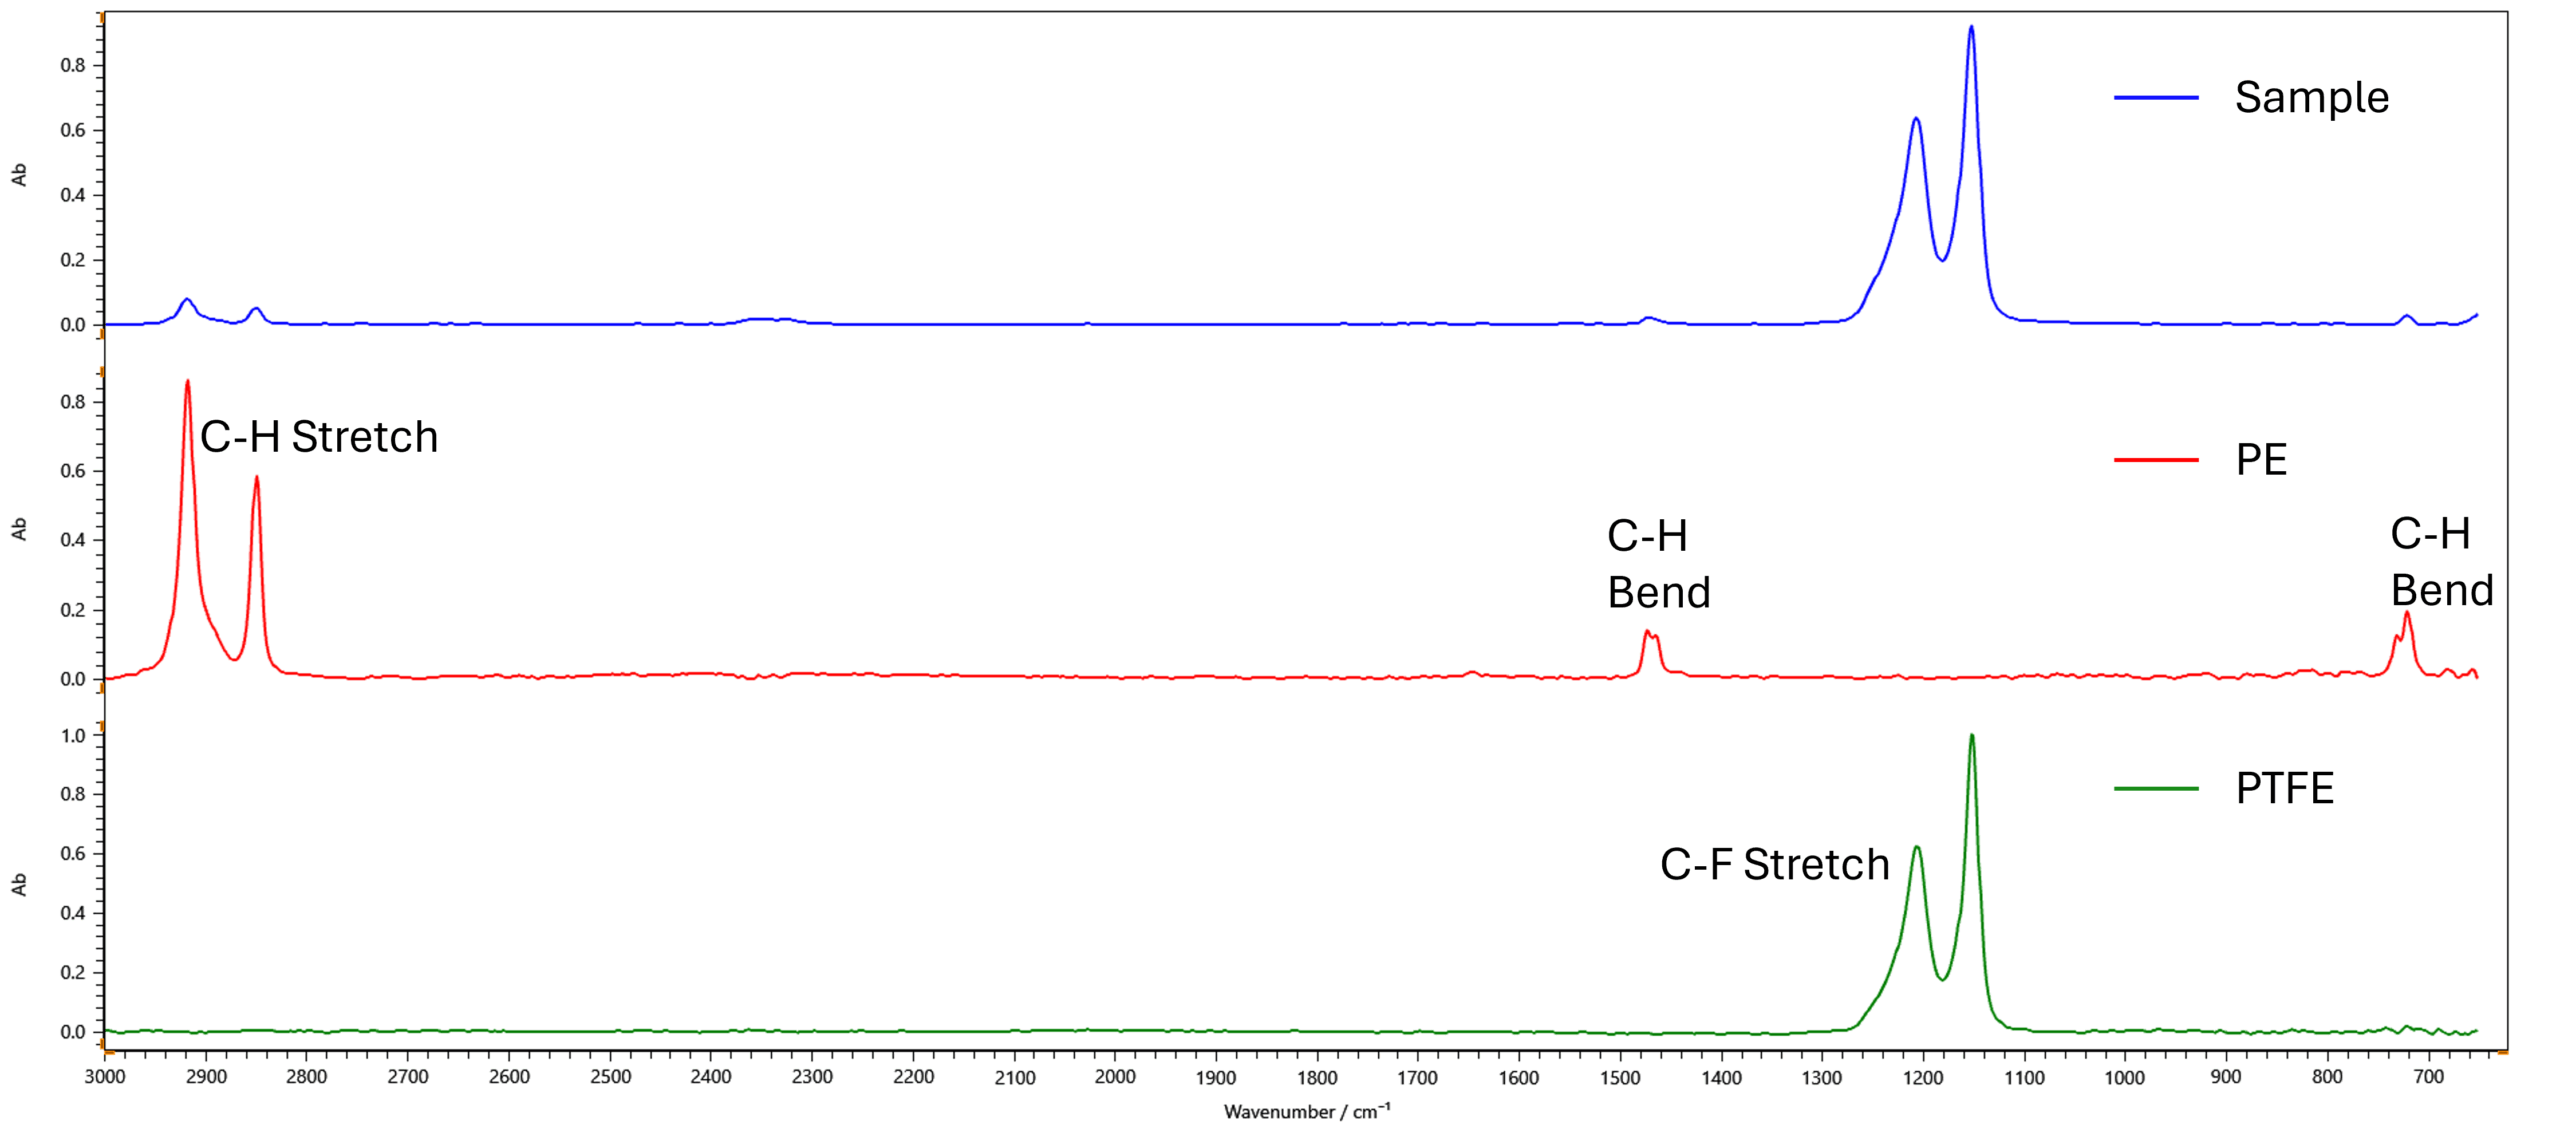
Figure 3:  FTIR spectra of the microplastic mix (blue), pure PE (red), and pure PTFE (green). 


By comparing the mixture spectrum with sample references, the large peaks that can be seen at 1204 cm-1 and 1150 cm-1 can be attributed to PTFE. The remaining peaks (2916 cm-1, 2847 cm-1, 1469 cm-1 and 719 cm-1) are characteristic of PE. 


These results were verified using the KnowItAll® spectral library.3 This software performed a multi-component analysis on the spectrum in order to identify its constituents. KnowItAll analysis confirmed that the obtained spectrum is comprised of peaks attributable to both PE and PTFE. 


Spatially Resolving Mixed Microplastics by Raman Microscopy  

Whilst FTIR spectroscopy can be used for quick, bulk measurements, Raman microscopy can be used to identify and characterise individual particles to gain insight into the distribution and morphologies of the polymers within the sample. To perform this type of analysis, the ParticleMAP® feature within Ramacle® was used. This tool allows for each individual particle to be highlighted and characterised using Raman spectroscopy. 

The mixed microplastic sample on a stainless steel slide was placed under the microscope.  Filters were applied within the software to avoid the detection of particles at the edge of the field of view and to ignore particles with an area smaller than 30 µm2. This analysed area is shown below along with the particles that were detected with ParticleMAP (Figure 4).  


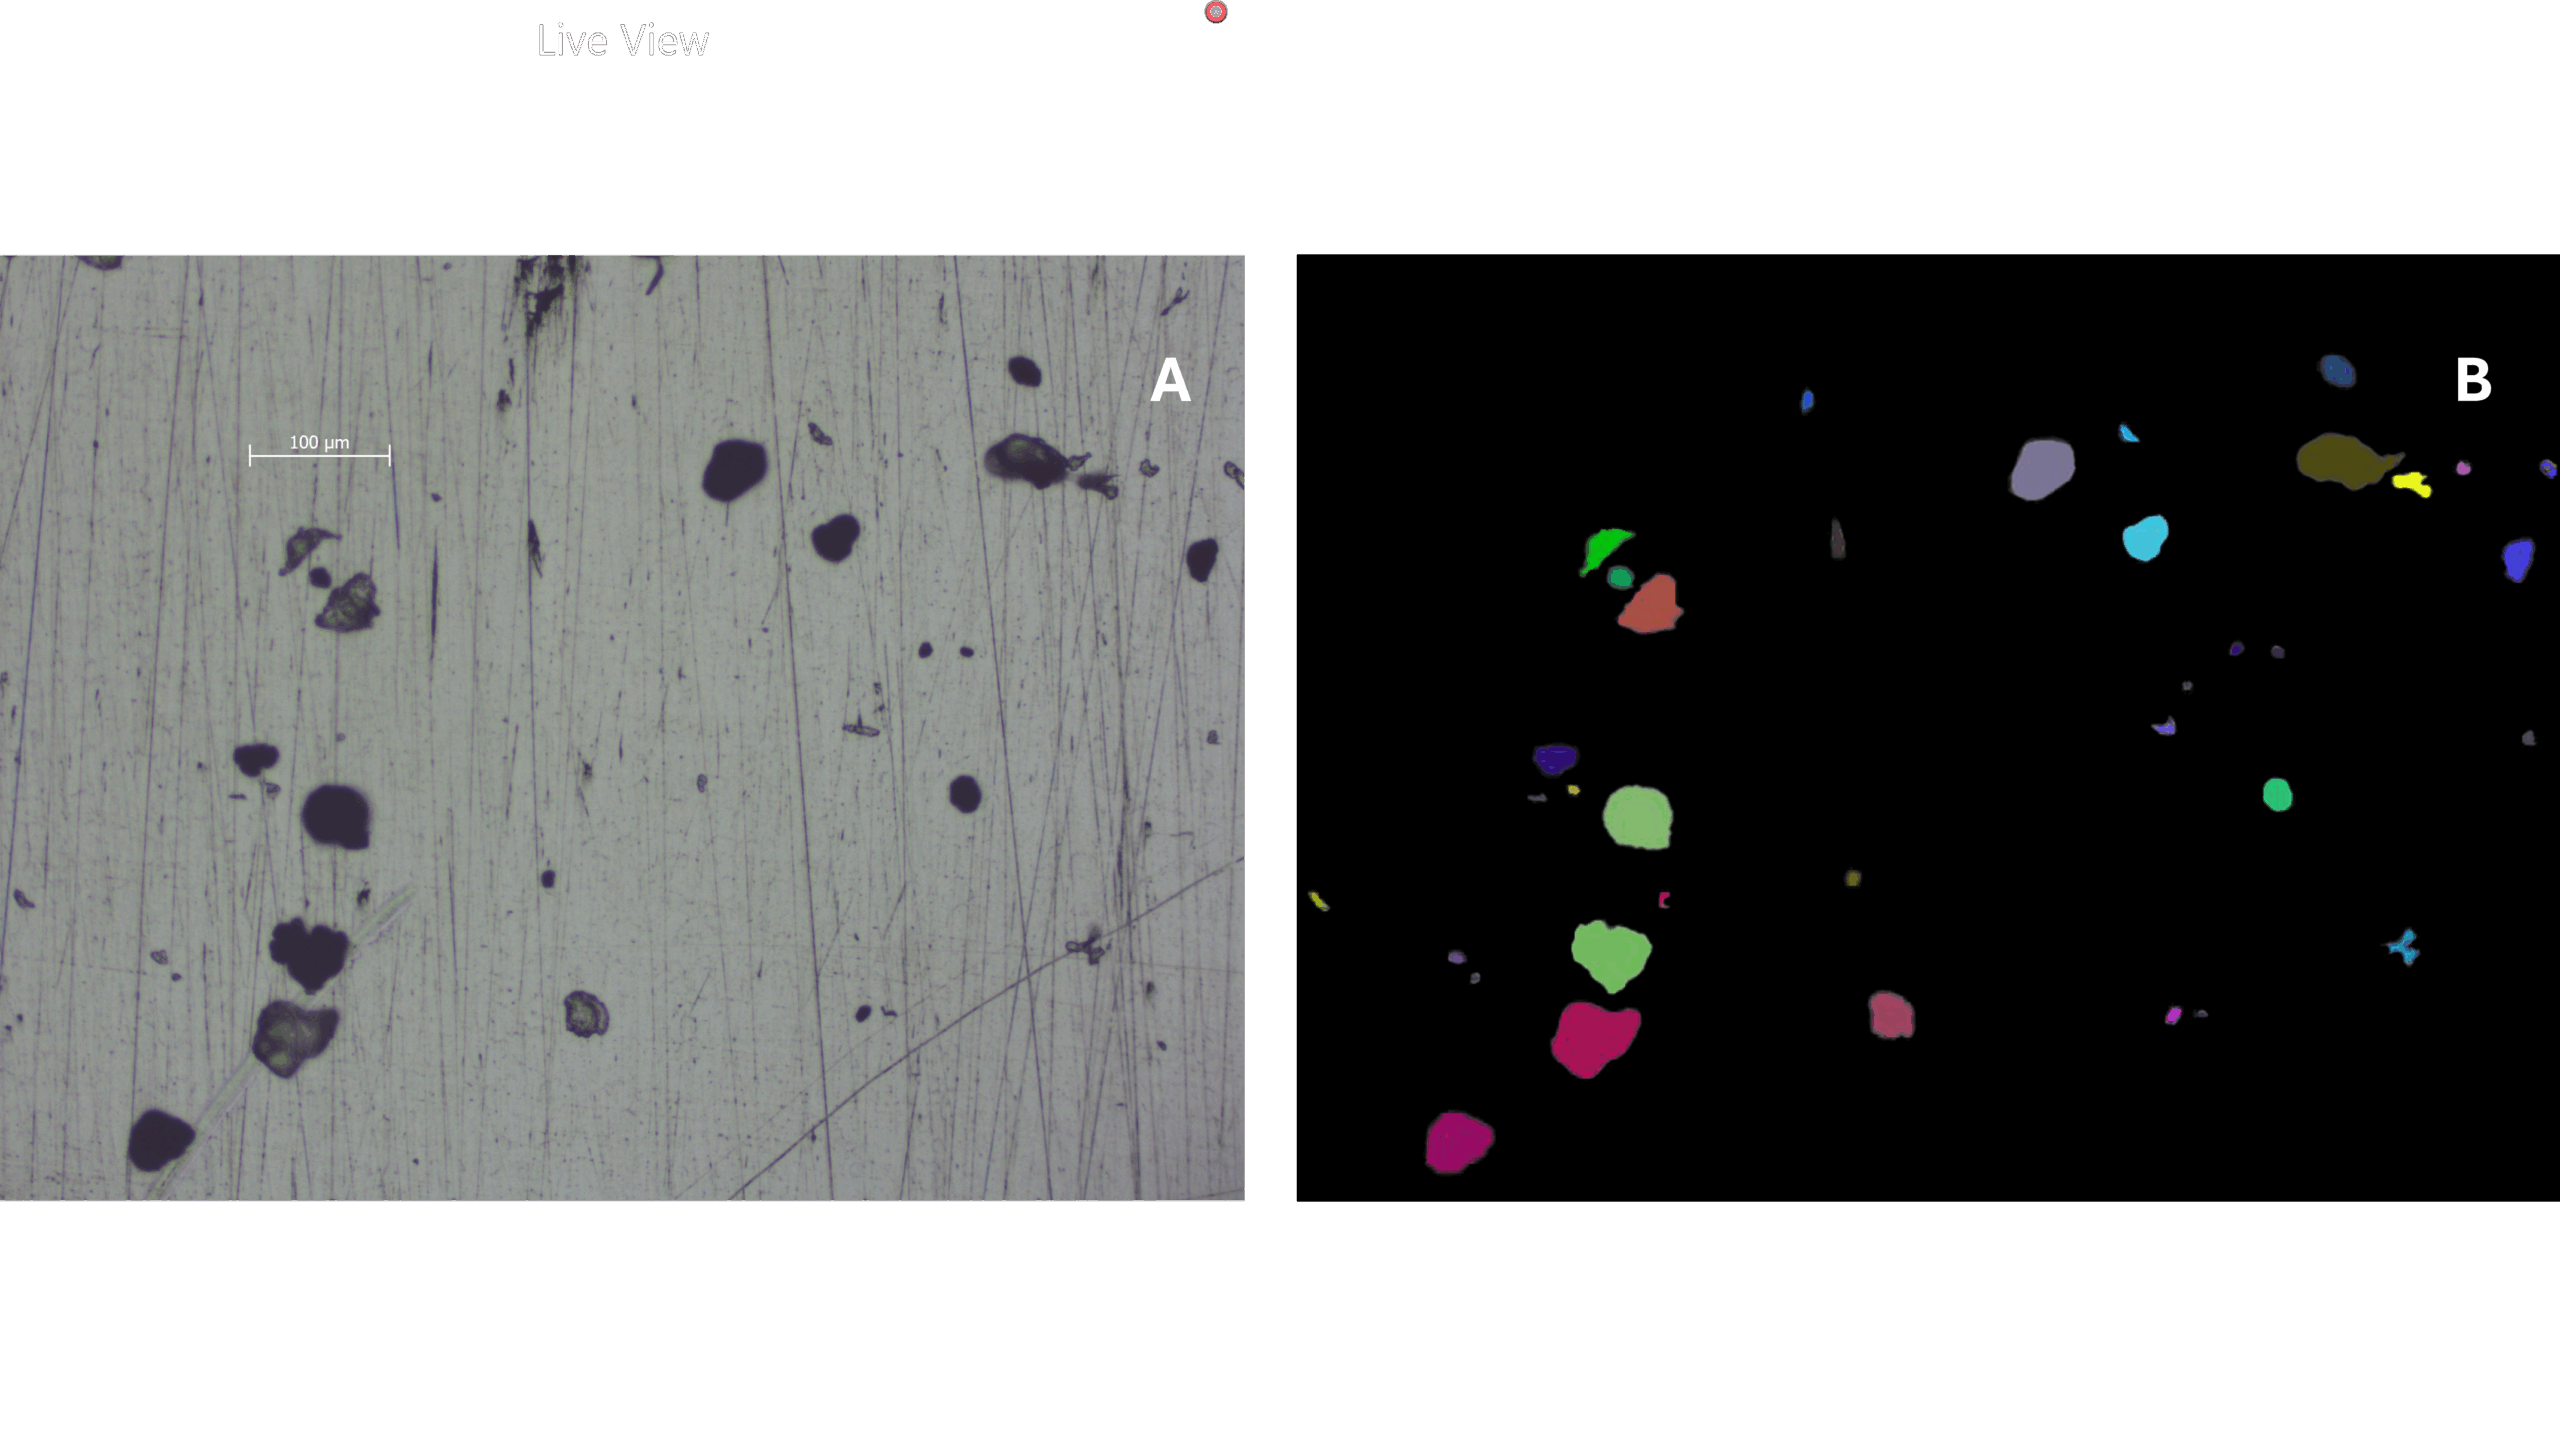
Figure 4: A) Area of slide chosen for particle analysis and B) particles detected by ParticleMAP. 


Once these particles were detected, automatic Raman measurements were carried out on each particle. Of the 30 particles that were detected, 17 were found to be PTFE and the remaining 13 were found to be PE. An example spectrum of each particle type is shown in Figure 5.  

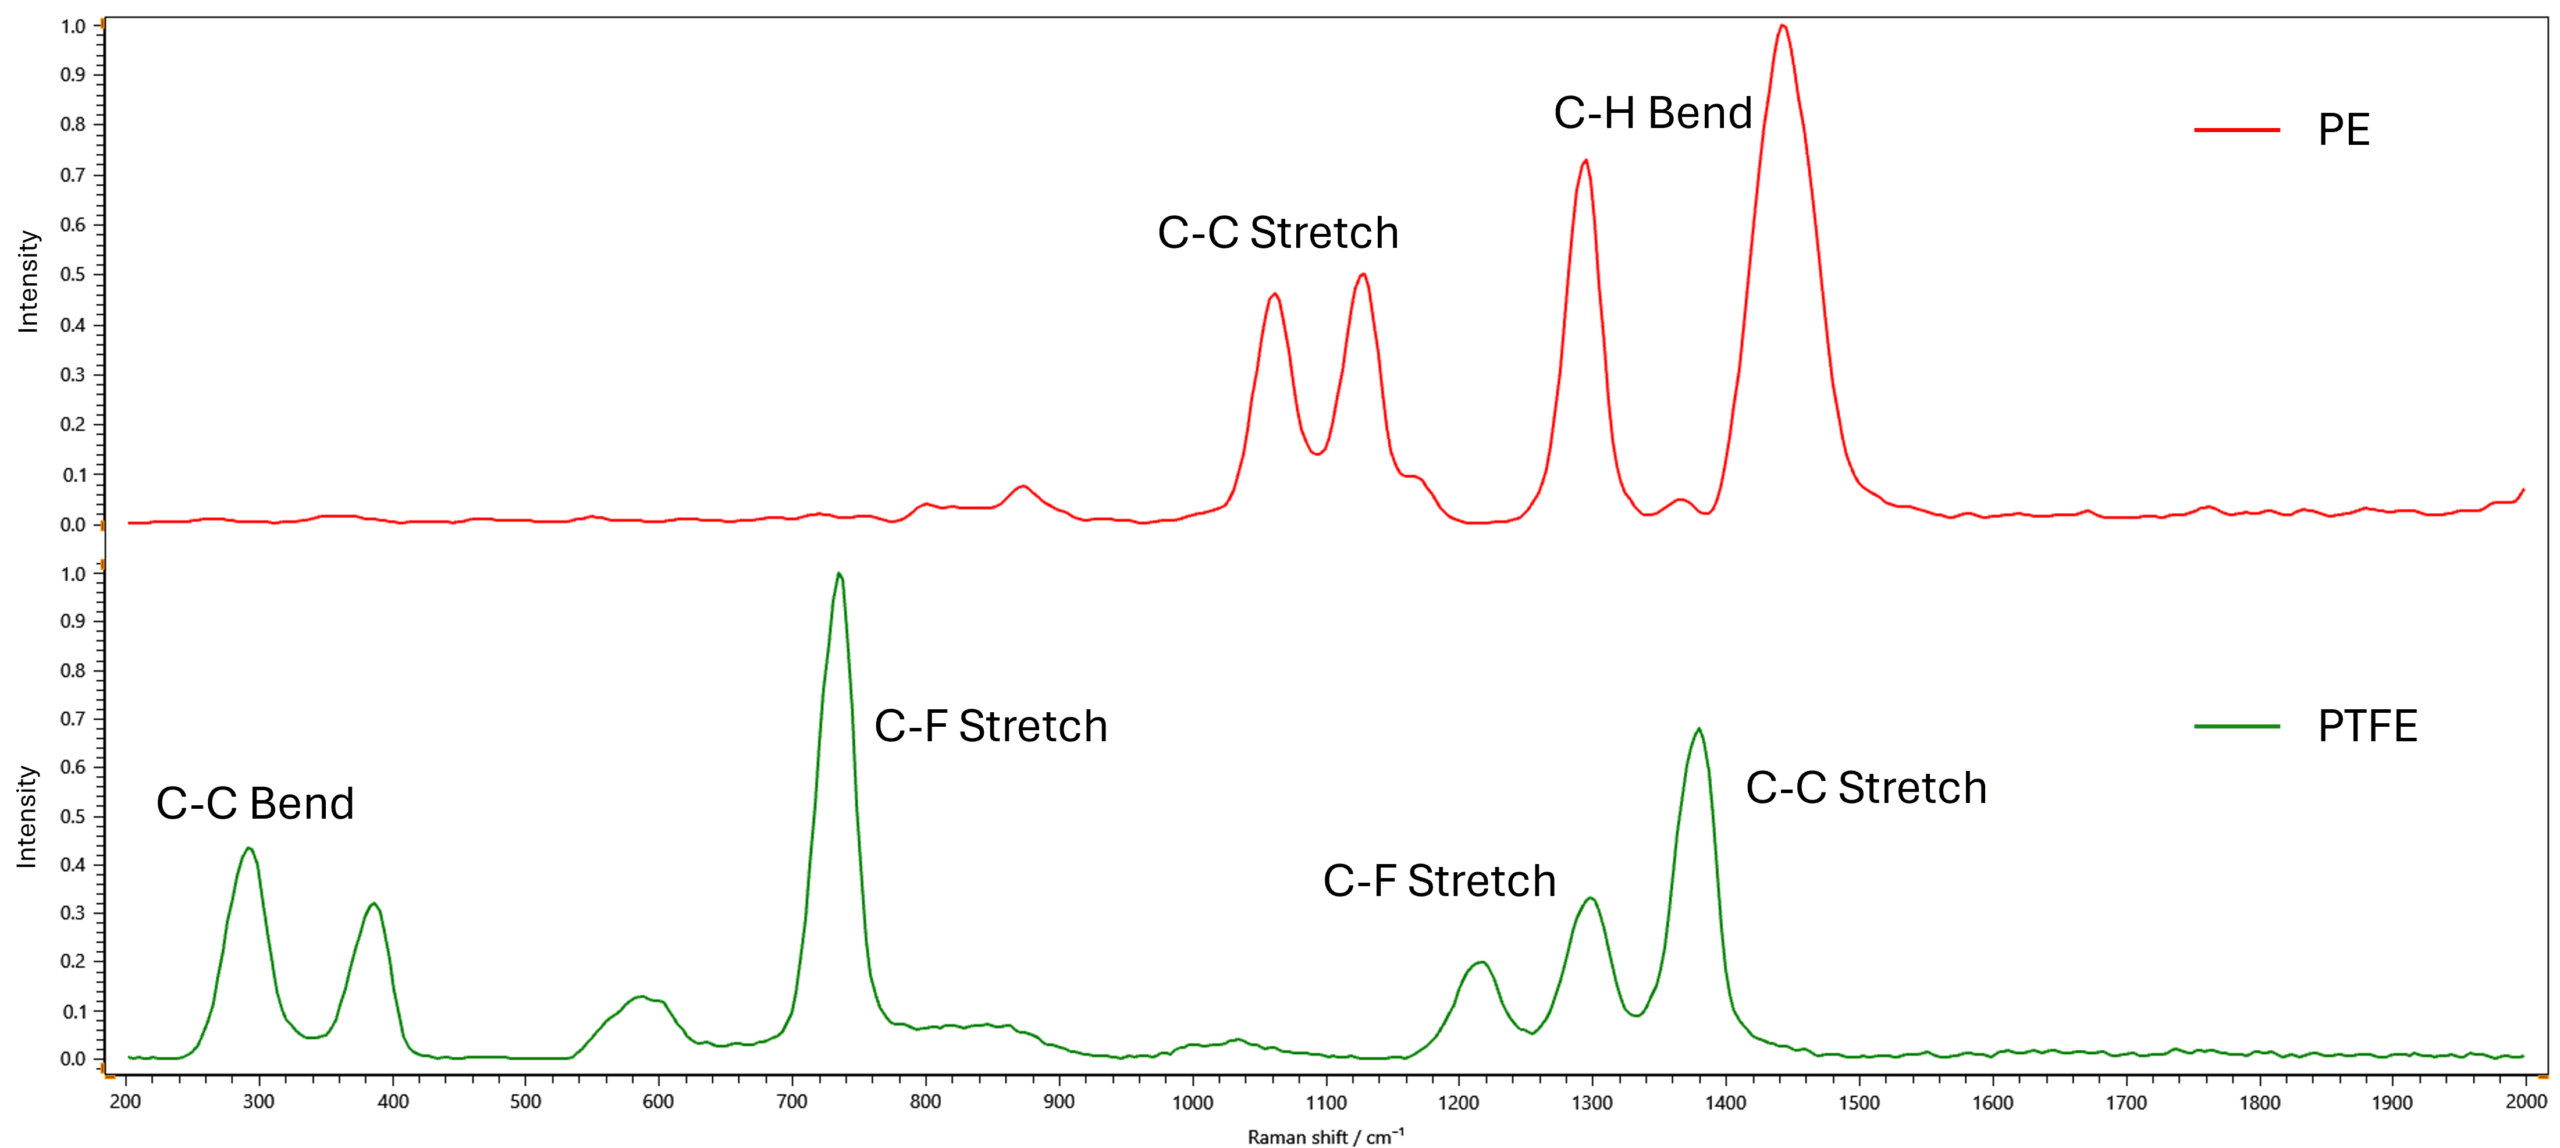
Figure 5: Raman spectra of pure PE (red) and PTFE (green).  

As well as providing detail on the identity of each of these particles, information on the size of each particle was also obtained during particle detection. This is displayed in Table 1.  

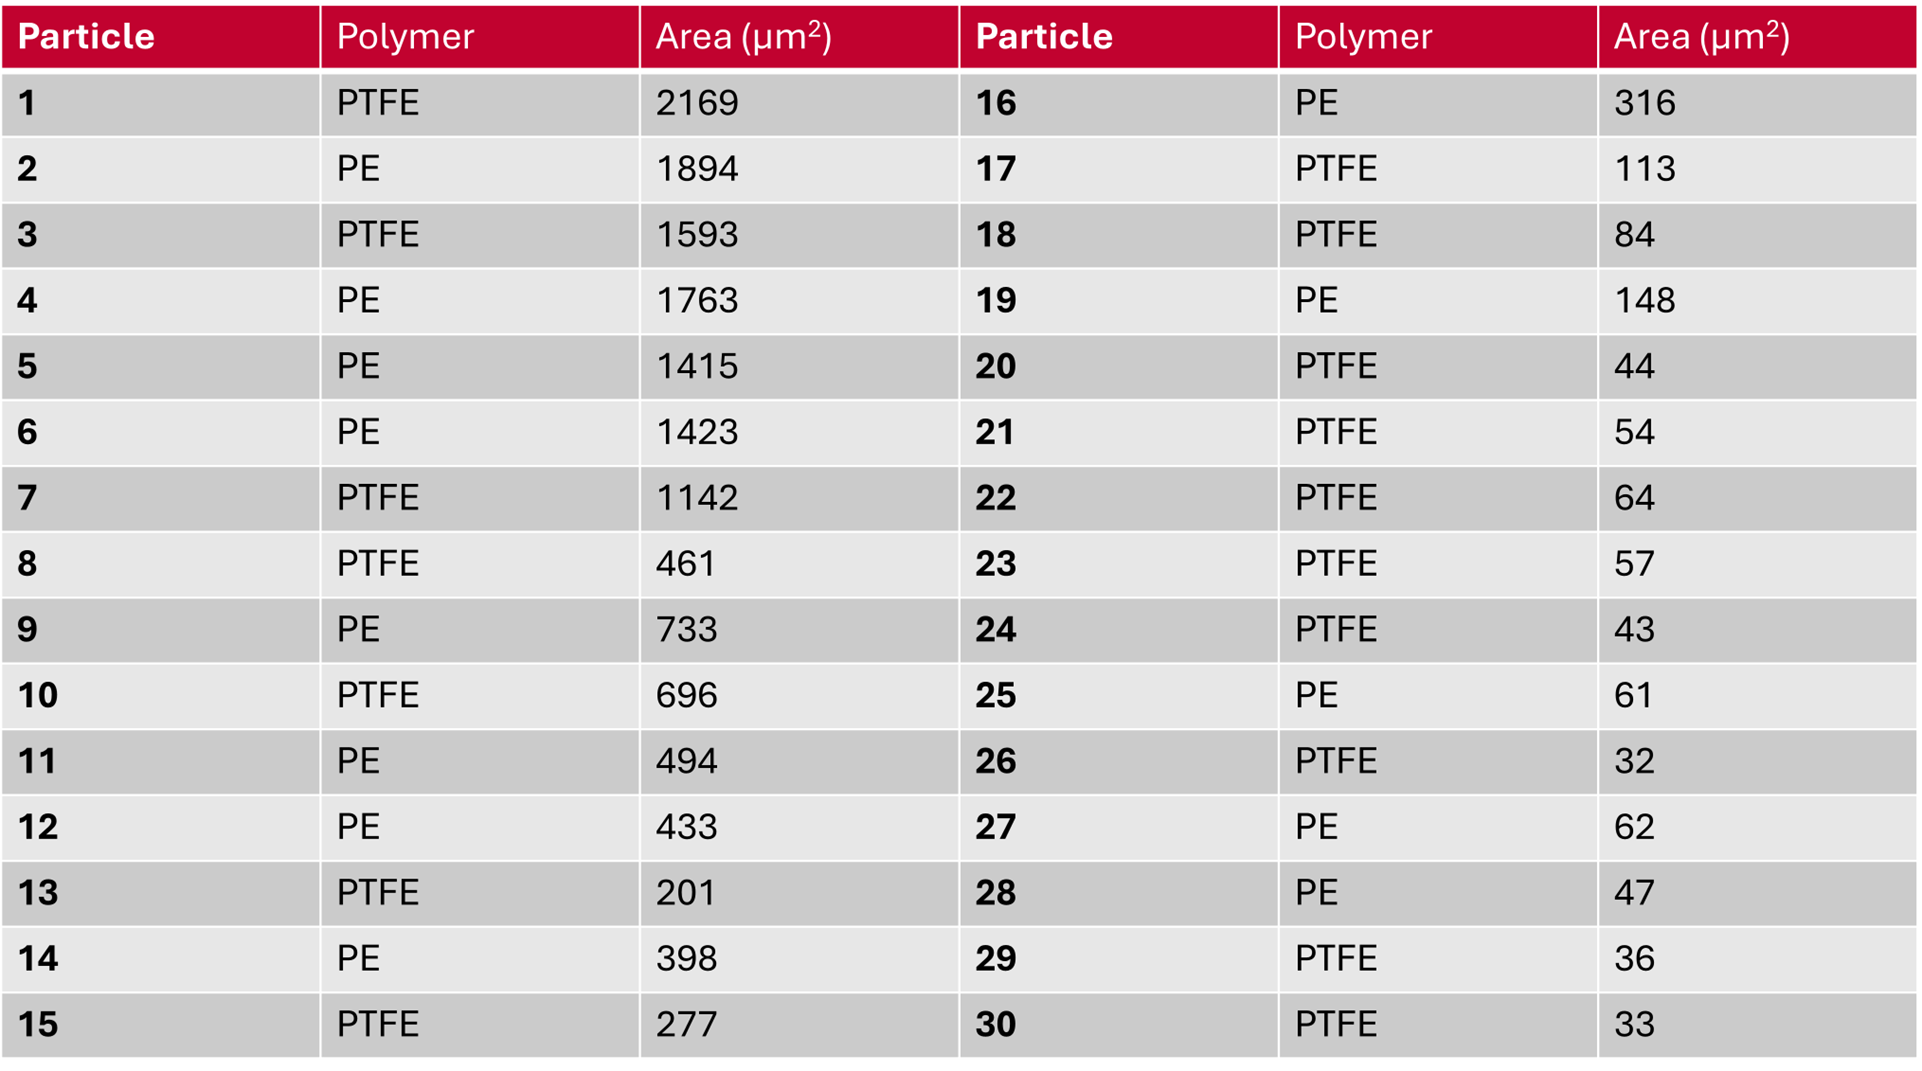
Table 1: Polymer type and Area 


An understanding of the size of particles within a sample can be vital as particle size can have a significant effect on the particle distribution and movement patterns within aquatic environments as well as the particle’s ability to enter the body and evade filters.4 


Conclusion 

The detection and characterisation of microplastics is a key aspect of tackling pollution on a global scale. Therefore, any analysis methods must be optimised and refined to provide accurate results swiftly. This Application Note has demonstrated that IR and Raman spectroscopy provide unparalleled analytical power for characterising and studying microplastics, even in complex mixtures. By using both the IR5 FTIR Spectrometer and the RM5 Raman Microscope, bulk measurements and more in-depth and comprehensive particle analysis can be recorded. 


References 

  1. G. O. Conti, M. Ferrante, M. Banni, C. Favara, I. Nicolosi, A. Cristaldi, M. Fiore, P. Zuccarello, Environmental Research, 2020, 127, 109677
  2. L. Montano, E. Giorgini, V. Notarstefano, T. Notari, M. Ricciardi, M. Piscopo, O. Motta, Science of The Total Environment, 2023, 901, 165922
  3. KnowItAll ID Expert. https://sciencesolutions.wiley.com/knowitall-spectroscopy-software/
  4. E. Ward, M. Gordon, R. Hanson, L. Jantunen, Atmospheric Environment, 2024, 326, 120458

RELATED PRODUCTS

IR5

FTIR Spectrometer

VIEW

RMS1000

Multimodal Confocal Microscope

VIEW

RM5

Raman Microscope

VIEW

Contact our expert team today to find out more about how our products can improve your research

Contact Us
PrevPrevious
NextNext
Previous What is TRES? Next Optical Properties of Dysprosium Ions for Mid-IR Laser Applications

RESOURCES

Tags:
  • Application Notes
  • Environment
  • Plastics & Microplastics
  • IR5
  • RM5
  • RMS1000
  • FTIR
  • Raman
Download PDF
Featured Product:

IR5 FTIR Spectrometer

View more »

RM5 Raman Microscope

View more »
Suggested Reading:

Identification of Microplastics Using Raman Spectroscopy

View more »
Share:

Keep up to date with the latest from Edinburgh Instruments

Join our mailing list and keep up with our latest videos, app notes and more!

LOCATION:
  • Edinburgh Instruments Ltd.
    2 Bain Square, Kirkton Campus, Livingston, EH54 7DQ.
  • sales@edinst.com
  • +44 1506 425 300
ABOUT:
  • About Us
  • Techniques
  • Applications
  • Knowledgebase
  • About Us
  • Techniques
  • Applications
  • Knowledgebase
PRODUCTS:
  • Fluorescence Spectrometers
  • Raman Microscopes
  • UV-Vis Spectrophotometers
  • Transient Absorption
  • FTIR Spectrometers
  • Lasers and LEDs
  • Customisation Options
  • Software
  • Upgrades
  • All Products
  • Fluorescence Spectrometers
  • Raman Microscopes
  • UV-Vis Spectrophotometers
  • Transient Absorption
  • FTIR Spectrometers
  • Lasers and LEDs
  • Customisation Options
  • Software
  • Upgrades
  • All Products
LEGALS:
  • News
  • Events
  • Blog
  • Careers
  • Contact Us
  • Terms and Conditions
  • Privacy Policy
  • News
  • Events
  • Blog
  • Careers
  • Contact Us
  • Terms and Conditions
  • Privacy Policy
SOCIALS:
Youtube Linkedin X-twitter Facebook
©2024 Edinburgh Instruments. Registered in England and Wales No: 962331. VAT No: GB 271 7379 37
Manage Consent
To provide the best experiences, we use technologies like cookies to store and/or access device information. Consenting to these technologies will allow us to process data such as browsing behaviour or unique IDs on this site. Not consenting or withdrawing consent, may adversely affect certain features and functions.
Functional Always active
The technical storage or access is strictly necessary for the legitimate purpose of enabling the use of a specific service explicitly requested by the subscriber or user, or for the sole purpose of carrying out the transmission of a communication over an electronic communications network.
Preferences
The technical storage or access is necessary for the legitimate purpose of storing preferences that are not requested by the subscriber or user.
Statistics
The technical storage or access that is used exclusively for statistical purposes. The technical storage or access that is used exclusively for anonymous statistical purposes. Without a subpoena, voluntary compliance on the part of your Internet Service Provider, or additional records from a third party, information stored or retrieved for this purpose alone cannot usually be used to identify you.
Marketing
The technical storage or access is required to create user profiles to send advertising, or to track the user on a website or across several websites for similar marketing purposes.
Manage options Manage services Manage {vendor_count} vendors Read more about these purposes
View preferences
{title} {title} {title}