Skip to content
  • News
  • Events
  • eBooks
  • Blog
  • Careers
  • Contact
  • News
  • Events
  • eBooks
  • Blog
  • Careers
  • Contact
KNOWLEDGEBASE
  • About Us
  • Products

    Fluorescence Spectrometers:

    • FLS1000 Photoluminescence Spectrometer
    • FS5 Spectrofluorometer
    • LifeSpec II Lifetime Spectrometer
    • Mini-tau Lifetime Spectrometer

    Raman Microscopes:

    • RM5 Raman Microscope
    • RMS1000 Multimodal Confocal Microscope

    Transient Absorption:

    • LP980 Transient Absorption Spectrometer

    FTIR Spectrometers:

    • IR5 FTIR Spectrometer

    Lasers and LEDs:

    • Pulsed Lasers
    • Gas Lasers

    Options:

    • Upgrades
    • Customisation
    View All Products
  • Techniques
  • Applications
KNOWLEDGEBASE
  • About Edinburgh Instruments
  • Products
  • Techniques
  • Applications Old
  • Knowledgebase
  • eBooks
  • News
  • Events
  • Blog
  • Careers
  • Contact Us

RESOURCES

Automating Raman Microscopy Analysis with Chemometrics

  • March 19, 2026

KEY POINTS

  • Chemometrics transforms large Raman microscopy datasets into meaningful chemical information, reducing the need for time-consuming manual analysis.
  • PCA and t-SNE reveal spectral variation and chemically distinct populations, while K-means clustering segments Raman maps into discrete chemical regions.
  • Non-negative least squares (NNLS) enables quantitative chemical mapping, showing where known components are distributed and their relative contributions.

Raman microscopy combines chemical specificity with spatially resolved measurements, making it a powerful tool for characterising complex and heterogeneous materials. However, Raman maps can contain enormous quantities of spectral information. In one example from the webinar, a single map contained 18,640 spectra with 2,000 data points each, resulting in more than 37 million individual data points.

In this Edinburgh Instruments webinar, Grant Cumming and Dr Matthew Berry explore how chemometrics and multivariate analysis can automate Raman imaging, moving beyond manual peak picking to extract meaningful chemical information from complex datasets.


Exploring Raman Data with PCA and t-SNE

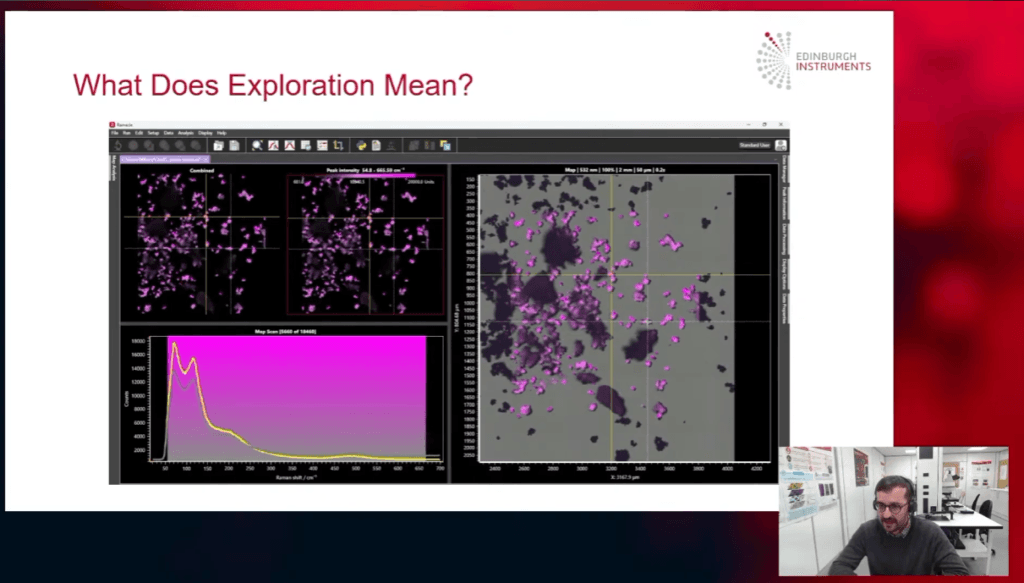
Chemometrics uses mathematical methods to uncover patterns and chemical information within large, high-dimensional datasets. The webinar considers three key analytical goals: exploration, segmentation and quantification.

Principal component analysis (PCA) provides an objective way to explore Raman maps by identifying the dominant sources of spectral variation. PCA analyses every spectrum simultaneously and produces principal components that can be mapped spatially, helping researchers identify chemically distinct regions without deciding beforehand what features to search for.

For more complex datasets, t-distributed stochastic neighbour embedding (t-SNE) offers a complementary approach. While PCA is linear, t-SNE can reveal more clearly defined spectral populations and boundaries that may otherwise appear as continuous variation. Together, the two techniques provide complementary ways to explore unknown or heterogeneous samples.


Segmenting Chemical Populations with K-Means Clustering

When the aim shifts from exploring variation to identifying discrete chemical populations, K-means clustering can automatically group spectra according to their similarity. The result is a spatially resolved Raman map in which pixels are assigned to chemically distinct clusters, without requiring prior peak selection.

The webinar demonstrates this approach using tungsten disulfide with regions of different layer numbers. K-means distinguishes the different Raman signatures and maps the resulting clusters spatially. A silhouette score can also be used to assess cluster separation and automatically select an appropriate number of clusters.


Quantitative Raman Mapping with NNLS

Where the chemical components are already known, non-negative least squares (NNLS) takes Raman analysis a step further by estimating their contribution at each pixel. Each measured spectrum is modelled as a linear combination of reference spectra, with a non-negativity constraint that prevents physically unrealistic negative component contributions.

Applied to a complex battery electrode, the approach produces chemical distribution maps for multiple phases alongside a residual map, providing a way to assess how well the proposed compositional model explains the experimental Raman data.


Watch the Raman Chemometrics Webinar

Watch the full webinar to hear Grant Cumming and Dr Matthew Berry demonstrate how PCA, t-SNE, K-means clustering and NNLS can streamline Raman microscopy data analysis, reveal hidden chemical variation and turn complex hyperspectral maps into clearer, actionable chemical information.
Read More Read Less

RELATED PRODUCTS

RMS1000

Multimodal Confocal Microscope

VIEW

RM5

Raman Microscope

VIEW

Contact our expert team today to find out more about how our products can improve your research

Contact Us
PrevPrevious
NextNext
Previous Multi-well Plate Analysis for High-Throughput Raman Spectroscopy Next CCD or InGaAs? A Guide to Silicon PL Detection on a Raman Microscope

RESOURCES

Raman Chemometrics Webinar Featured Image
Tags:
  • Webinars
  • 2D Materials
  • Energy
  • Semiconductors
  • RM5
  • RMS1000
  • Raman
Featured Product:

RMS1000 Raman Microscope

View more »

RM5 Raman Microscope

View more »
Suggested Reading:

Confocal Raman Imaging and Chemometric Analysis of Battery Electrode Degradation

View more »

Correlating Structural Defects and Radiative Efficiency in Silicon Wafers Using Simultaneous Raman and PL Multivariate Imaging

View more »
Share:

Keep up to date with the latest from Edinburgh Instruments

Join our mailing list and keep up with our latest videos, app notes and more!

LOCATION:
  • Edinburgh Instruments Ltd.
    2 Bain Square, Kirkton Campus, Livingston, EH54 7DQ
  • sales@edinst.com
  • +44 1506 425 300
ABOUT:
  • About Edinburgh Instruments
  • Techniques
  • Applications
  • Knowledgebase
  • About Edinburgh Instruments
  • Techniques
  • Applications
  • Knowledgebase
PRODUCTS:
  • Fluorescence Spectrometers
  • Raman Microscopes
  • UV-Vis Spectrophotometers
  • Transient Absorption
  • FTIR Spectrometers
  • Lasers and LEDs
  • Customisation Options
  • Software
  • Upgrades
  • All Products
  • Fluorescence Spectrometers
  • Raman Microscopes
  • UV-Vis Spectrophotometers
  • Transient Absorption
  • FTIR Spectrometers
  • Lasers and LEDs
  • Customisation Options
  • Software
  • Upgrades
  • All Products
LEGALS:
  • News
  • Events
  • Blog
  • Careers
  • Distribution & Agents
  • Contact Us
  • Terms and Conditions
  • Privacy Policy
  • Coordinated Vulnerability Disclosure Policy
  • News
  • Events
  • Blog
  • Careers
  • Distribution & Agents
  • Contact Us
  • Terms and Conditions
  • Privacy Policy
  • Coordinated Vulnerability Disclosure Policy
SOCIALS:
Youtube Linkedin X-twitter Facebook
©2026 Edinburgh Instruments. Registered in England and Wales No: 962331. VAT No: GB 271 7379 37
Manage Consent
To provide the best experiences, we use technologies like cookies to store and/or access device information. Consenting to these technologies will allow us to process data such as browsing behaviour or unique IDs on this site. Not consenting or withdrawing consent, may adversely affect certain features and functions.
Functional Always active
The technical storage or access is strictly necessary for the legitimate purpose of enabling the use of a specific service explicitly requested by the subscriber or user, or for the sole purpose of carrying out the transmission of a communication over an electronic communications network.
Preferences
The technical storage or access is necessary for the legitimate purpose of storing preferences that are not requested by the subscriber or user.
Statistics
The technical storage or access that is used exclusively for statistical purposes. The technical storage or access that is used exclusively for anonymous statistical purposes. Without a subpoena, voluntary compliance on the part of your Internet Service Provider, or additional records from a third party, information stored or retrieved for this purpose alone cannot usually be used to identify you.
Marketing
The technical storage or access is required to create user profiles to send advertising, or to track the user on a website or across several websites for similar marketing purposes.
  • Manage options
  • Manage services
  • Manage {vendor_count} vendors
  • Read more about these purposes
View preferences
  • {title}
  • {title}
  • {title}