Welcome to Edinburgh Instruments monthly blog celebrating our work in Raman, Photoluminescence, and Fluorescence Lifetime Imaging. Every month we will highlight our pick for Map of the Month to show how our spectrometers can be used to reveal all the hidden secrets in your samples.
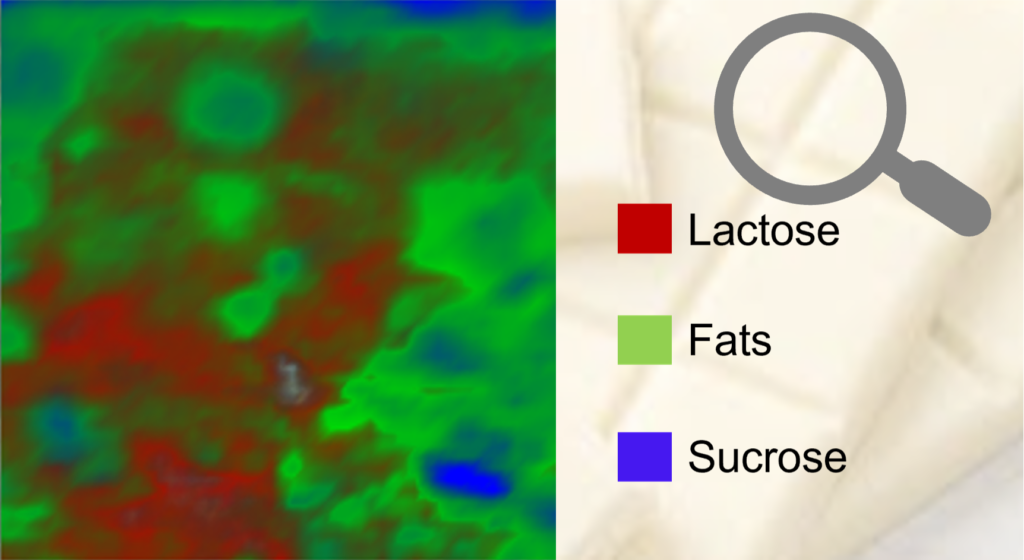
Raman microscopy’s mapping capabilities can be extremely useful in food analysis. The technique can be used for identifying components and their distribution, as well as detecting anything potentially dangerous in samples. Since Cadbury’s introduced the first chocolate bar in 1842, the chocolate market has continued to grow, valued in 2021 at US$ 131.37 billion. Raman spectroscopy can be used to study ingredients and their phase changes, and when coupled with a confocal microscope Raman mapping allows the three main constituents of white chocolate: sucrose, lactose, and fat, to be spatially resolved.

Figure 1: Raman image of a sample of white chocolate highlighting its constituents
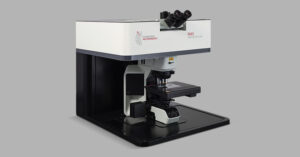
An RM5 equipped with a 785 nm laser mapped the surface of the white chocolate revealing a matrix of fats containing particles of lactose and sucrose, Figure 1.